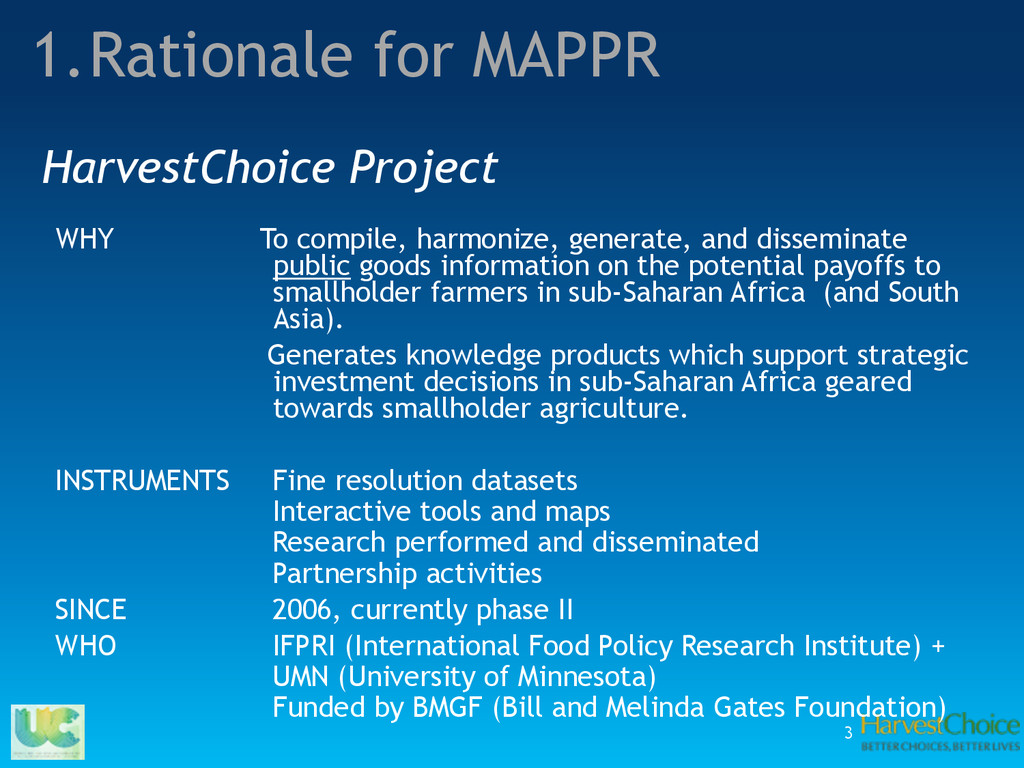
on the potential payoffs to smallholder farmers in sub-Saharan Africa (and South Asia). Generates knowledge products which support strategic investment decisions in sub-Saharan Africa geared towards smallholder agriculture. ! INSTRUMENTS Fine resolution datasets Interactive tools and maps Research performed and disseminated Partnership activities SINCE 2006, currently phase II WHO IFPRI (International Food Policy Research Institute) + UMN (University of Minnesota) Funded by BMGF (Bill and Melinda Gates Foundation) 3 HarvestChoice Project 1.Rationale for MAPPR
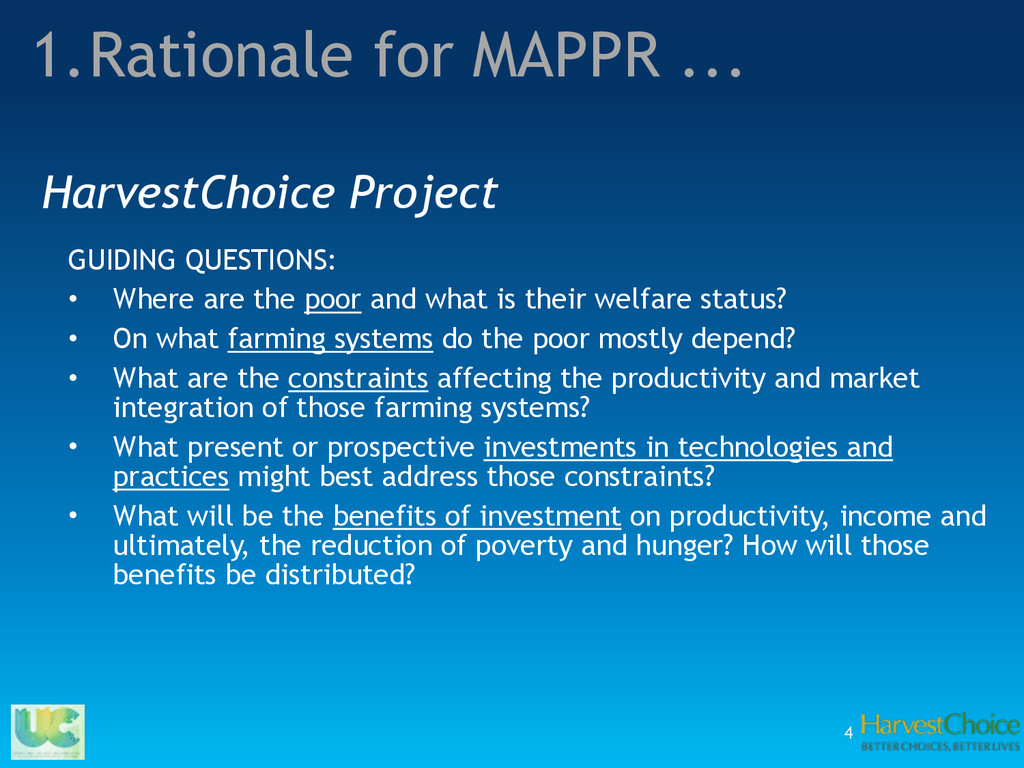
their welfare status? • On what farming systems do the poor mostly depend? • What are the constraints affecting the productivity and market integration of those farming systems? • What present or prospective investments in technologies and practices might best address those constraints? • What will be the benefits of investment on productivity, income and ultimately, the reduction of poverty and hunger? How will those benefits be distributed? 4 HarvestChoice Project 1.Rationale for MAPPR ...
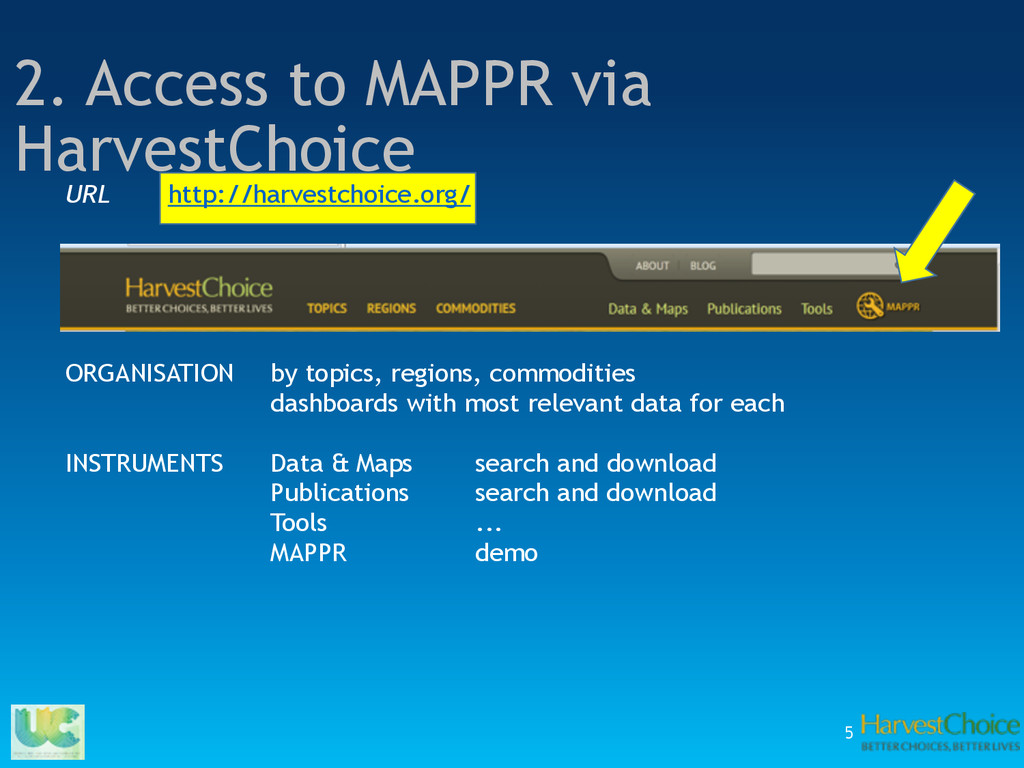
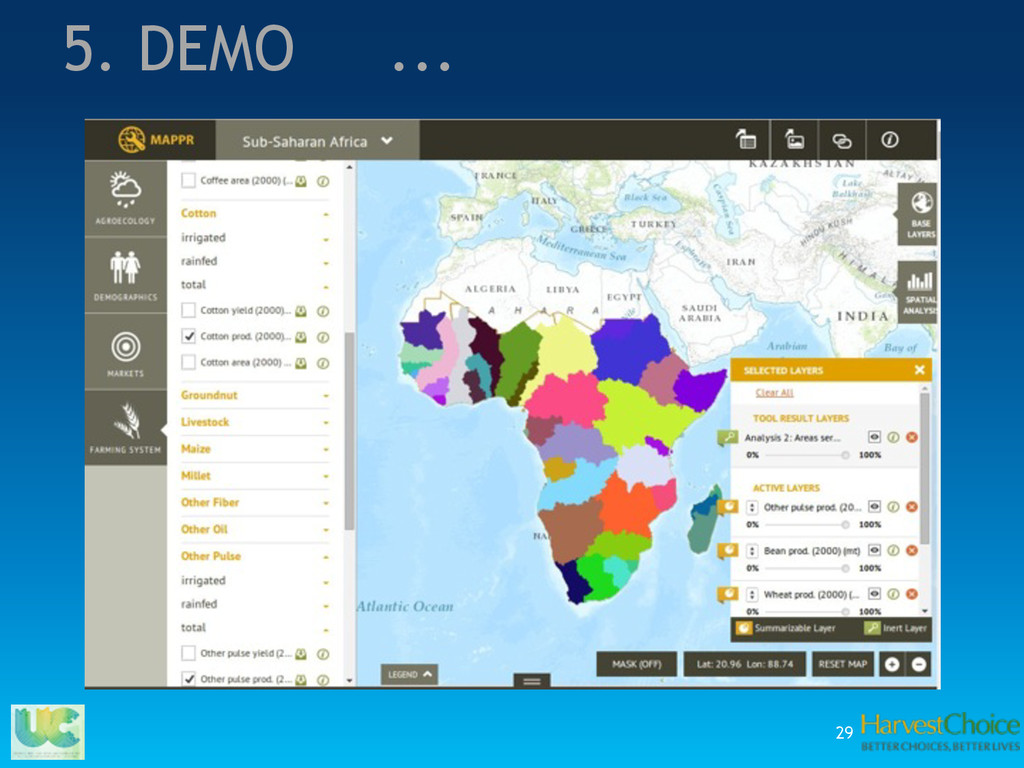
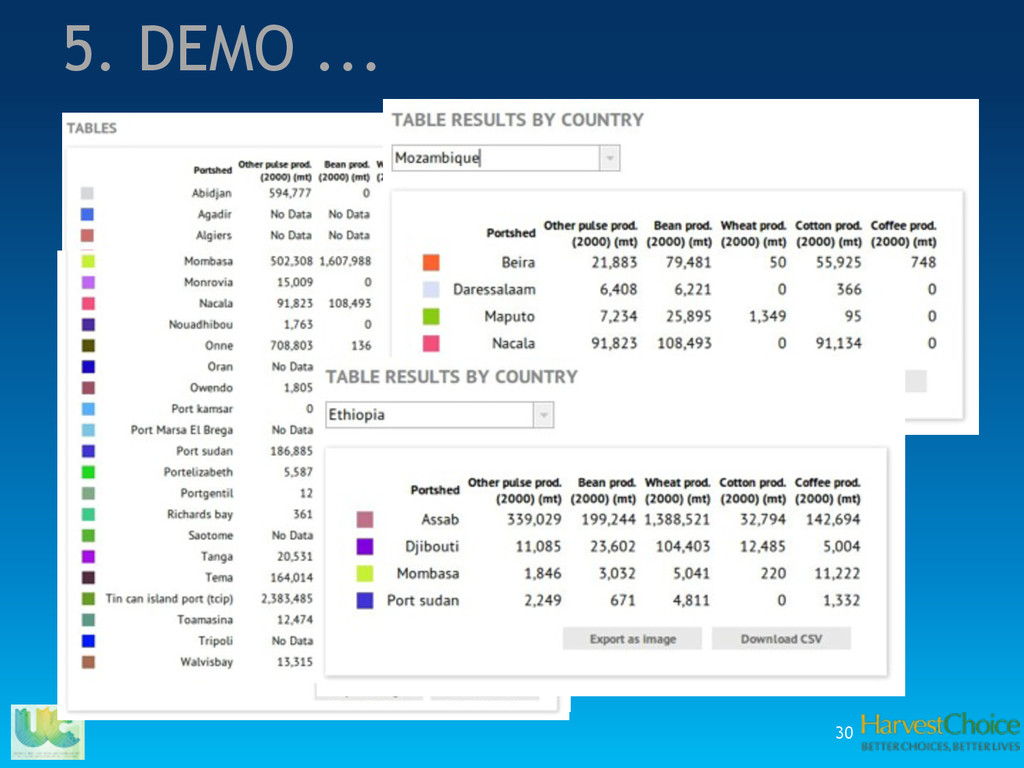
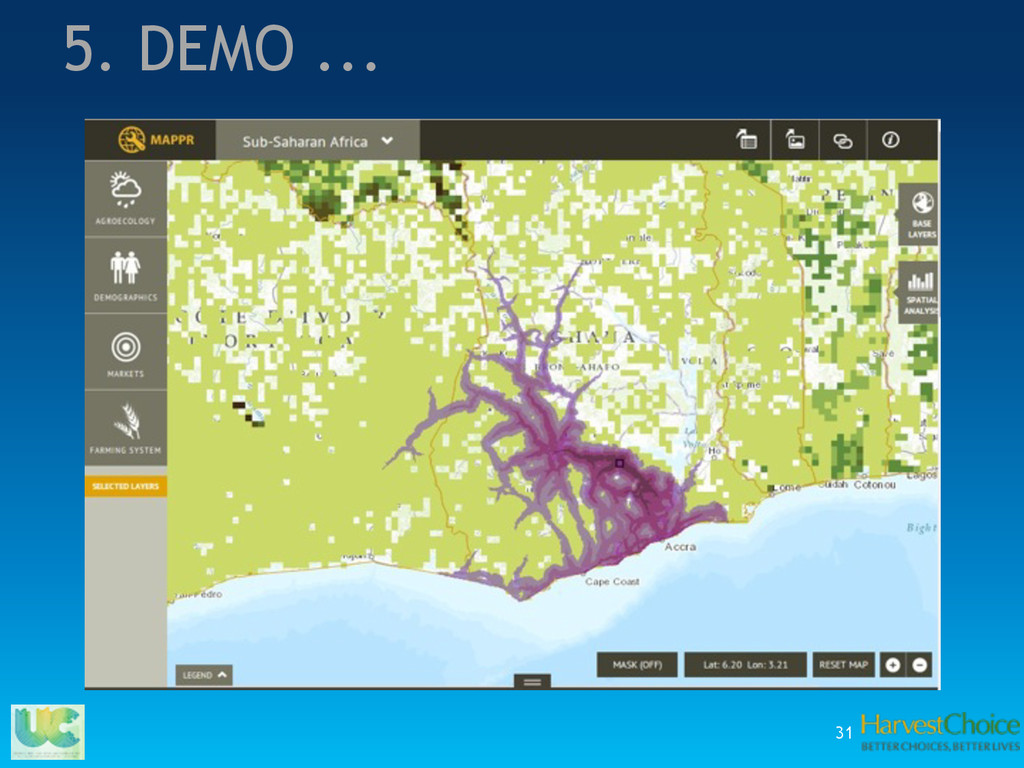
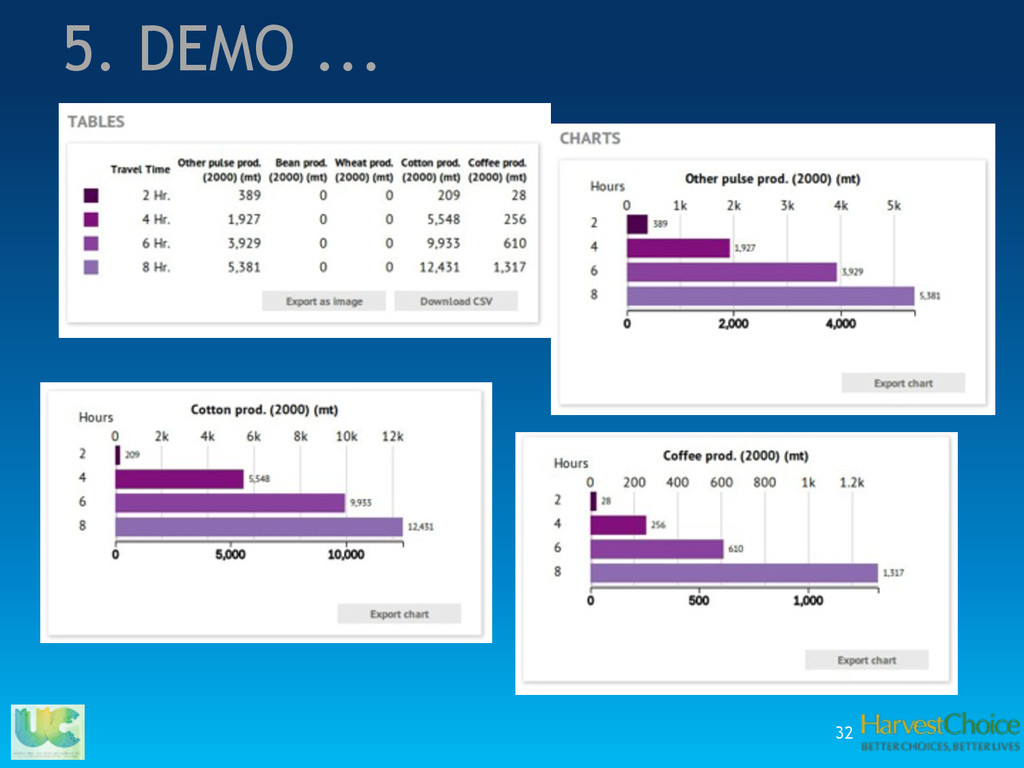
! ! ! ! ORGANISATION by topics, regions, commodities dashboards with most relevant data for each ! INSTRUMENTS Data & Maps search and download Publications search and download Tools ... MAPPR demo
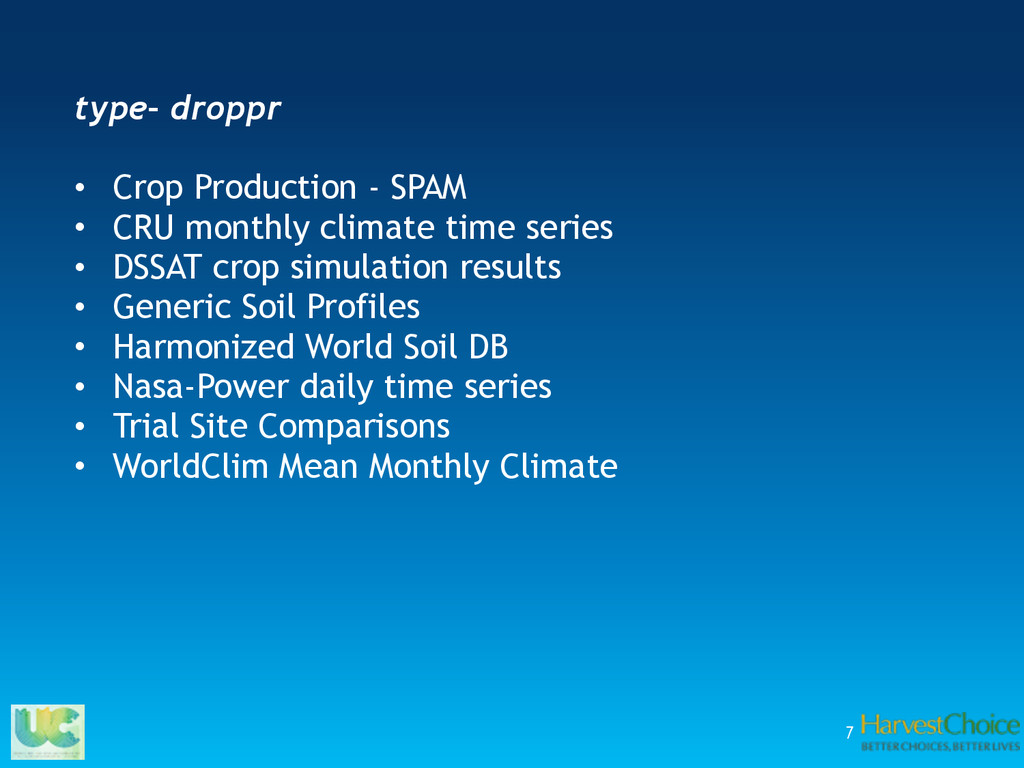
CRU monthly climate time series • DSSAT crop simulation results • Generic Soil Profiles • Harmonized World Soil DB • Nasa-Power daily time series • Trial Site Comparisons • WorldClim Mean Monthly Climate
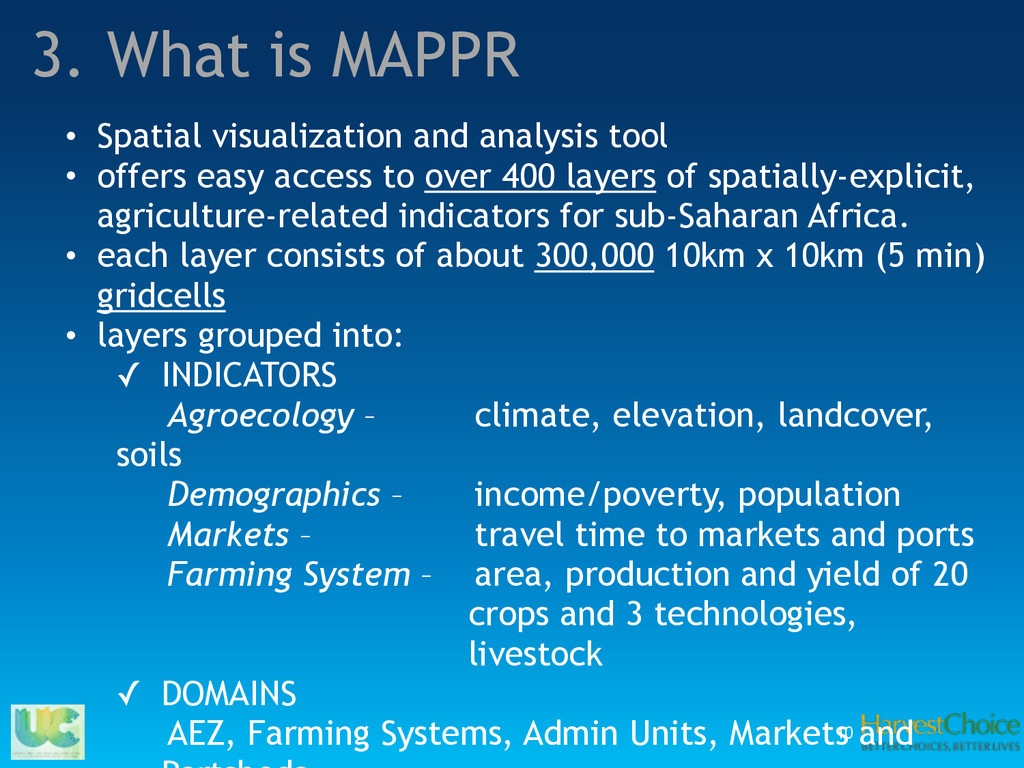
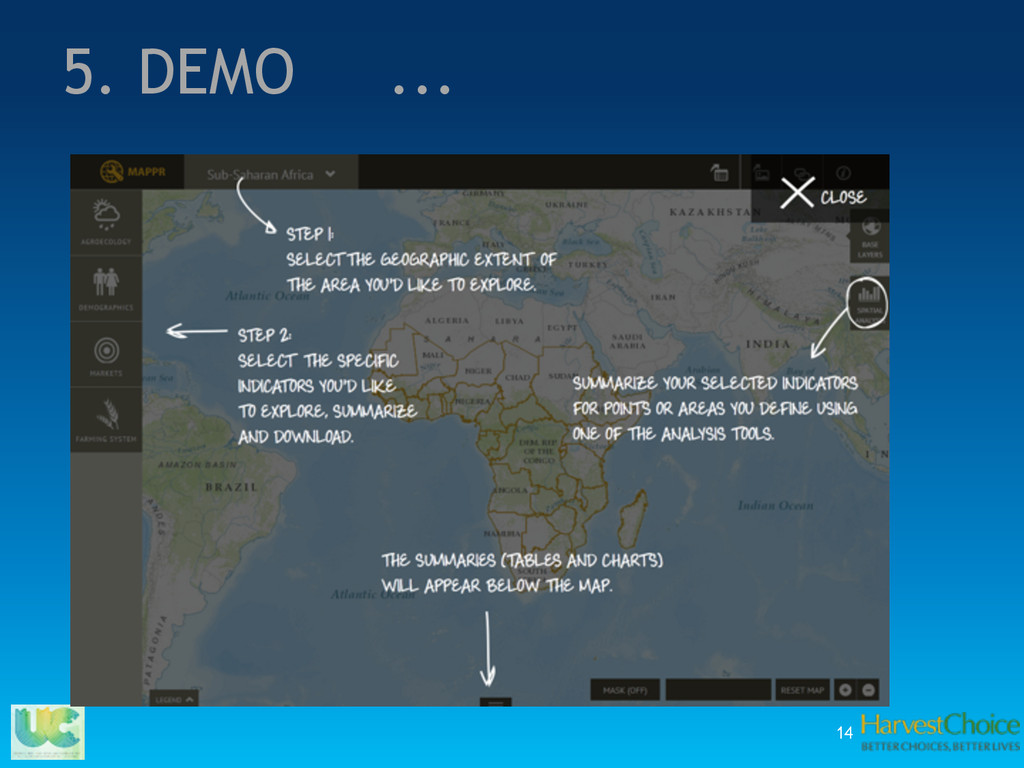
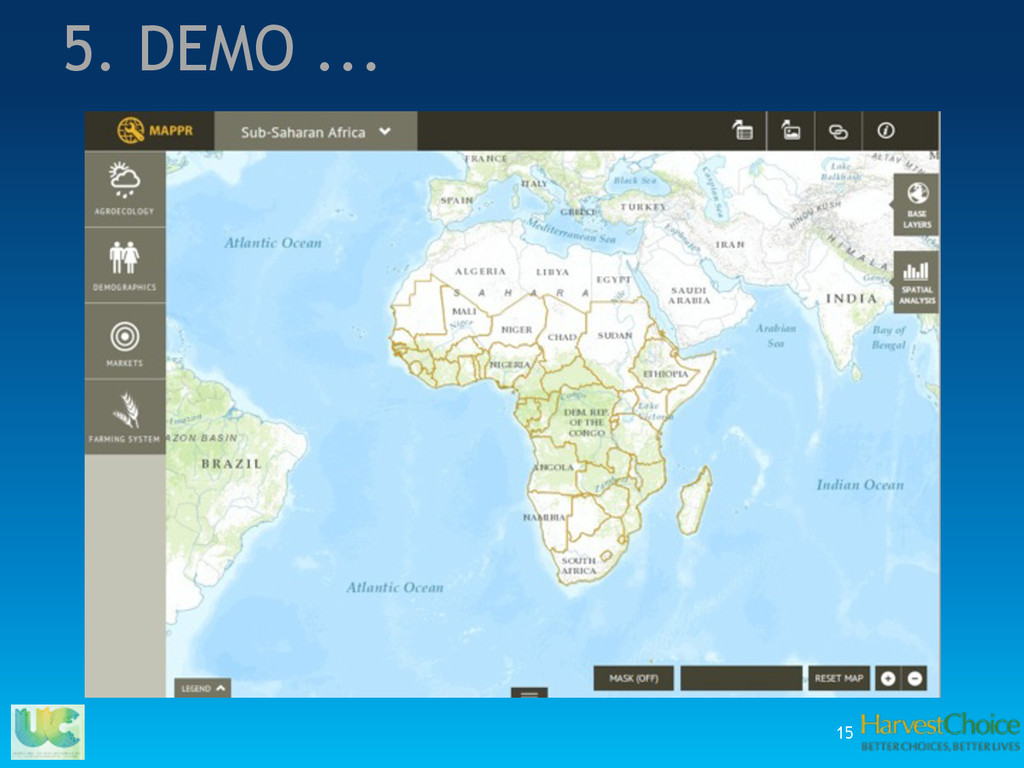
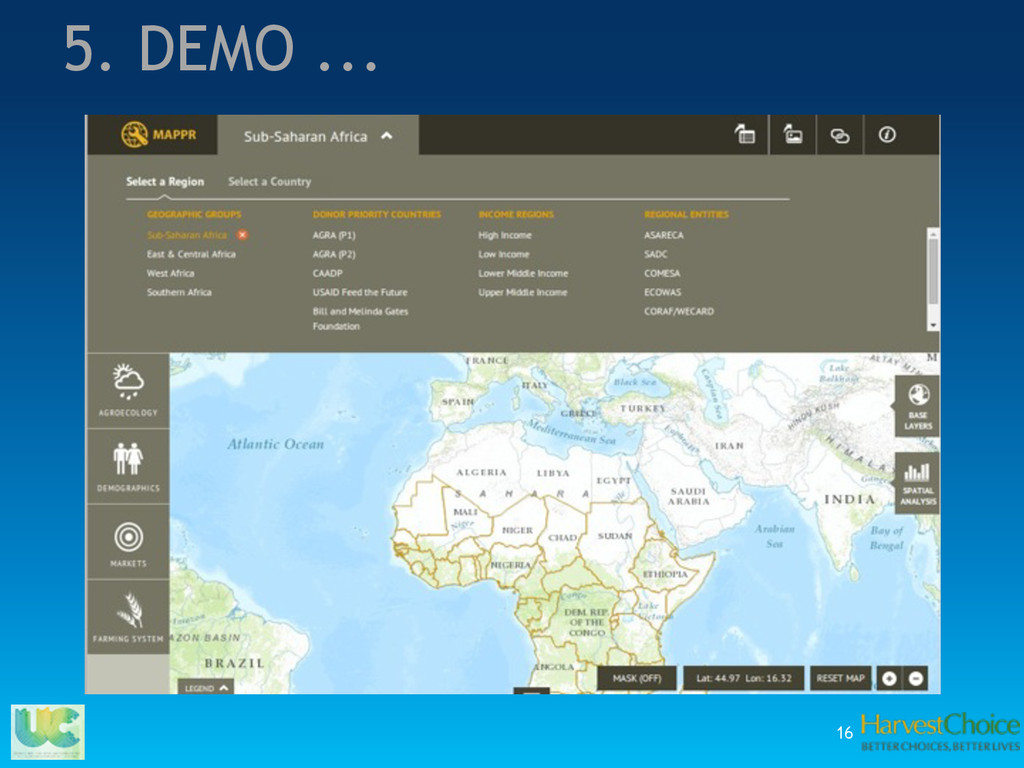
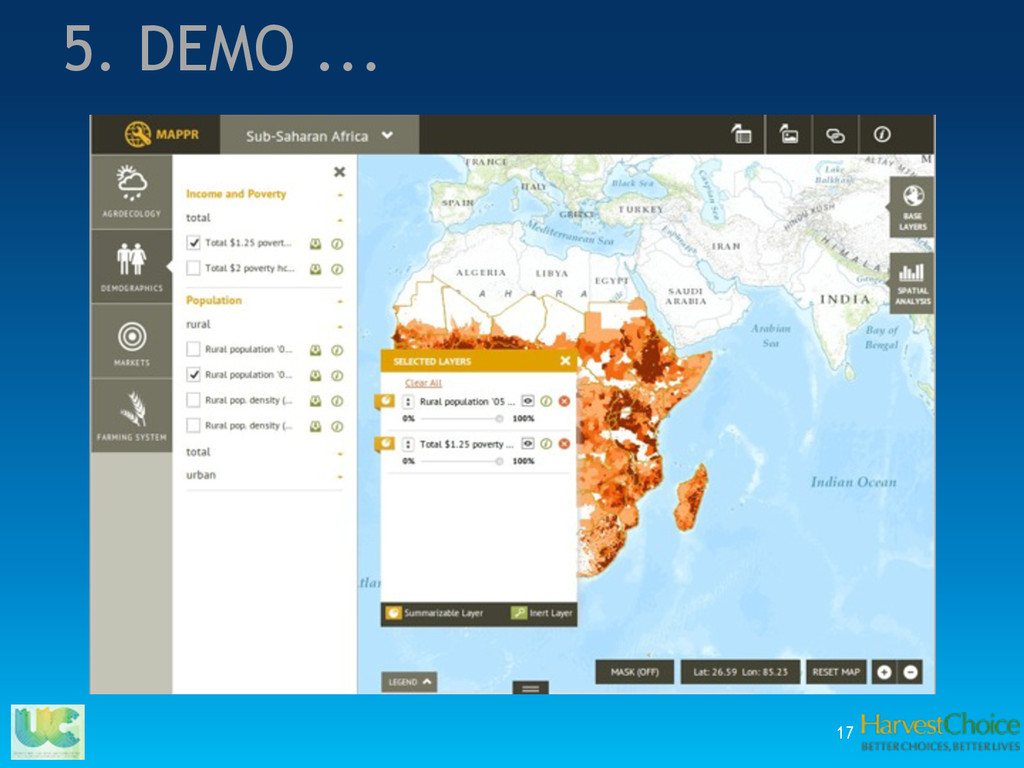
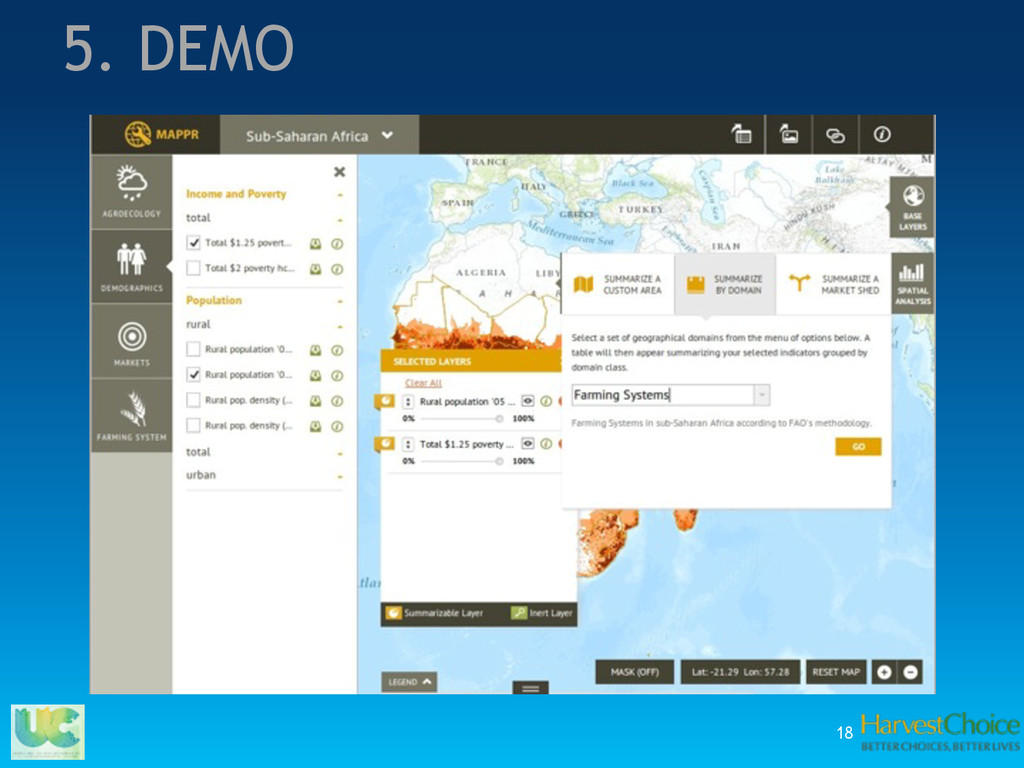
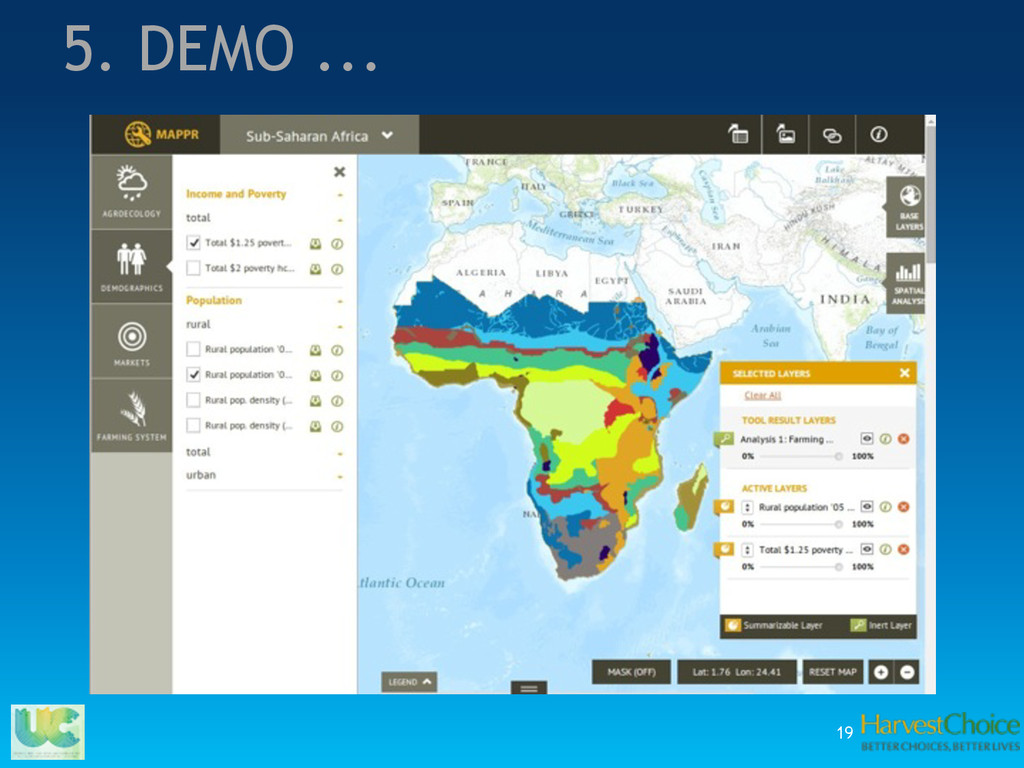
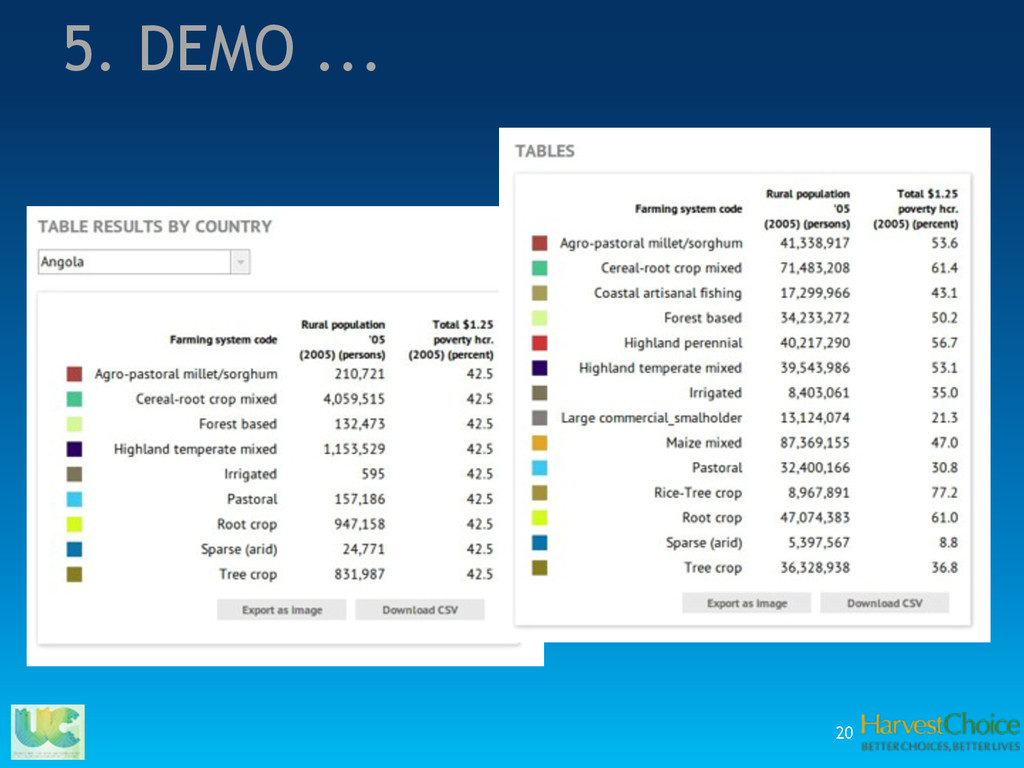
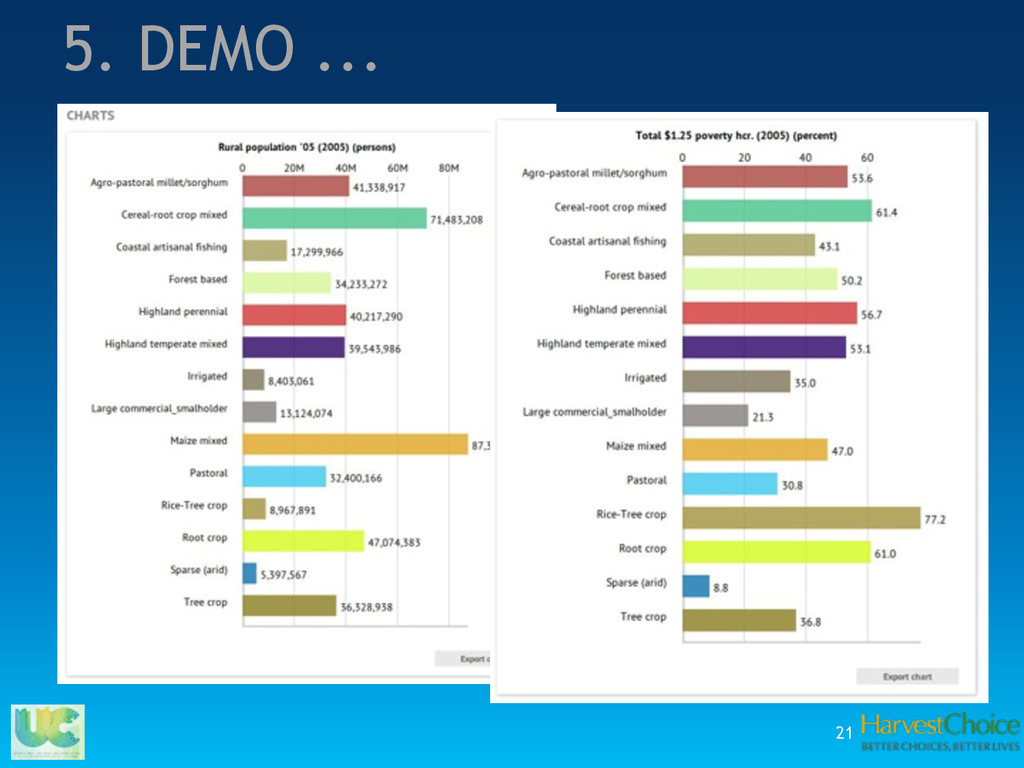
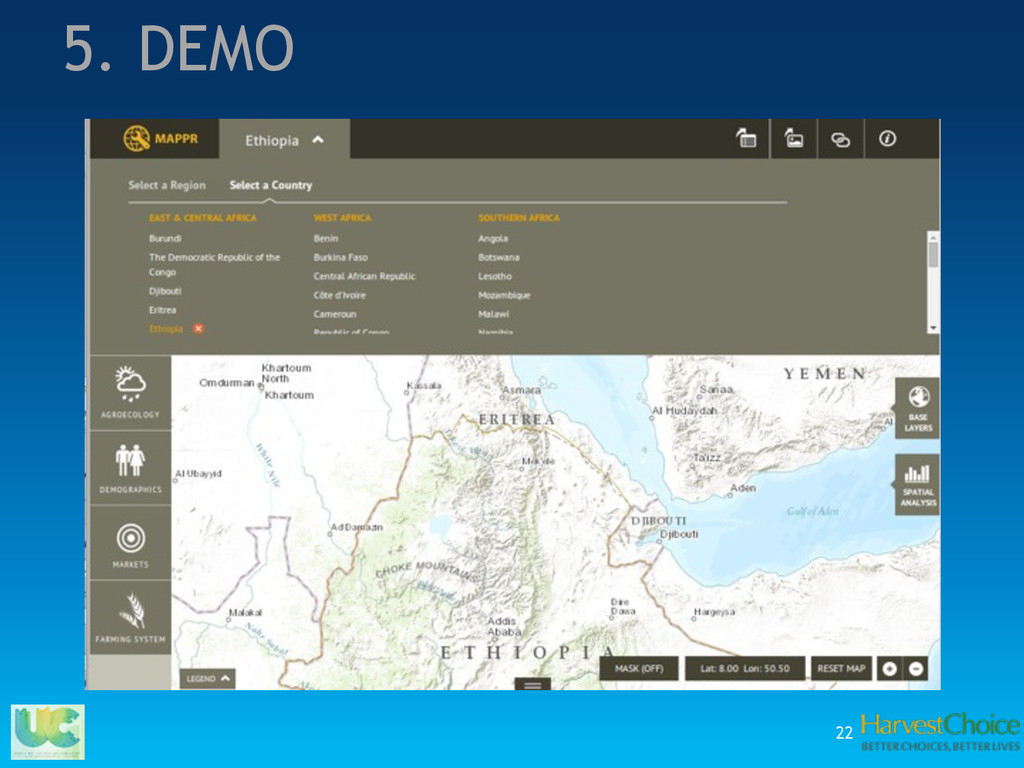
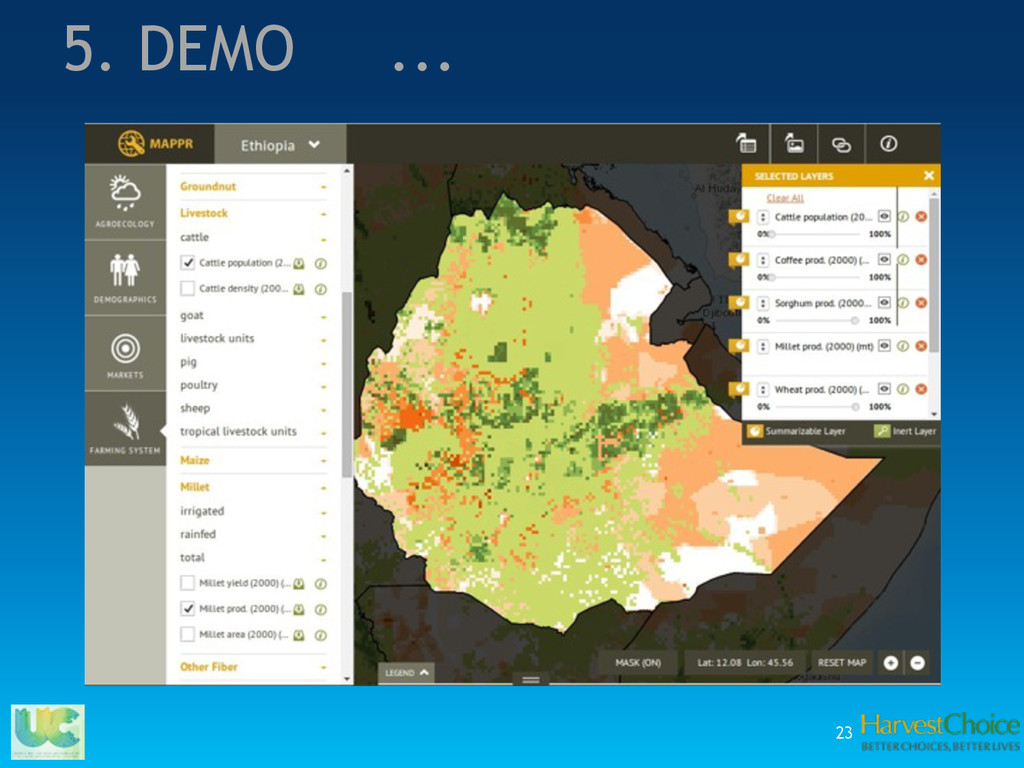
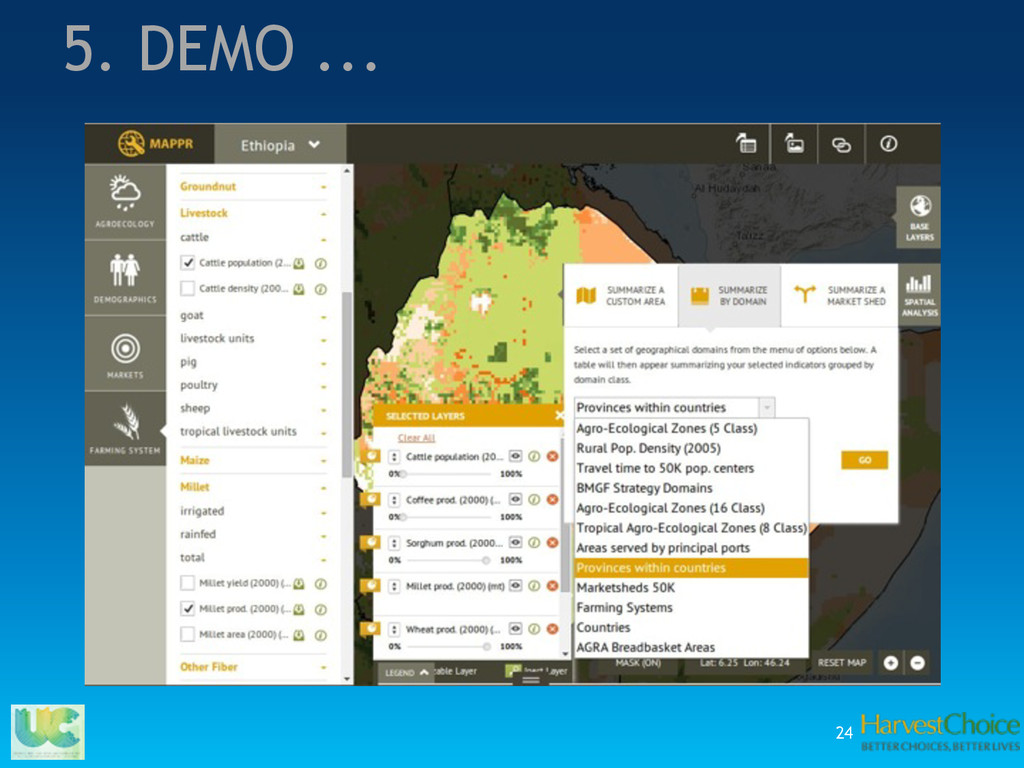
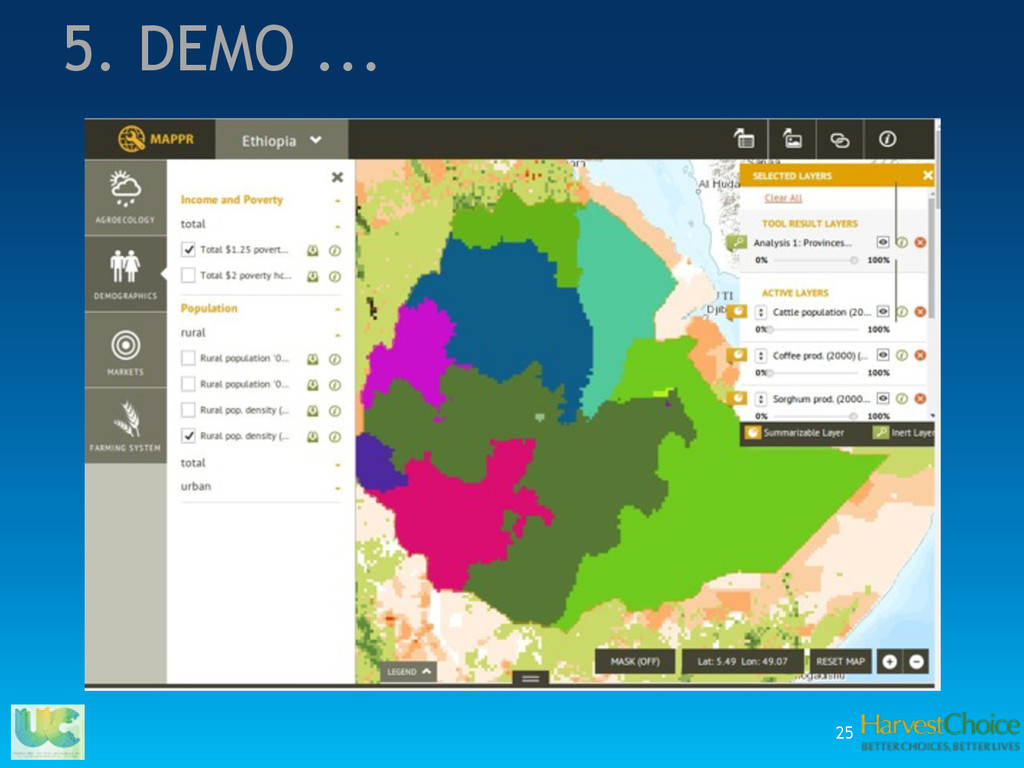
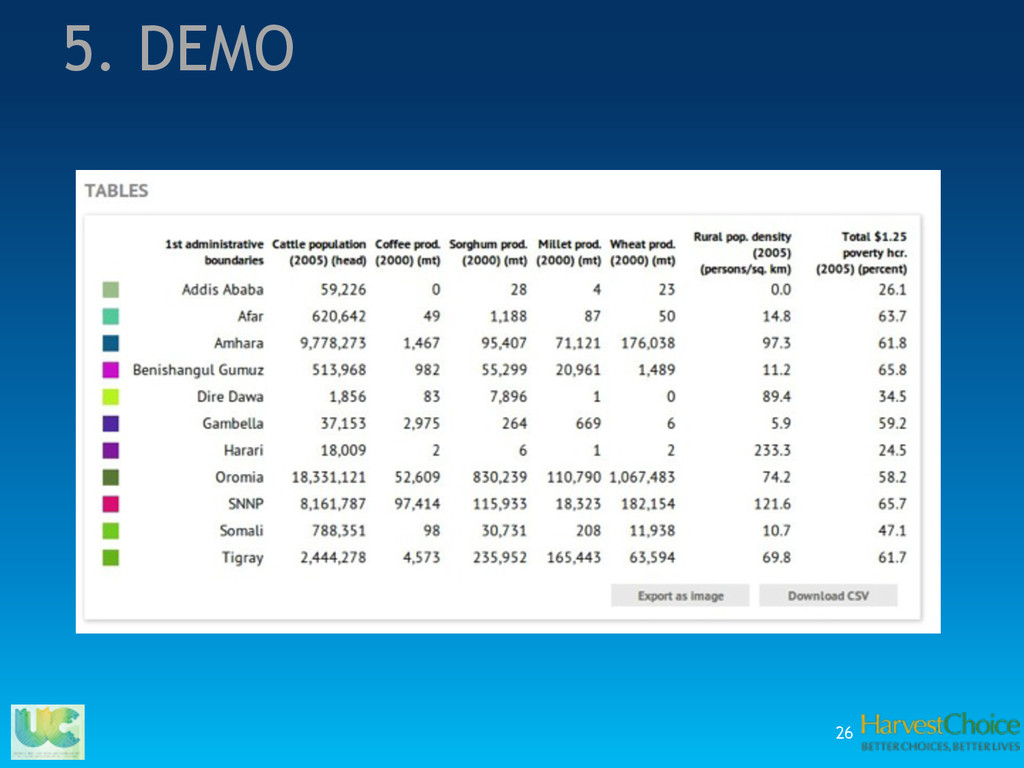
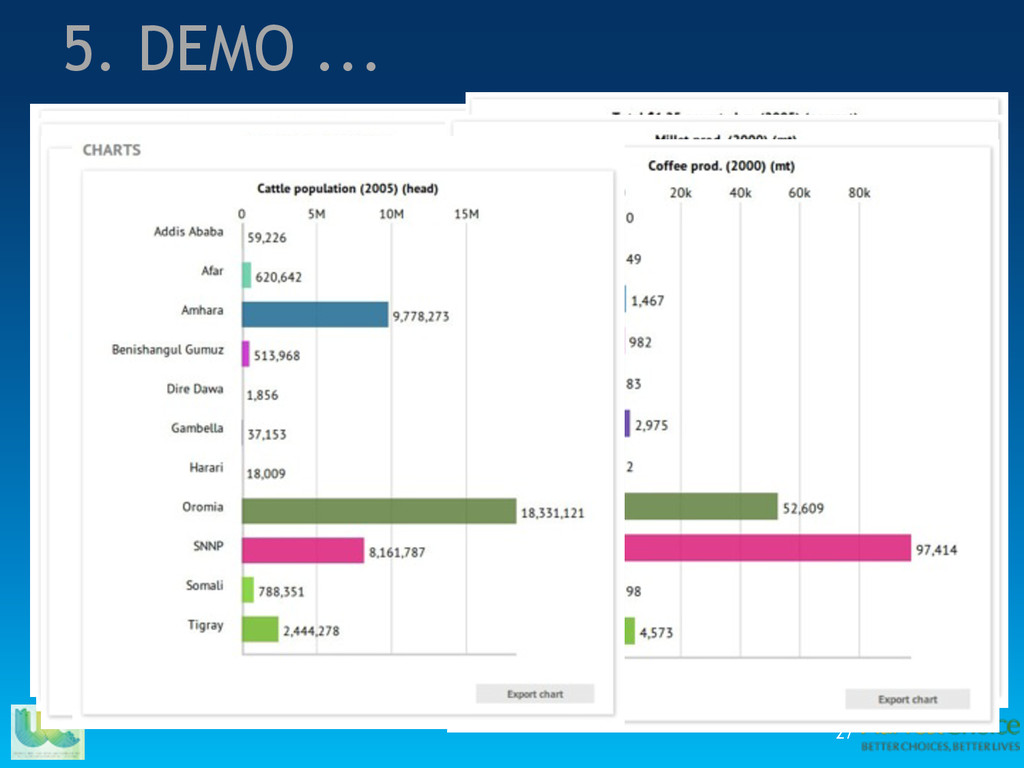
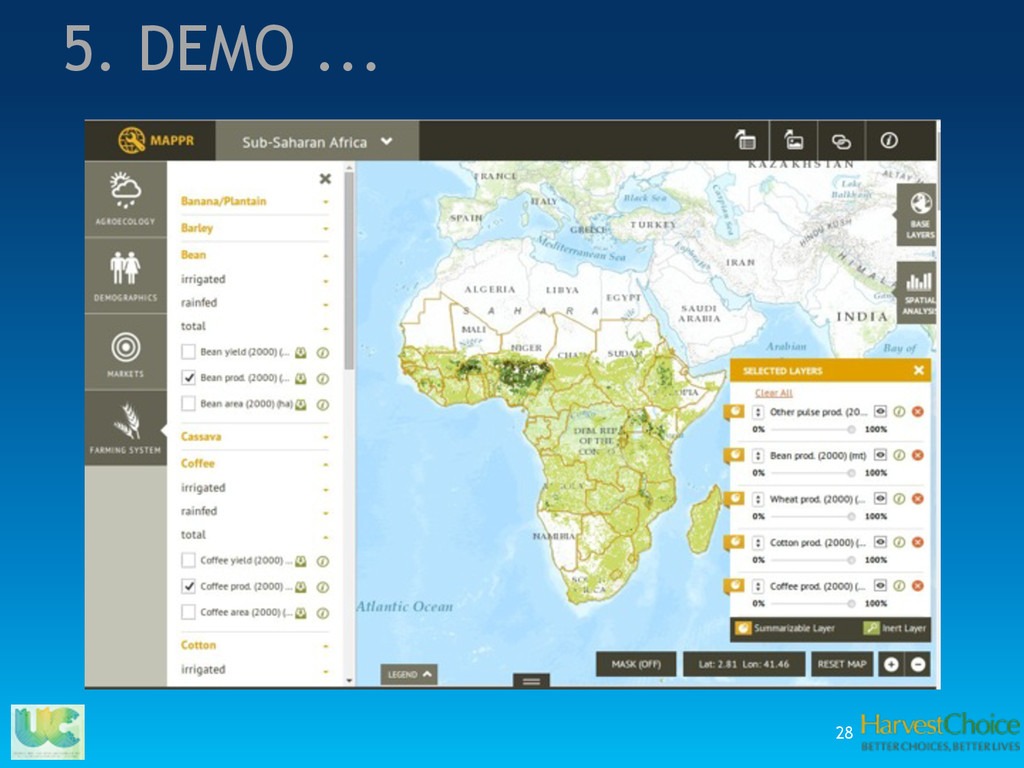
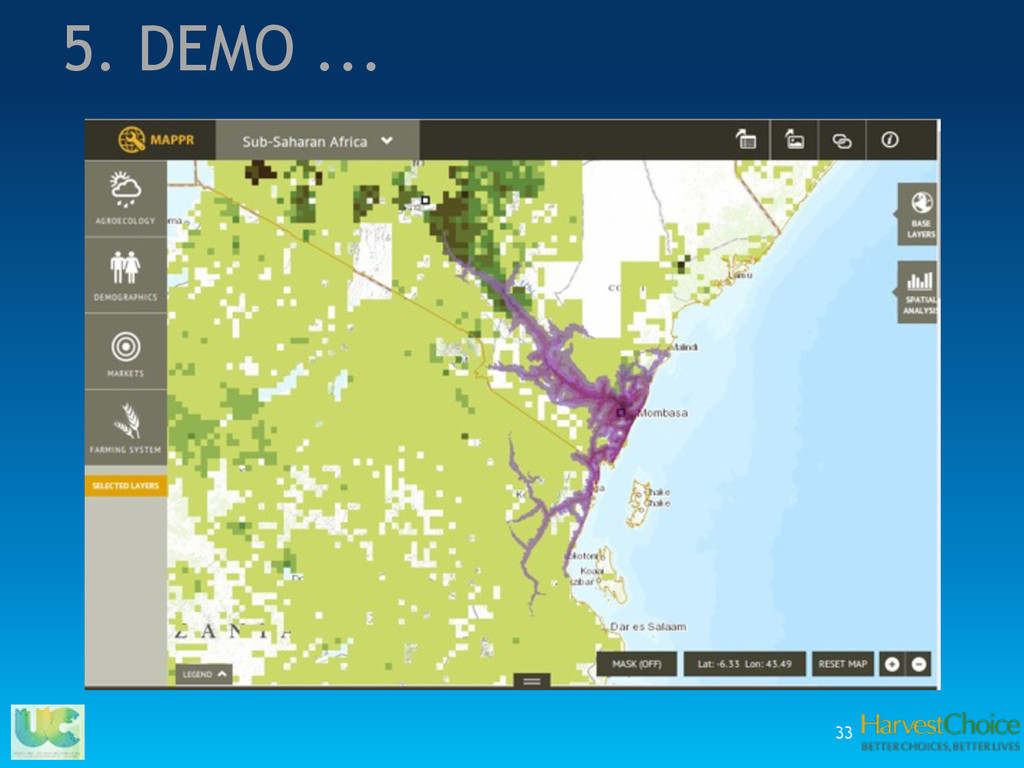
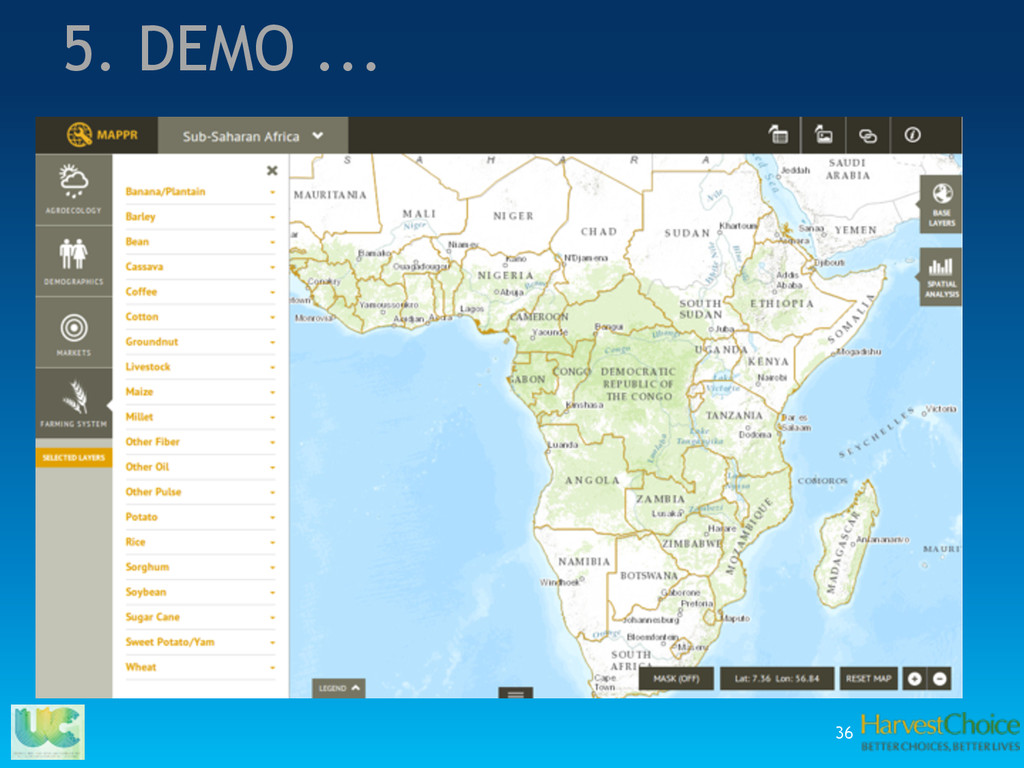
access to over 400 layers of spatially-explicit, agriculture-related indicators for sub-Saharan Africa. • each layer consists of about 300,000 10km x 10km (5 min) gridcells • layers grouped into: ✓ INDICATORS Agroecology – climate, elevation, landcover, soils Demographics – income/poverty, population Markets – travel time to markets and ports Farming System – area, production and yield of 20 crops and 3 technologies, livestock ✓ DOMAINS AEZ, Farming Systems, Admin Units, Markets and 3. What is MAPPR
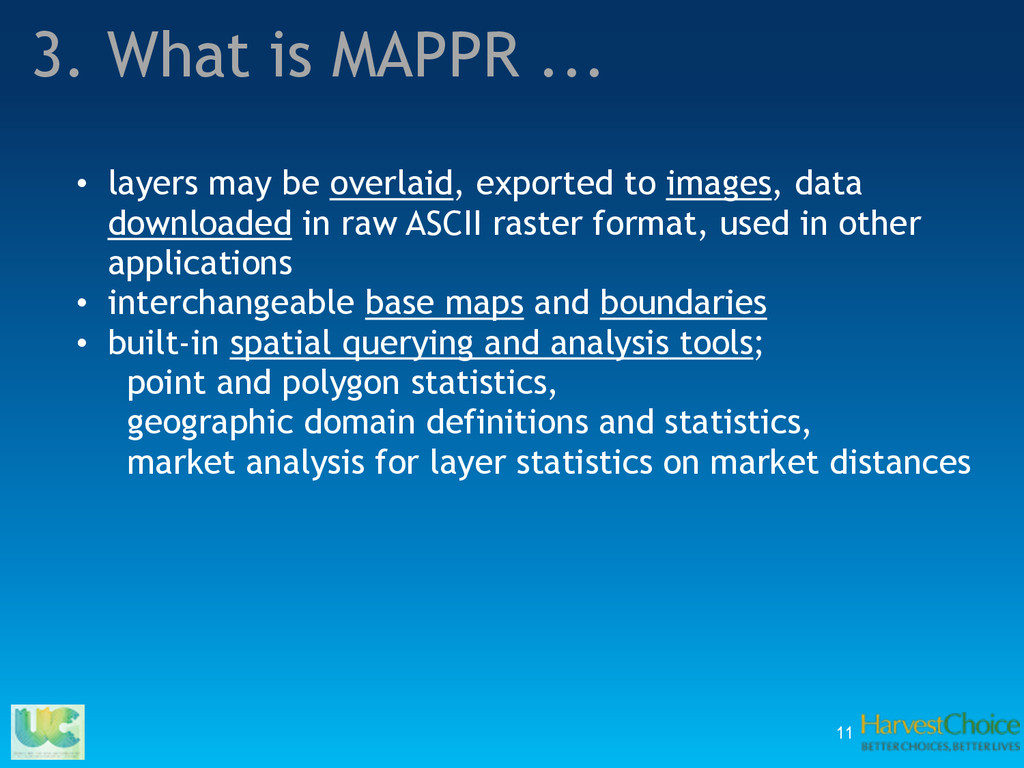
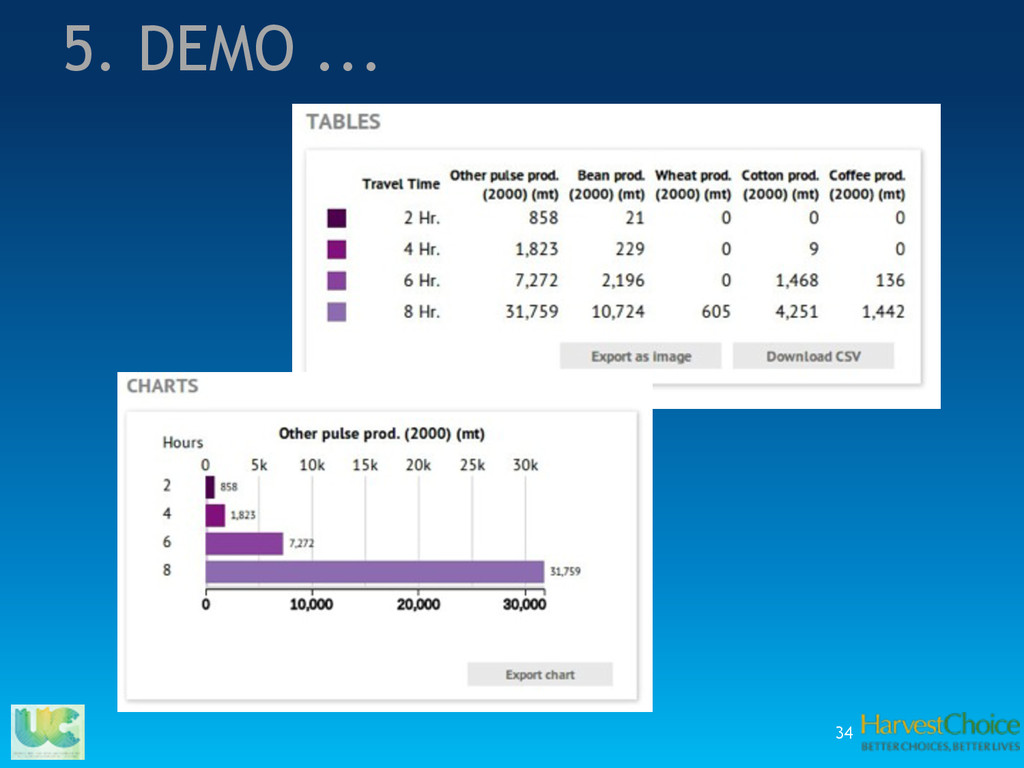
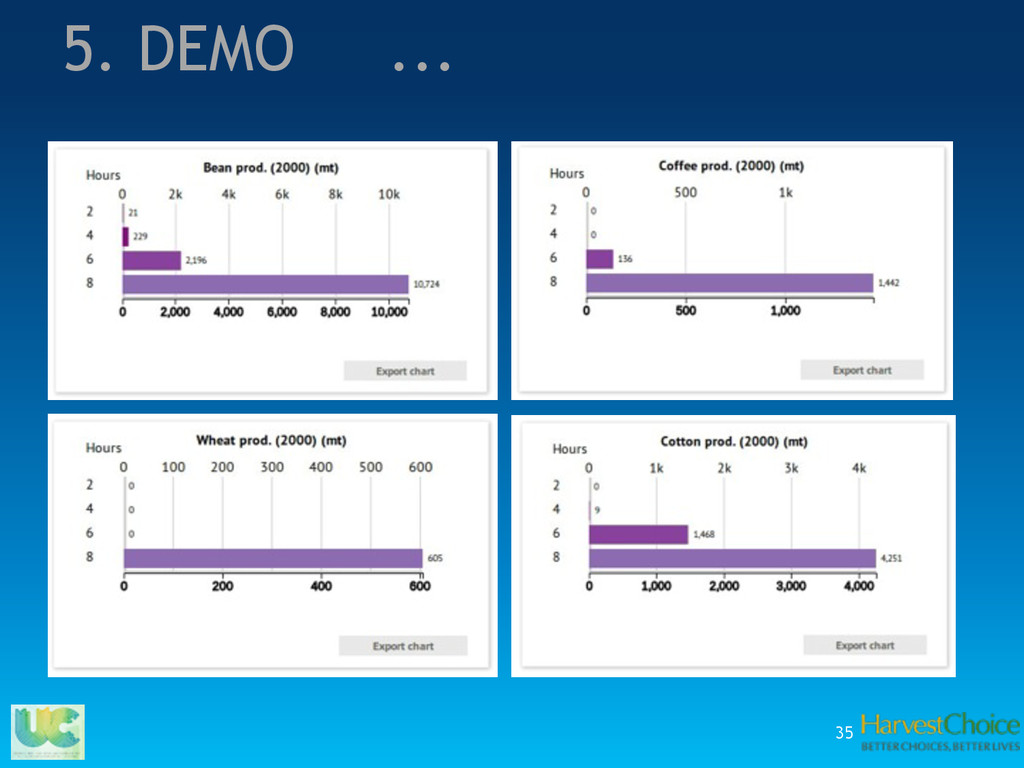
downloaded in raw ASCII raster format, used in other applications • interchangeable base maps and boundaries • built-in spatial querying and analysis tools; point and polygon statistics, geographic domain definitions and statistics, market analysis for layer statistics on market distances 3. What is MAPPR ...
![37 Contact us • Ulrike Wood – Sichra: [email protected] •](https://files.speakerdeck.com/presentations/492bd470f31e0131c21b4ebdb70fd364/slide_36.jpg)