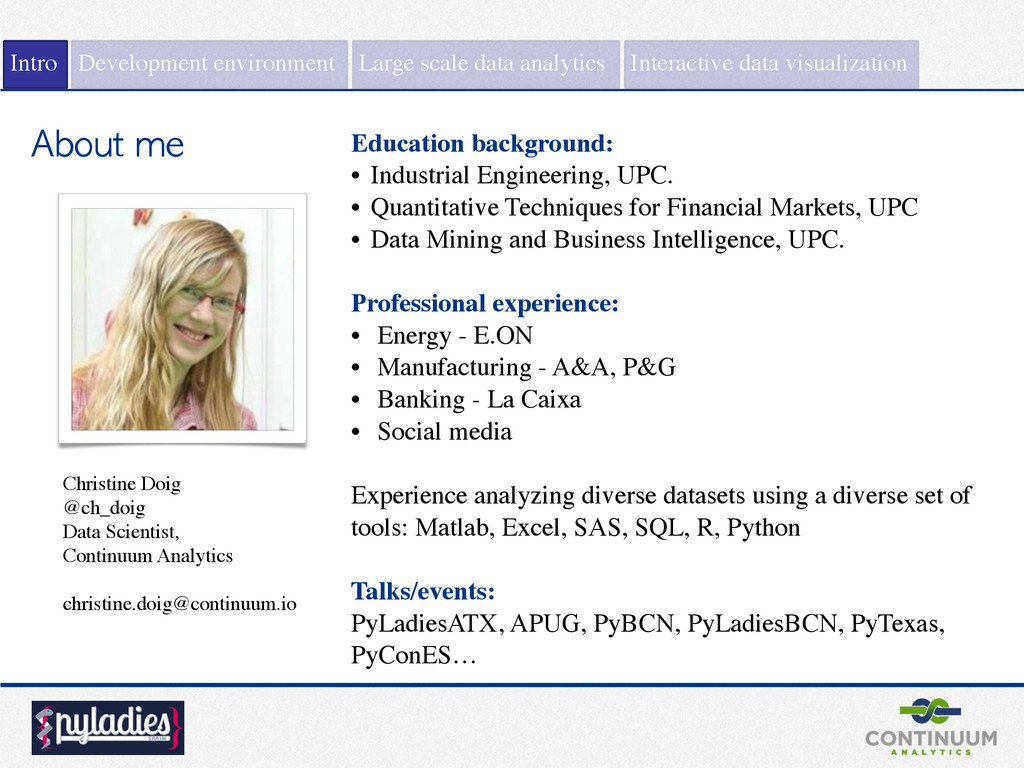
Christine Doig @ch_doig Data Scientist, Continuum Analytics ! [email protected] ! Education background: • Industrial Engineering, UPC. • Quantitative Techniques for Financial Markets, UPC • Data Mining and Business Intelligence, UPC. ! Professional experience: • Energy - E.ON • Manufacturing - A&A, P&G • Banking - La Caixa • Social media ! Experience analyzing diverse datasets using a diverse set of tools: Matlab, Excel, SAS, SQL, R, Python ! Talks/events: PyLadiesATX, APUG, PyBCN, PyLadiesBCN, PyTexas, PyConES… Development environment
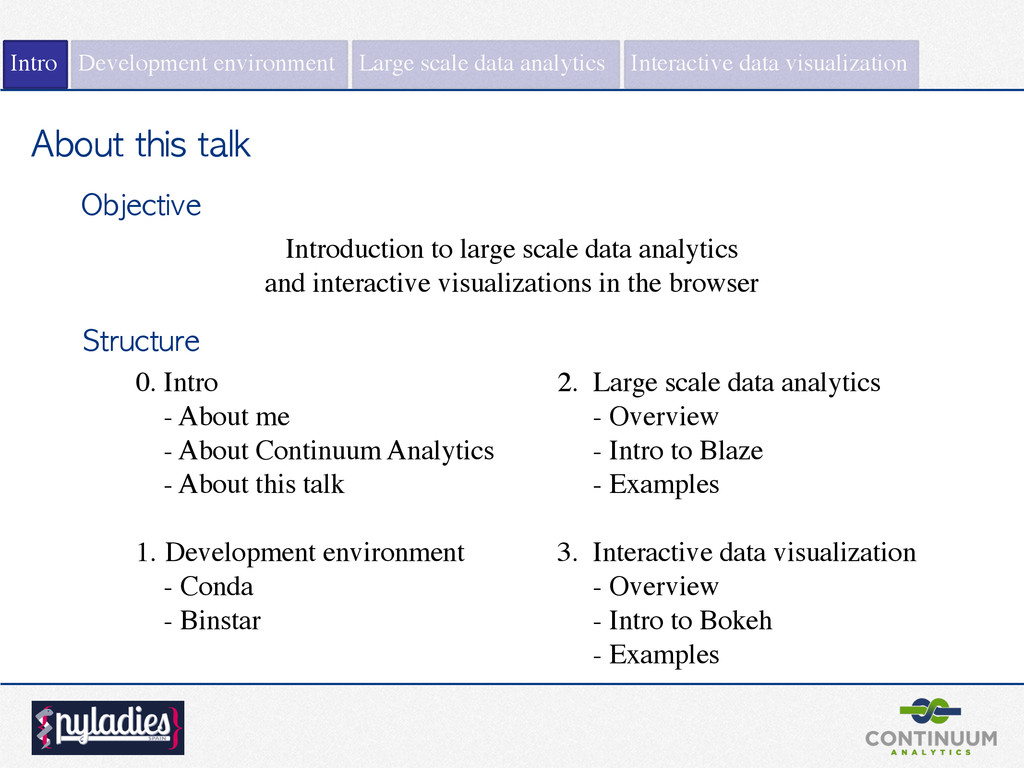
Continuum Analytics - About this talk ! 1. Development environment - Conda - Binstar Introduction to large scale data analytics and interactive visualizations in the browser Objective Structure 2. Large scale data analytics - Overview - Intro to Blaze - Examples ! 3. Interactive data visualization - Overview - Intro to Bokeh - Examples Intro Large scale data analytics Interactive data visualization Development environment
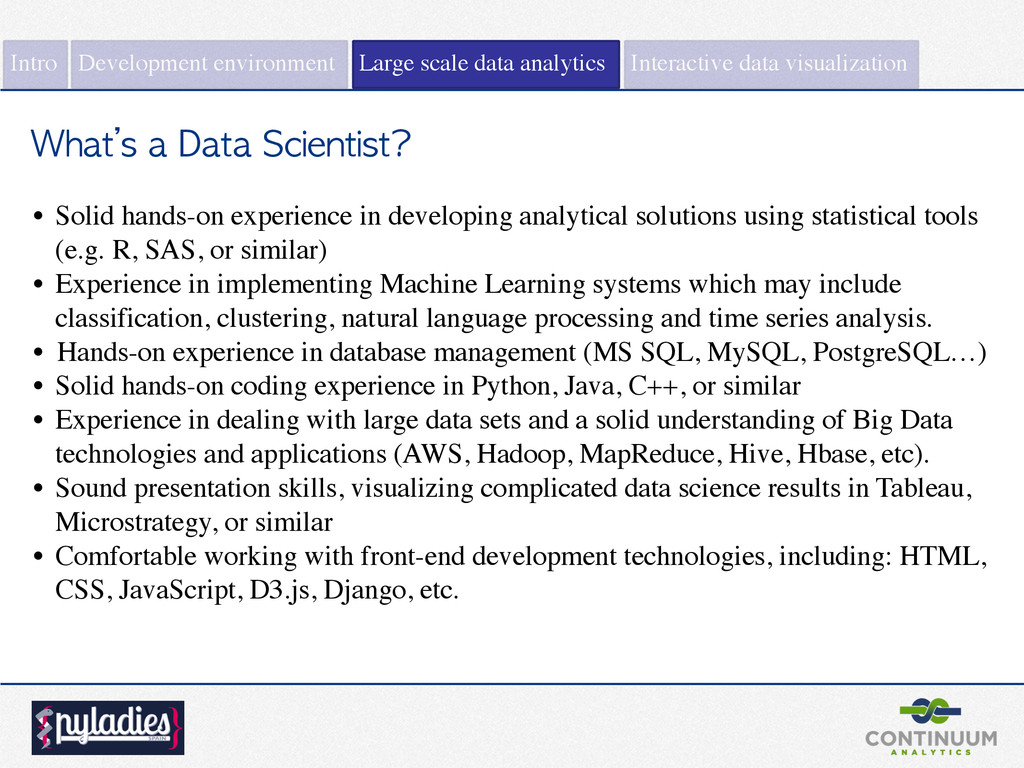
tools (e.g. R, SAS, or similar) • Experience in implementing Machine Learning systems which may include classification, clustering, natural language processing and time series analysis. • Hands-on experience in database management (MS SQL, MySQL, PostgreSQL…) • Solid hands-on coding experience in Python, Java, C++, or similar • Experience in dealing with large data sets and a solid understanding of Big Data technologies and applications (AWS, Hadoop, MapReduce, Hive, Hbase, etc). • Sound presentation skills, visualizing complicated data science results in Tableau, Microstrategy, or similar • Comfortable working with front-end development technologies, including: HTML, CSS, JavaScript, D3.js, Django, etc. What’s a Data Scientist? Intro Large scale data analytics Interactive data visualization Development environment
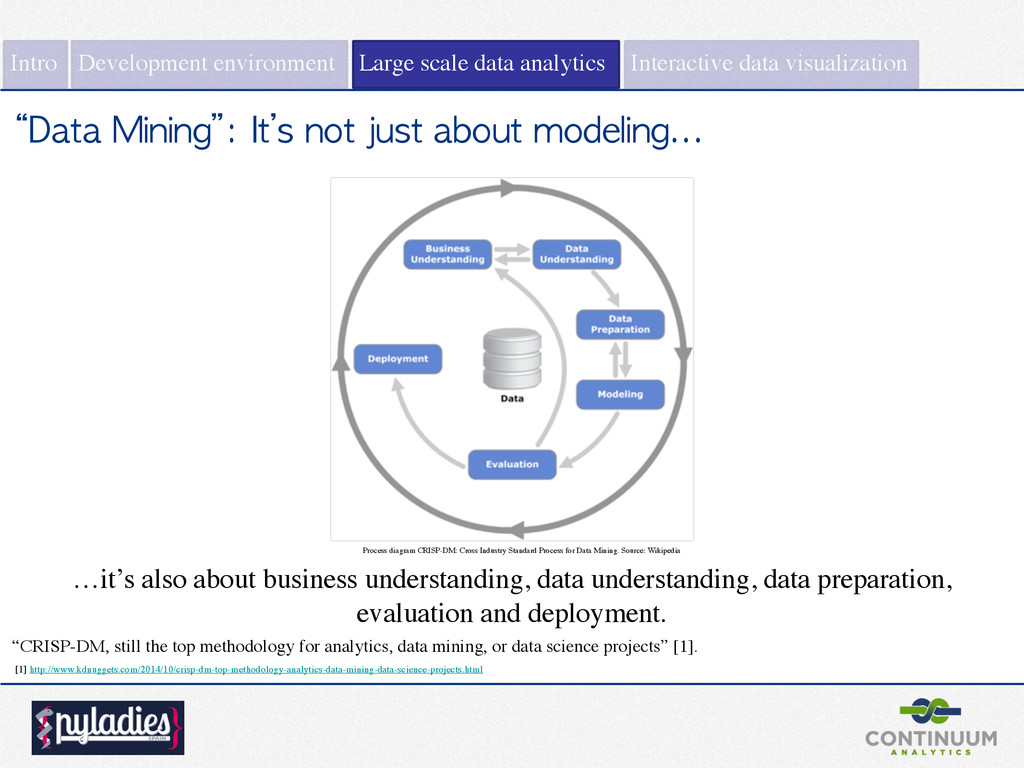
Source: Wikipedia [1] http://www.kdnuggets.com/2014/10/crisp-dm-top-methodology-analytics-data-mining-data-science-projects.html “Data Mining”: It’s not just about modeling... “CRISP-DM, still the top methodology for analytics, data mining, or data science projects” [1]. …it’s also about business understanding, data understanding, data preparation, evaluation and deployment. Intro Large scale data analytics Interactive data visualization Development environment
useful insights out of data. Free enterprise-ready Python distribution Intro Large scale data analytics Interactive data visualization Development environment
useful insights out of data. Free enterprise-ready Python distribution Anaconda Intro Large scale data analytics Interactive data visualization Development environment
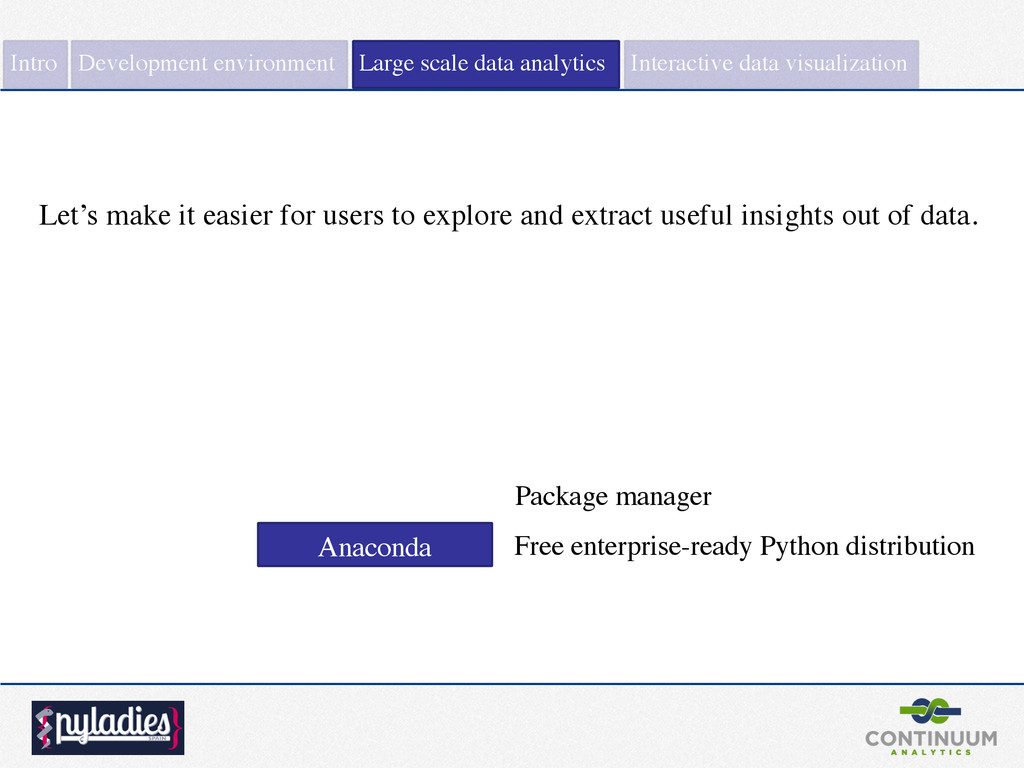
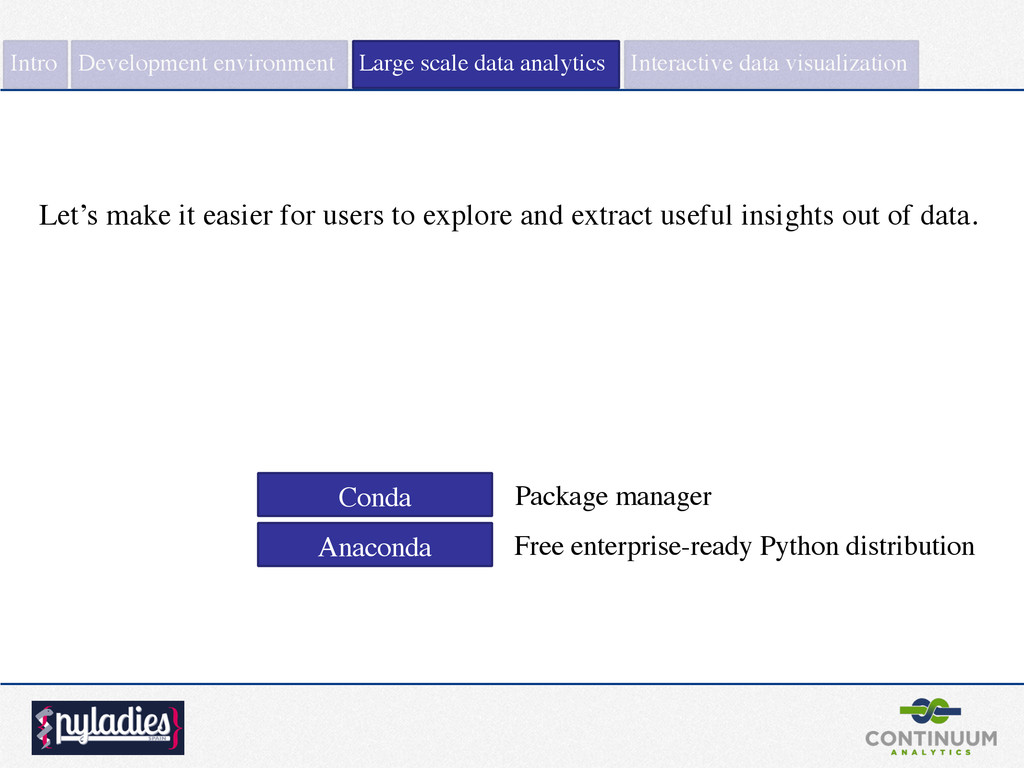
useful insights out of data. Package manager Free enterprise-ready Python distribution Anaconda Intro Large scale data analytics Interactive data visualization Development environment
useful insights out of data. Package manager Free enterprise-ready Python distribution Anaconda Conda Intro Large scale data analytics Interactive data visualization Development environment
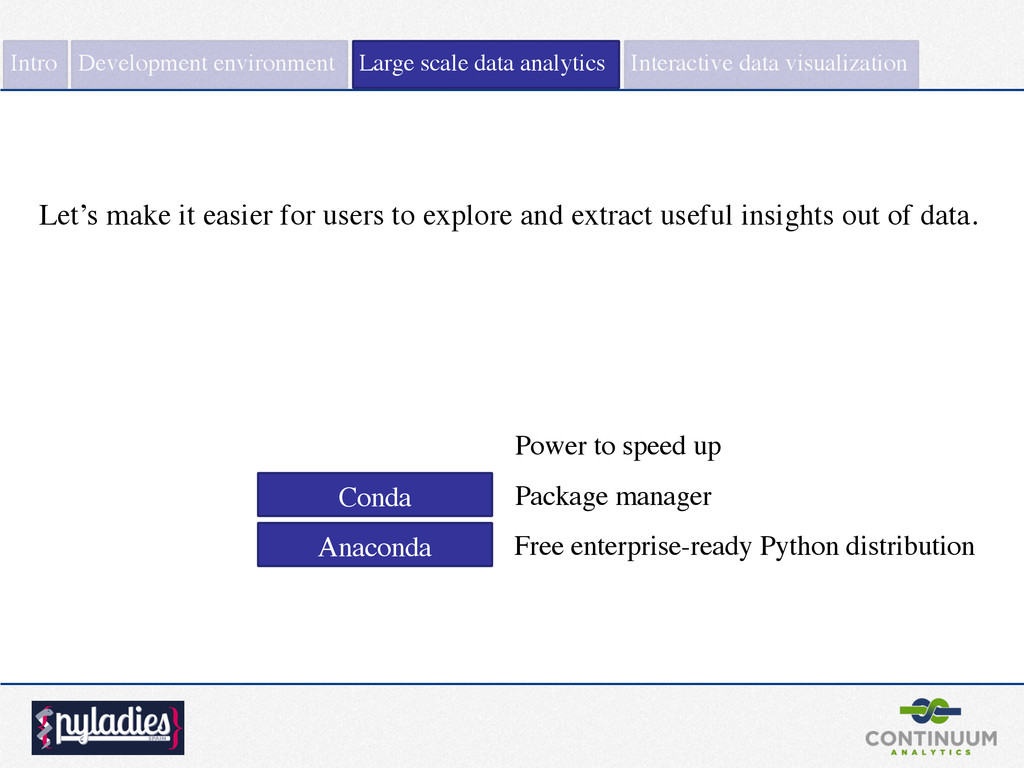
useful insights out of data. Package manager Free enterprise-ready Python distribution Anaconda Conda Power to speed up Intro Large scale data analytics Interactive data visualization Development environment
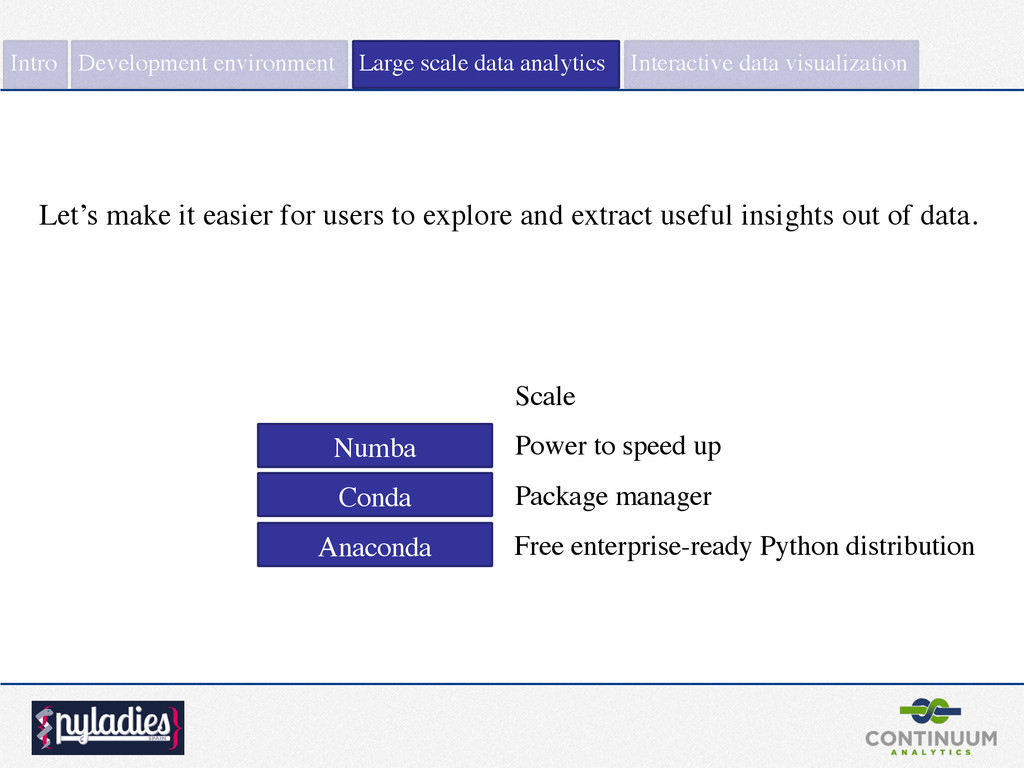
useful insights out of data. Package manager Free enterprise-ready Python distribution Anaconda Conda Numba Power to speed up Intro Large scale data analytics Interactive data visualization Development environment
useful insights out of data. Package manager Free enterprise-ready Python distribution Anaconda Conda Numba Power to speed up Scale Intro Large scale data analytics Interactive data visualization Development environment
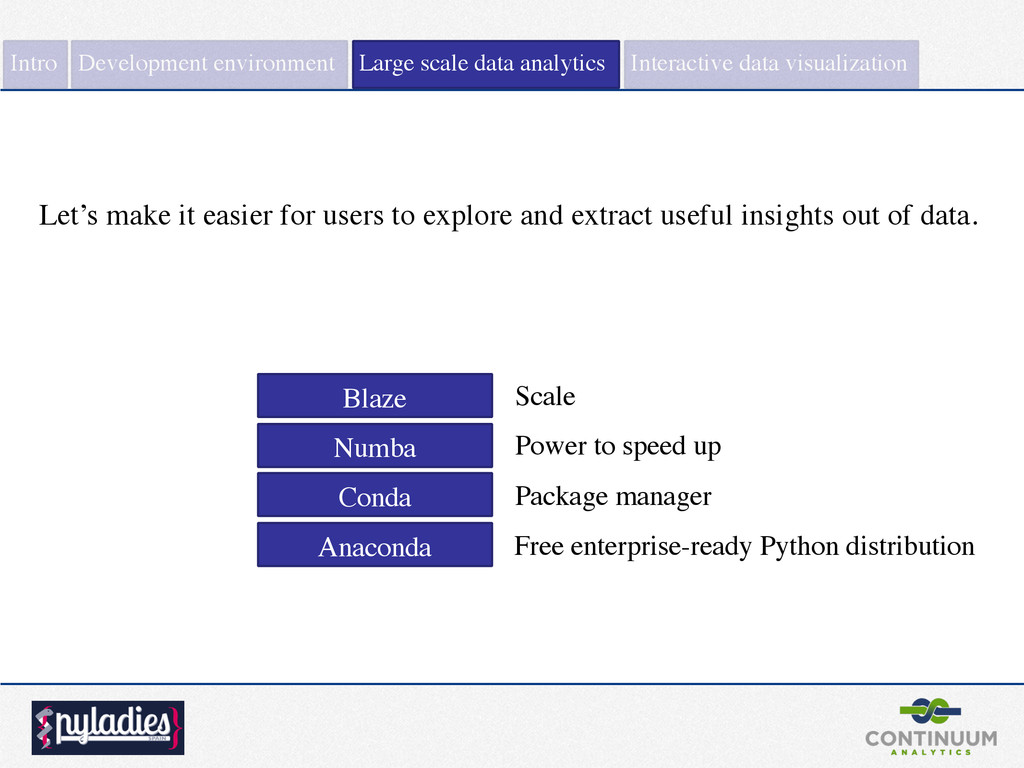
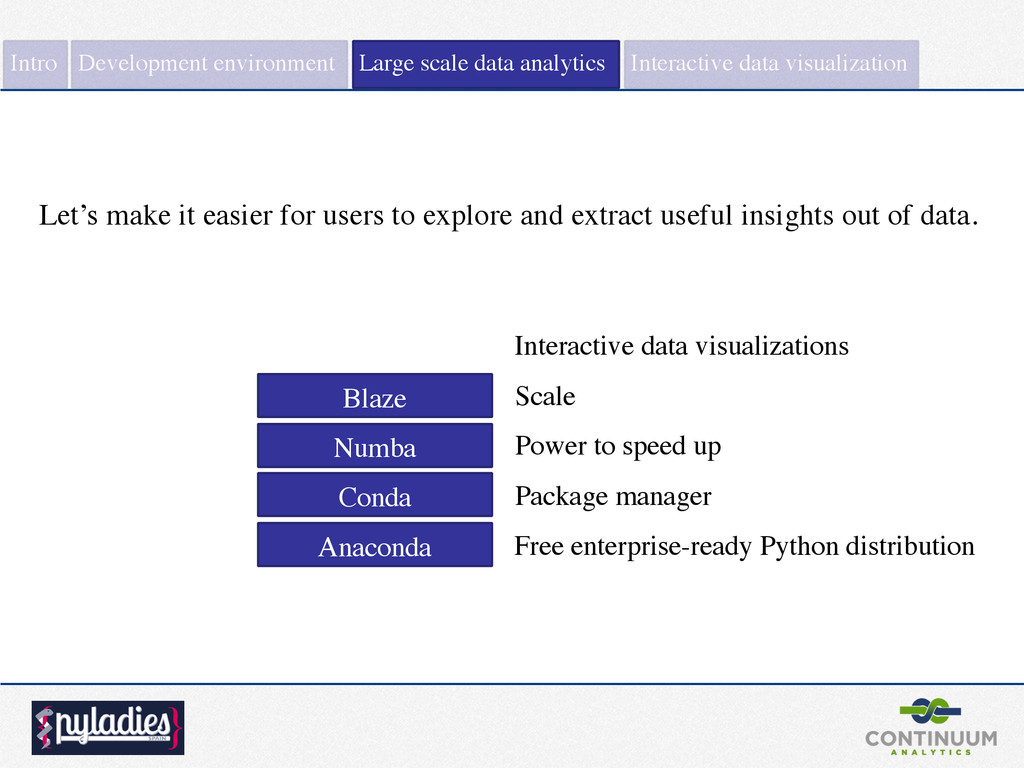
useful insights out of data. Package manager Free enterprise-ready Python distribution Anaconda Conda Blaze Numba Power to speed up Scale Intro Large scale data analytics Interactive data visualization Development environment
useful insights out of data. Package manager Free enterprise-ready Python distribution Anaconda Conda Blaze Numba Power to speed up Interactive data visualizations Scale Intro Large scale data analytics Interactive data visualization Development environment
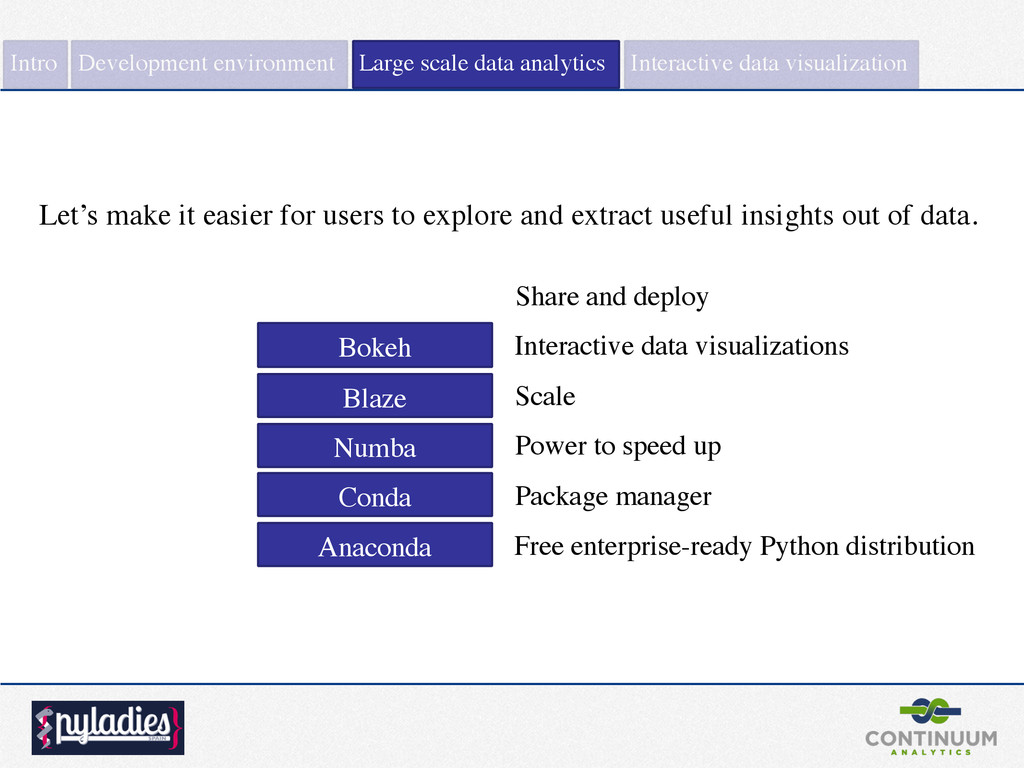
useful insights out of data. Package manager Free enterprise-ready Python distribution Anaconda Conda Blaze Bokeh Numba Power to speed up Interactive data visualizations Scale Intro Large scale data analytics Interactive data visualization Development environment
useful insights out of data. Package manager Free enterprise-ready Python distribution Anaconda Conda Blaze Bokeh Numba Power to speed up Share and deploy Interactive data visualizations Scale Intro Large scale data analytics Interactive data visualization Development environment
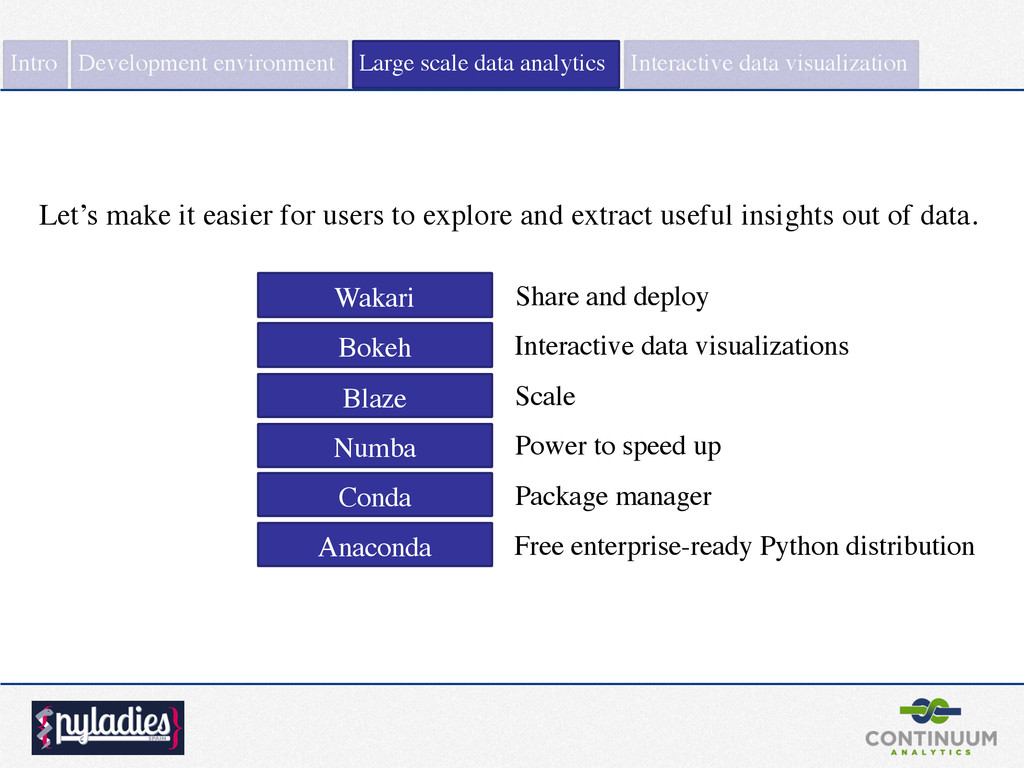
useful insights out of data. Package manager Free enterprise-ready Python distribution Anaconda Conda Blaze Bokeh Numba Wakari Power to speed up Share and deploy Interactive data visualizations Scale Intro Large scale data analytics Interactive data visualization Development environment
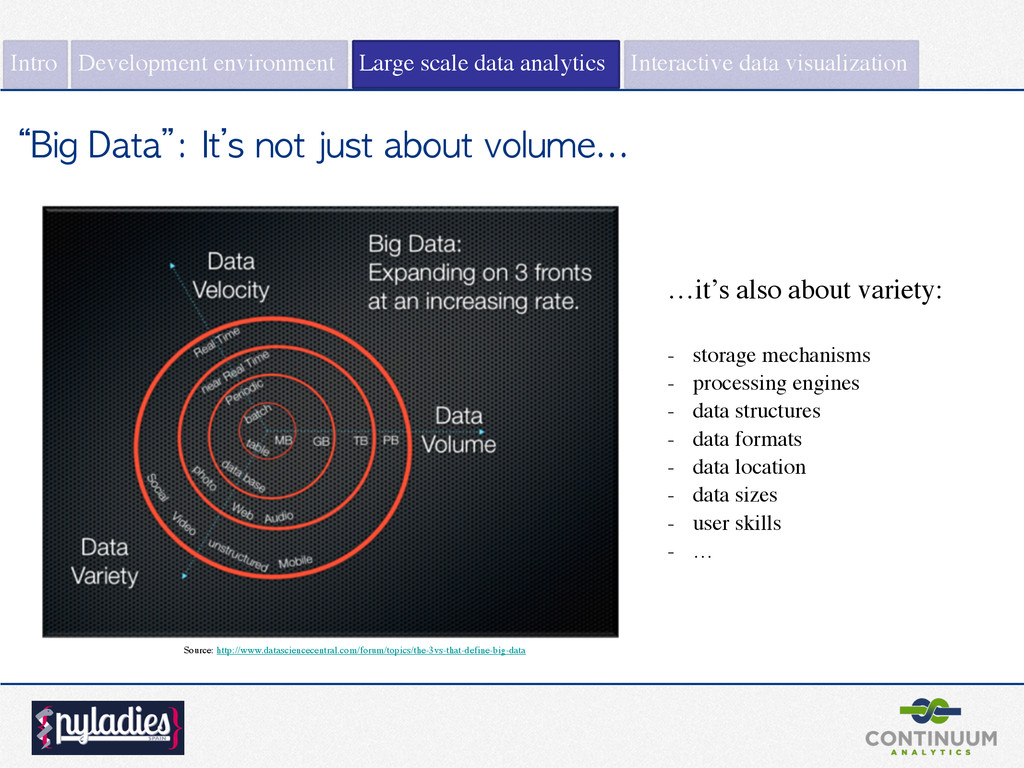
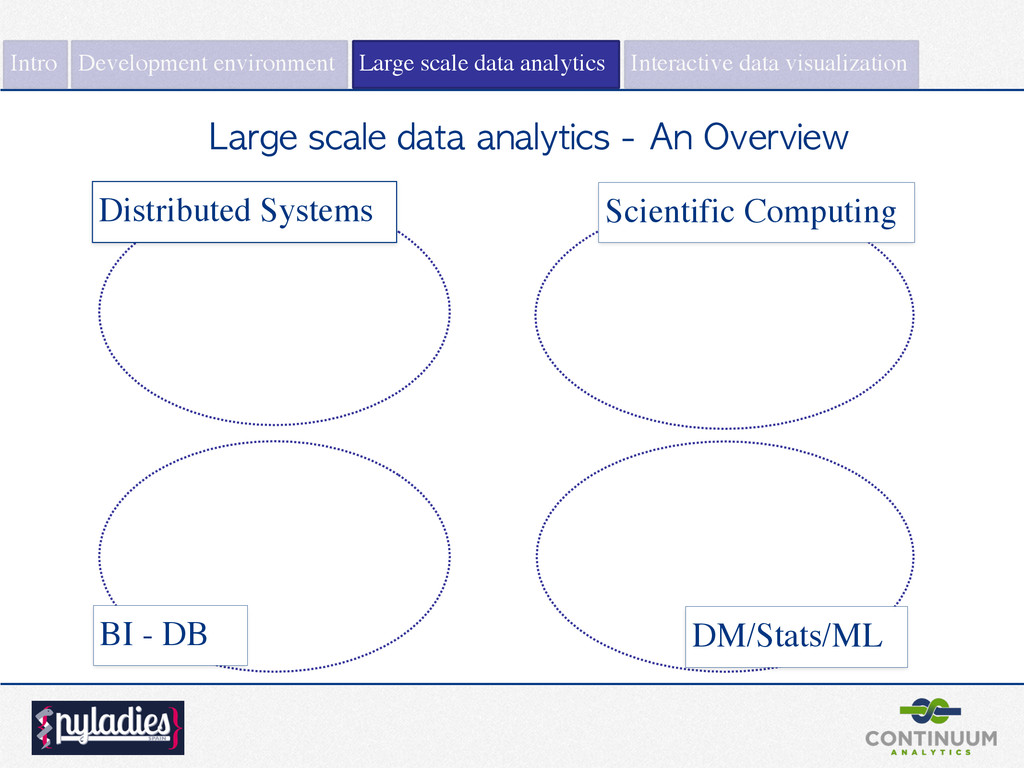
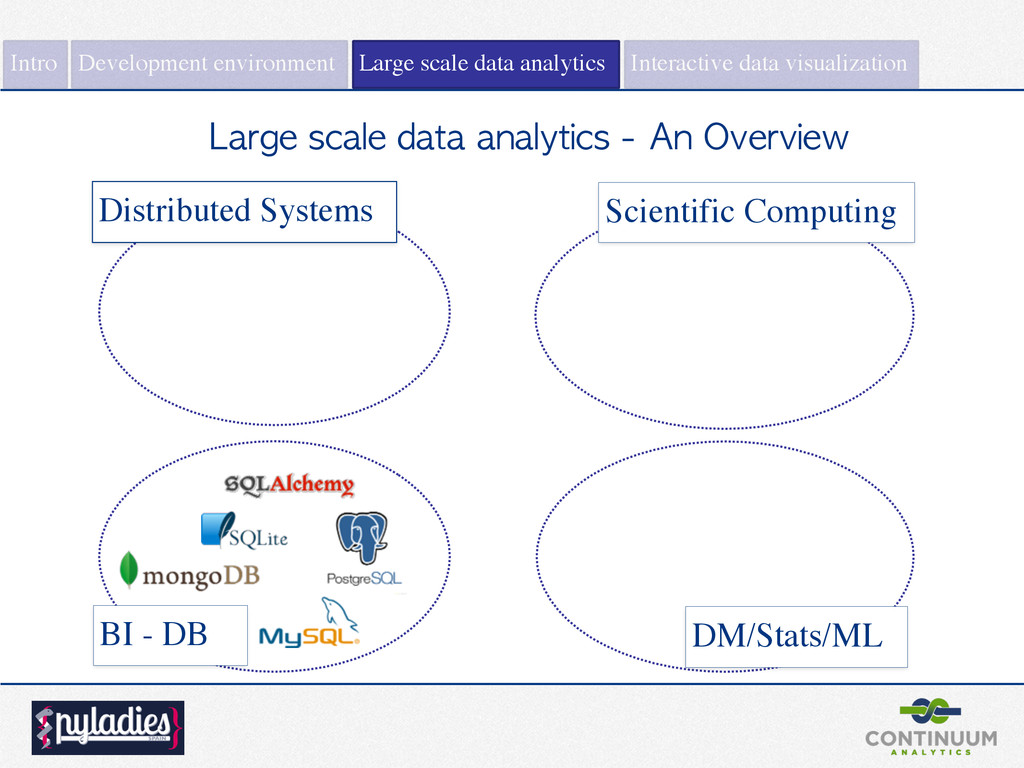
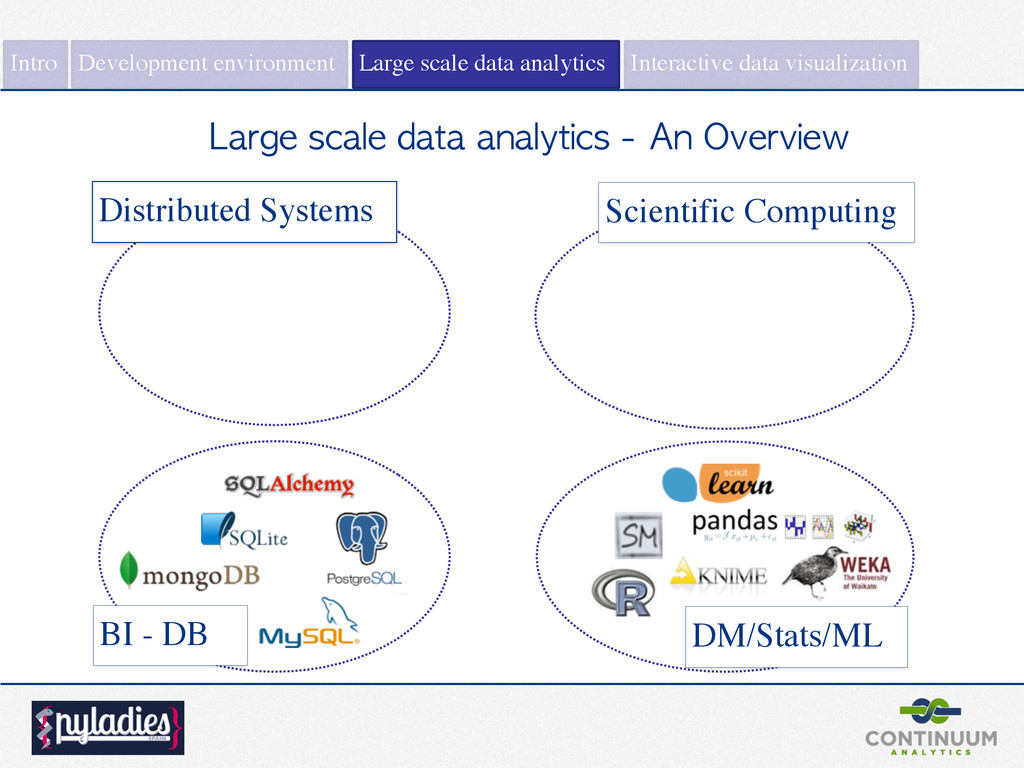
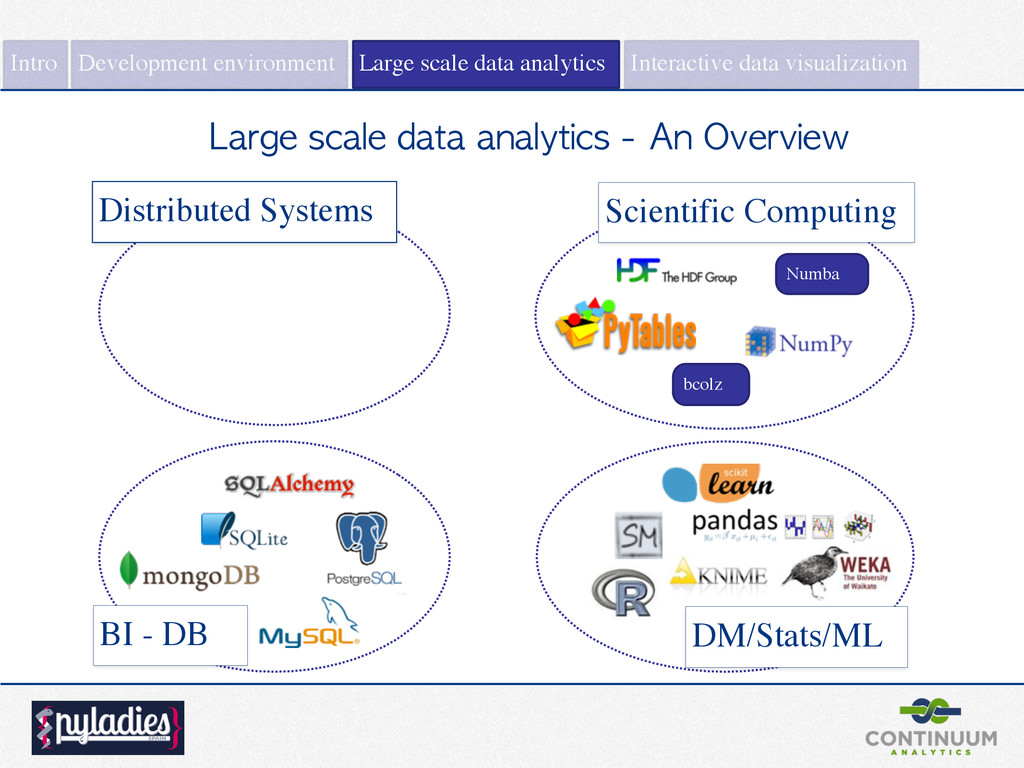
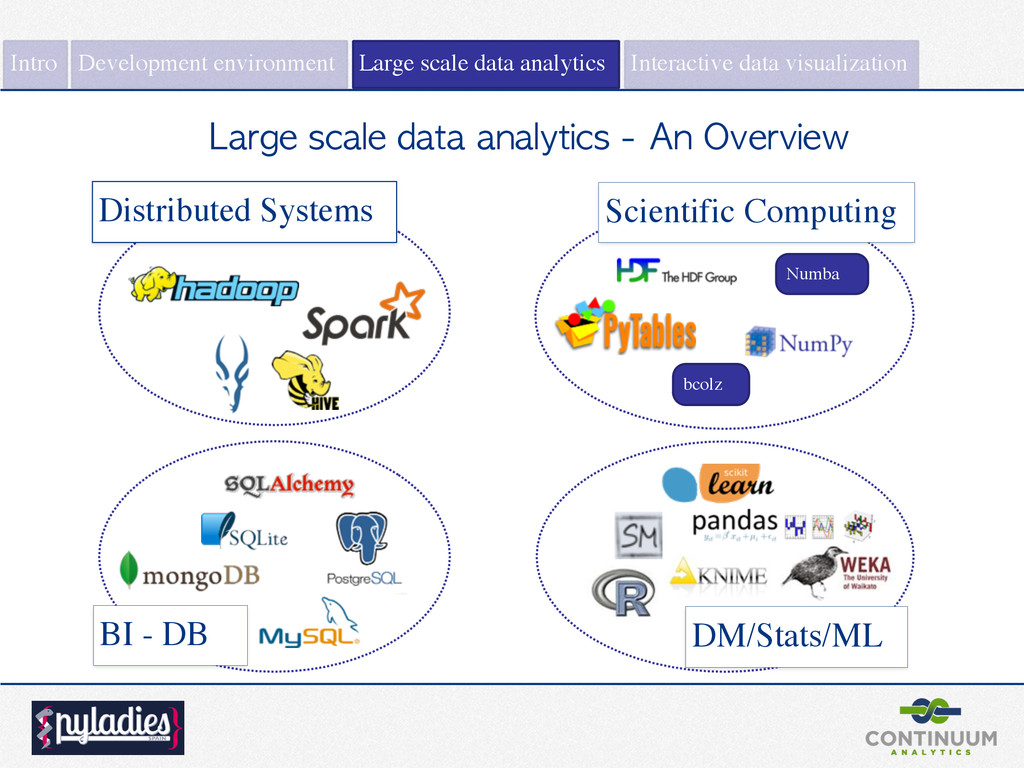
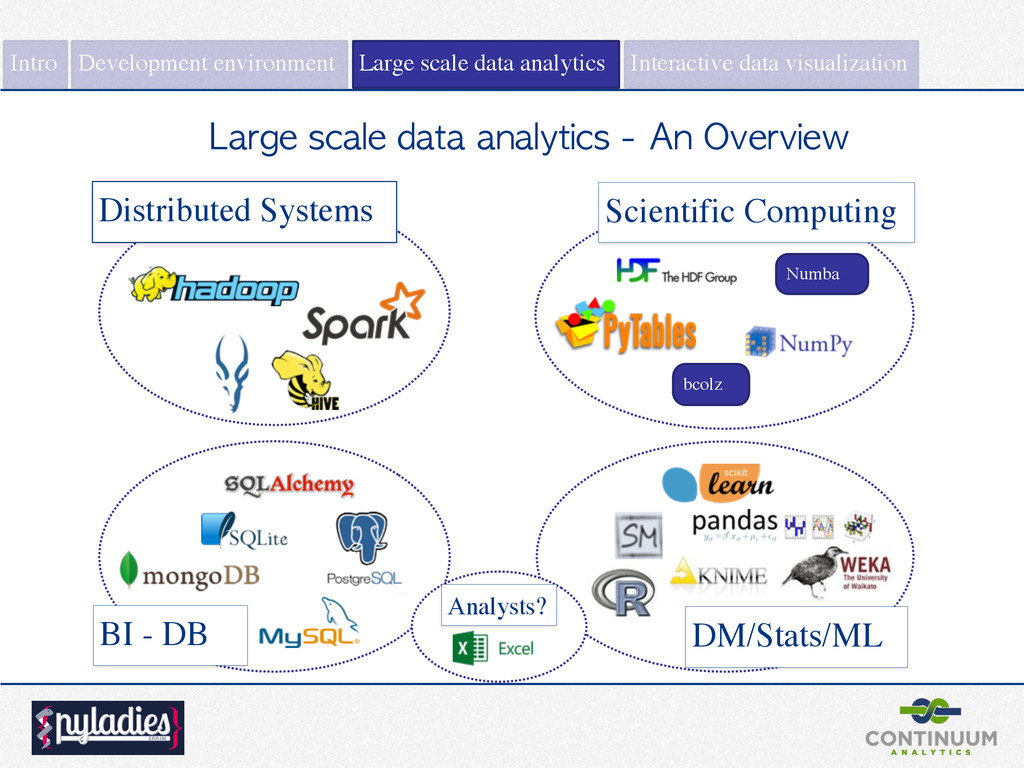
also about variety: ! - storage mechanisms - processing engines - data structures - data formats - data location - data sizes - user skills - … Intro Large scale data analytics Interactive data visualization Development environment
DM/Stats/ML Scientific Computing Distributed Systems Numba bcolz Intro Large scale data analytics Interactive data visualization Development environment
DM/Stats/ML Scientific Computing Distributed Systems Numba bcolz Intro Large scale data analytics Interactive data visualization Development environment
DM/Stats/ML Scientific Computing Distributed Systems Numba bcolz Intro Large scale data analytics Interactive data visualization Development environment Analysts?
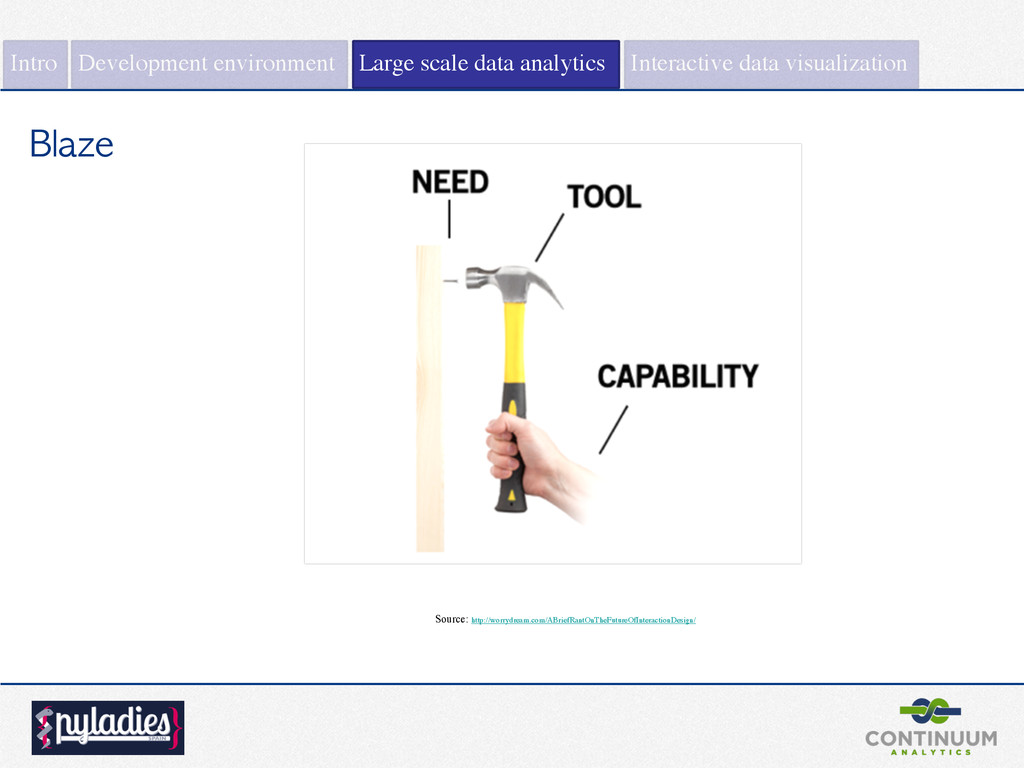
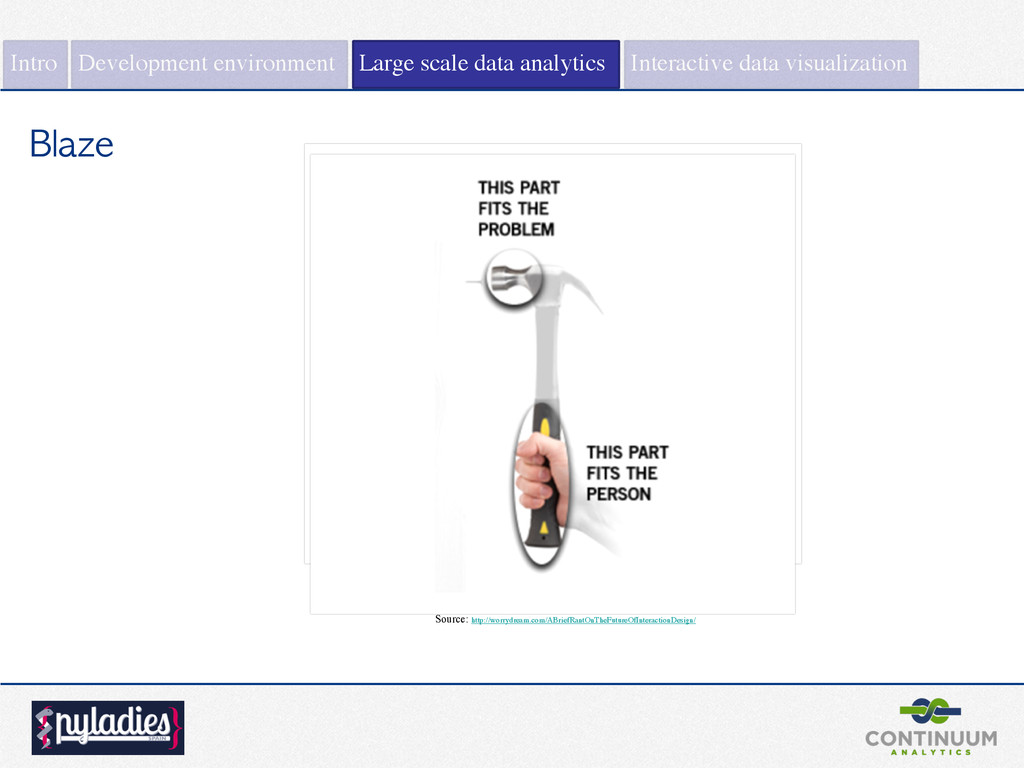
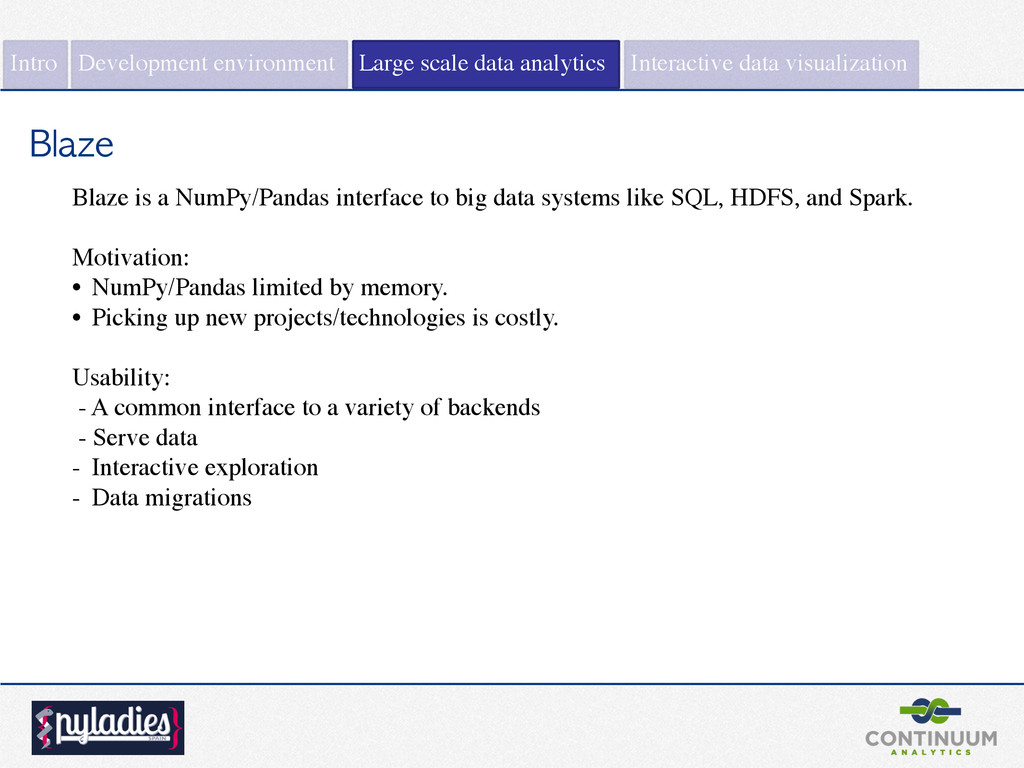
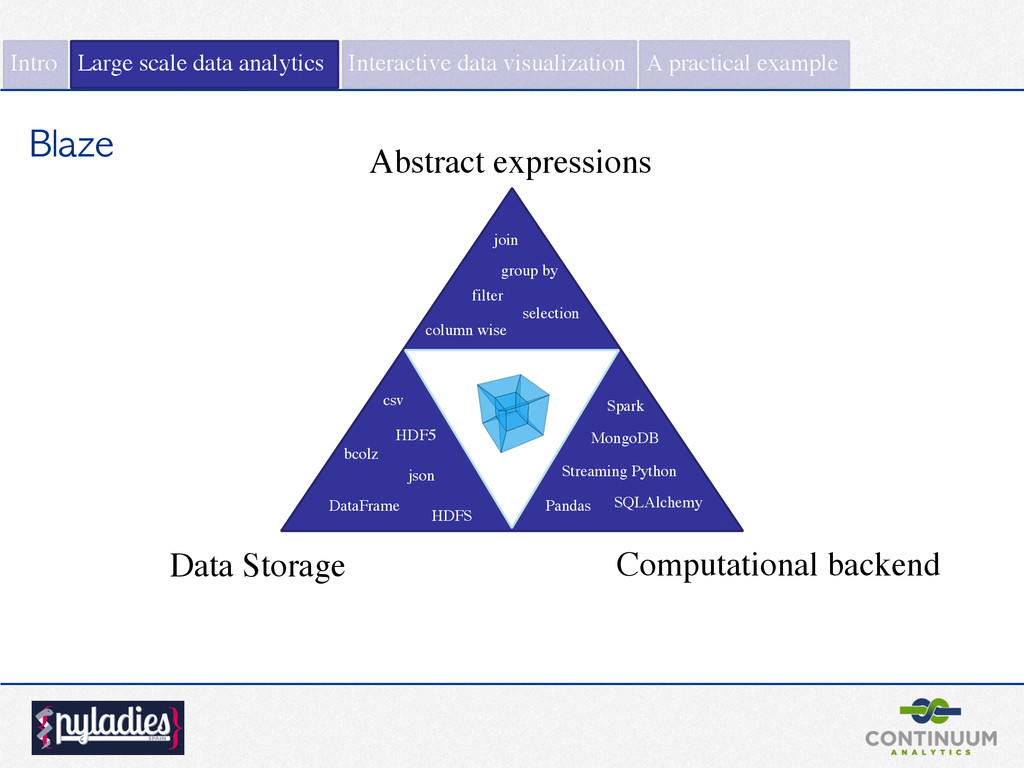
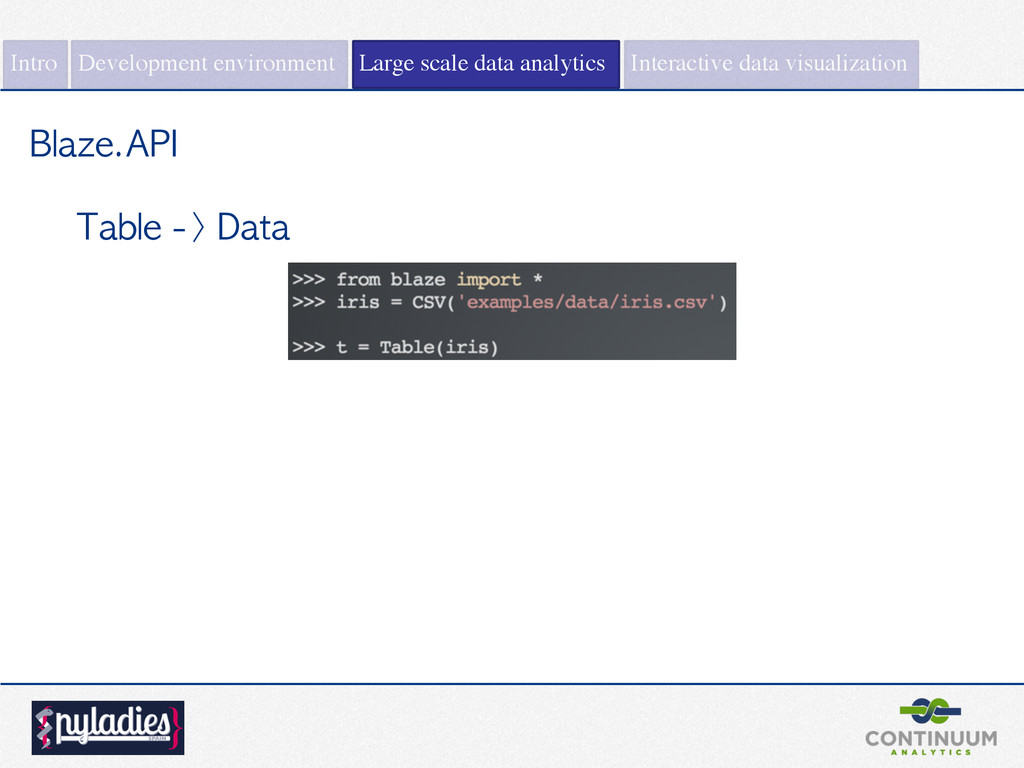
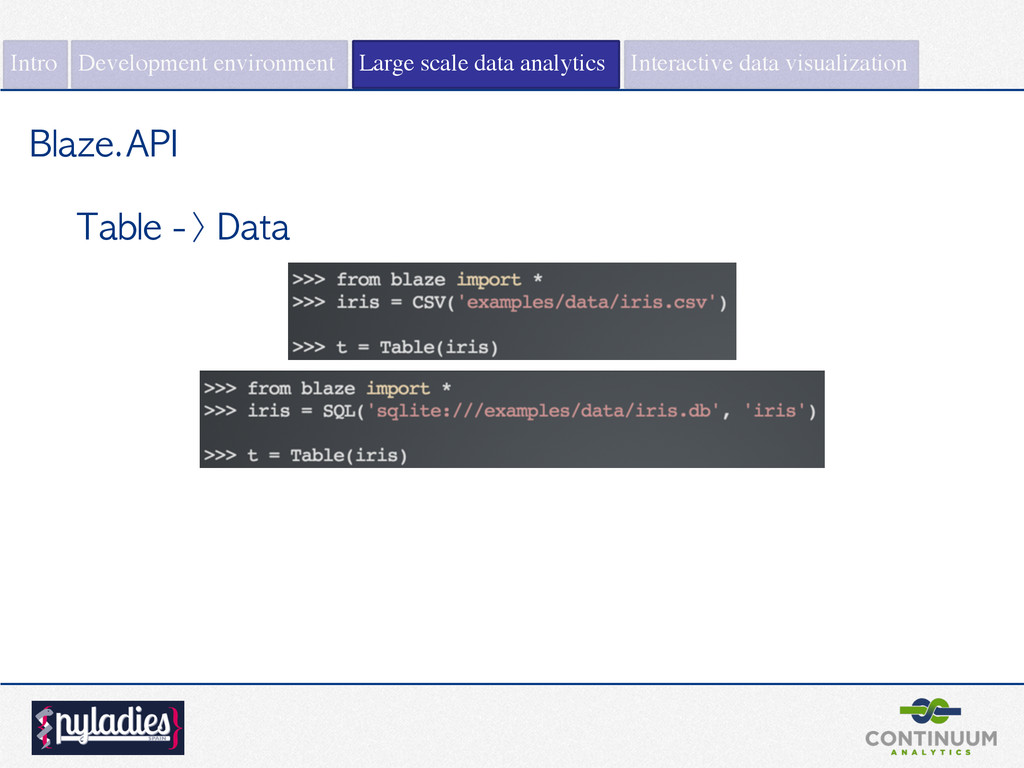
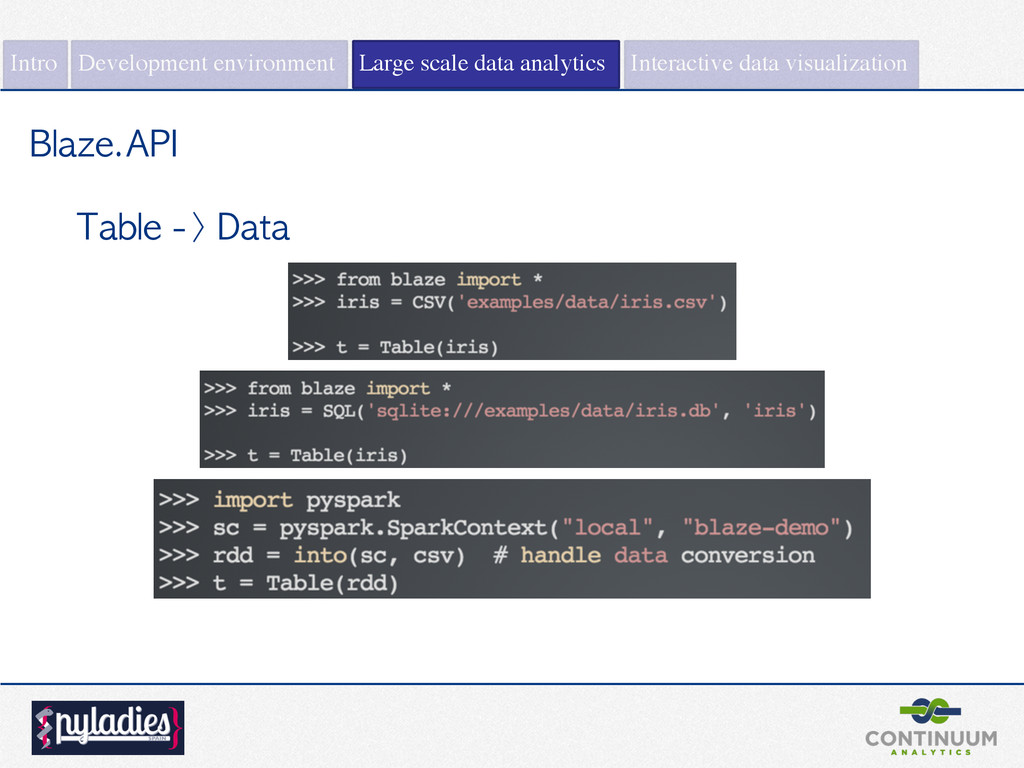
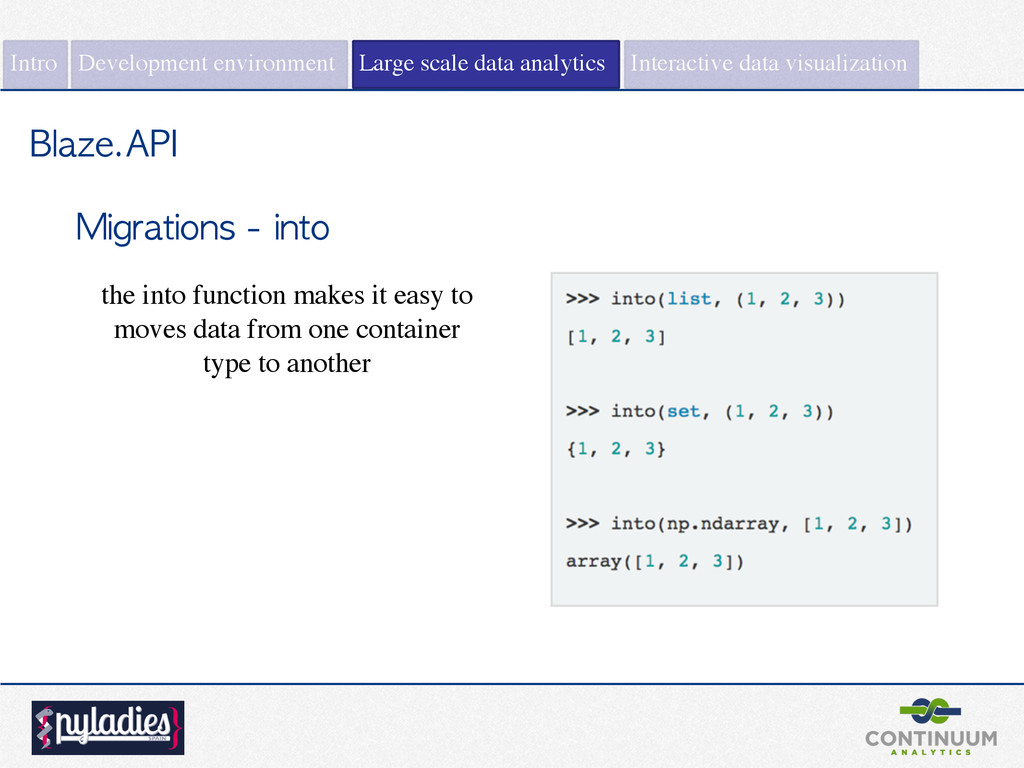
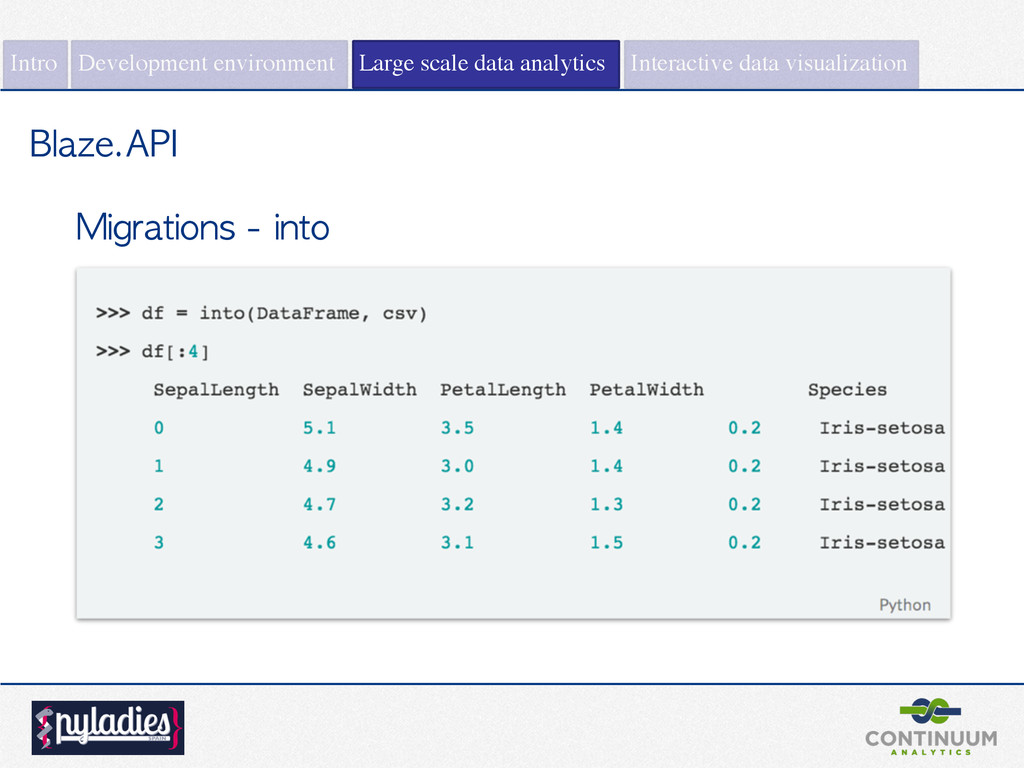
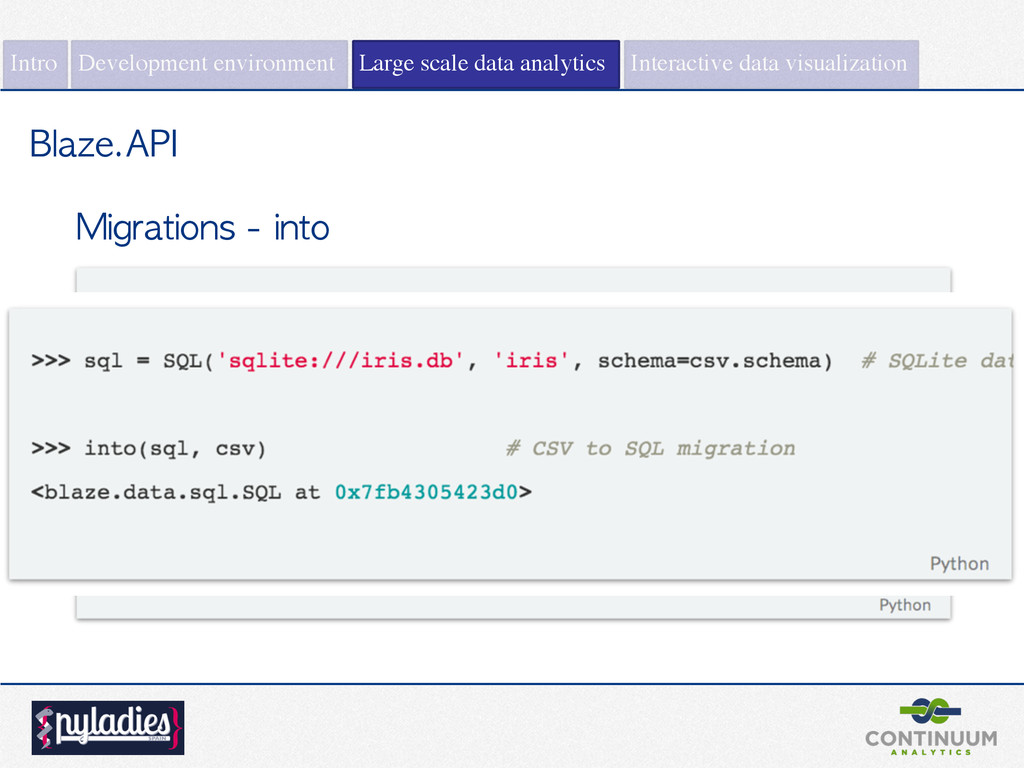
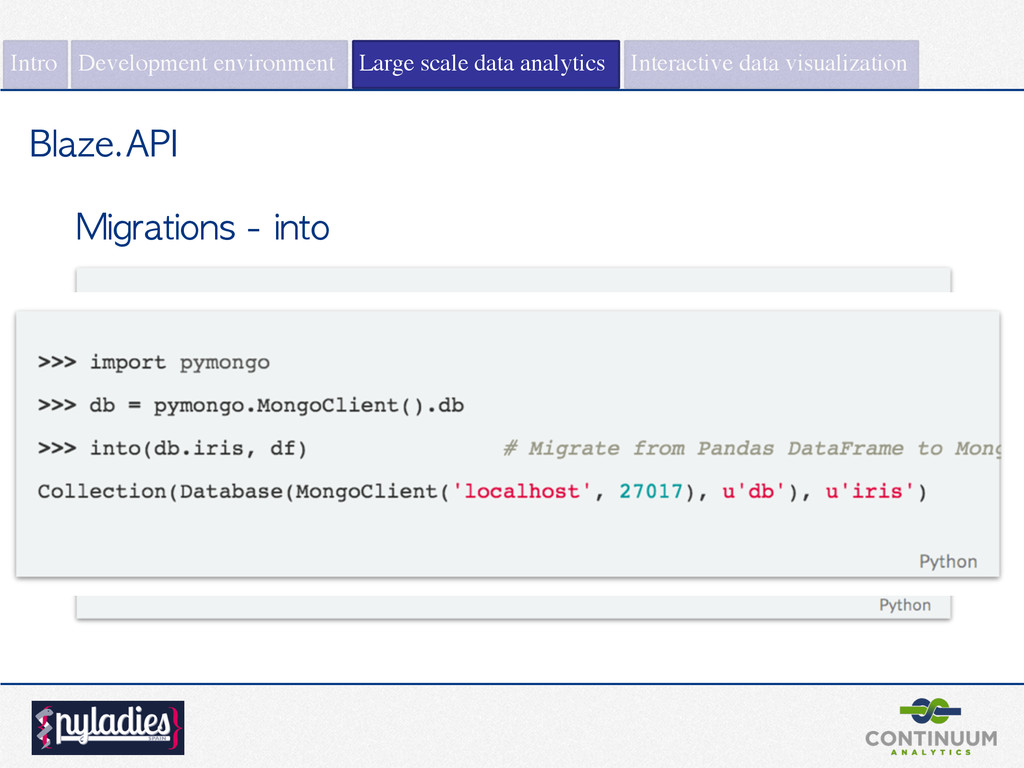
Blaze Blaze is a NumPy/Pandas interface to big data systems like SQL, HDFS, and Spark. ! Motivation: • NumPy/Pandas limited by memory. • Picking up new projects/technologies is costly. ! Usability: - A common interface to a variety of backends - Serve data - Interactive exploration - Data migrations
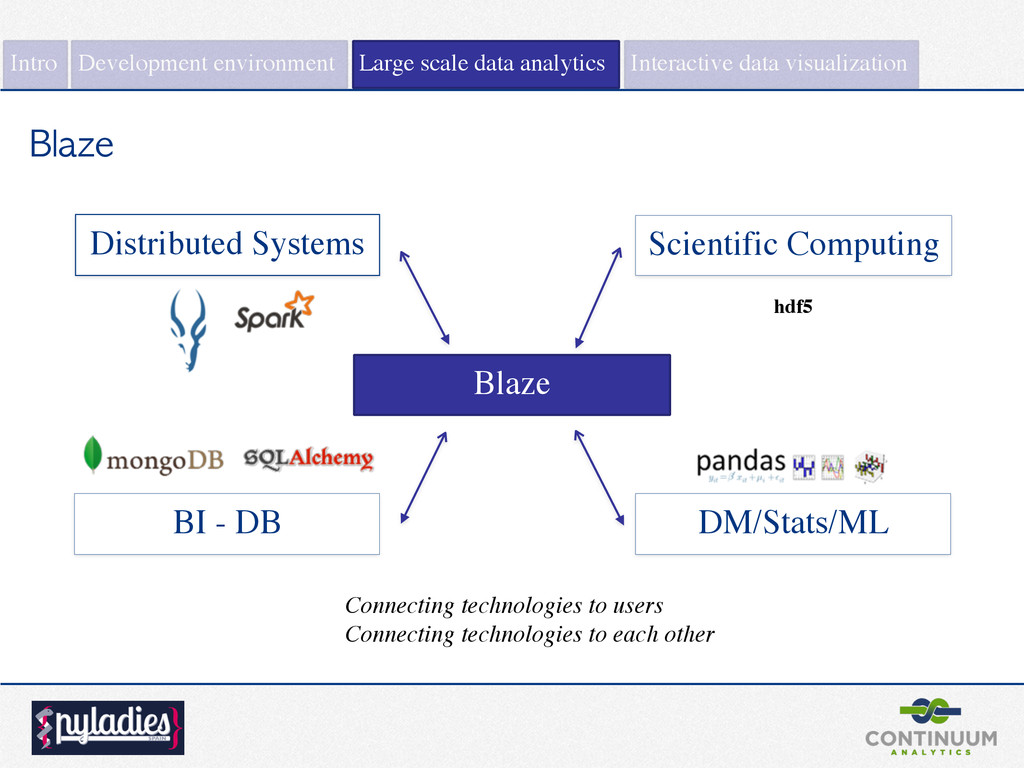
technologies to users Connecting technologies to each other Blaze hdf5 Intro Large scale data analytics Interactive data visualization Development environment
Intro Large scale data analytics Interactive data visualization A practical example HDFS selection filter group by join column wise Pandas Streaming Python Spark MongoDB SQLAlchemy json Blaze
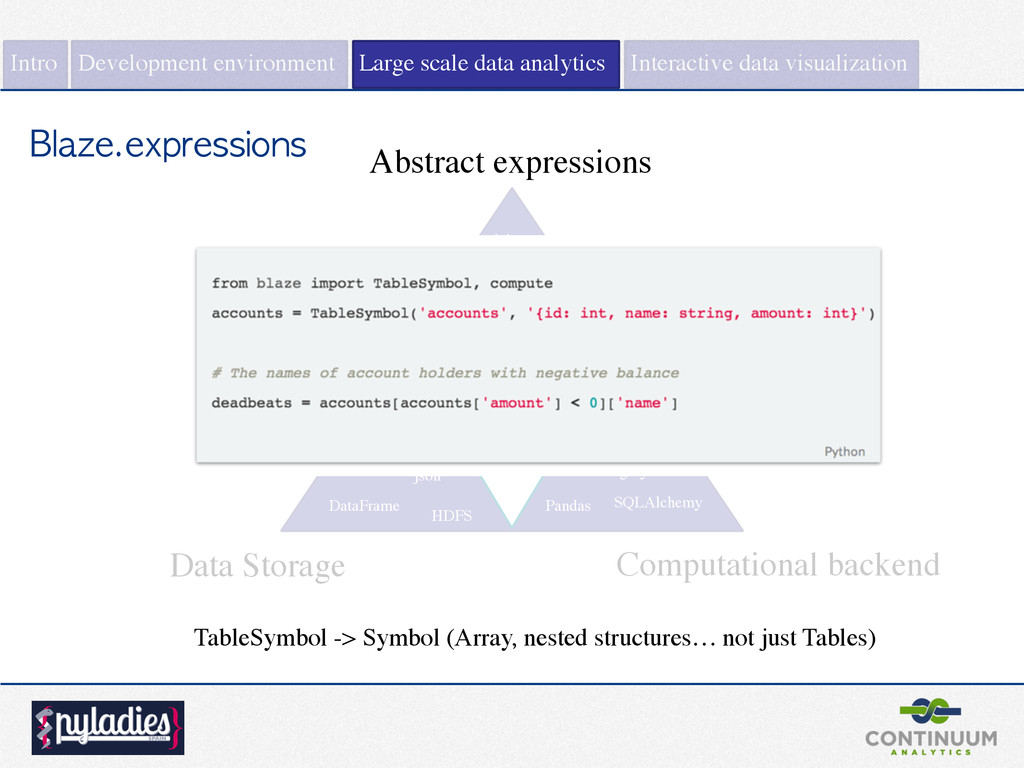
HDFS selection filter group by join column wise Pandas Streaming Python Spark MongoDB SQLAlchemy json Blaze.expressions Intro Large scale data analytics Interactive data visualization Development environment TableSymbol -> Symbol (Array, nested structures… not just Tables)
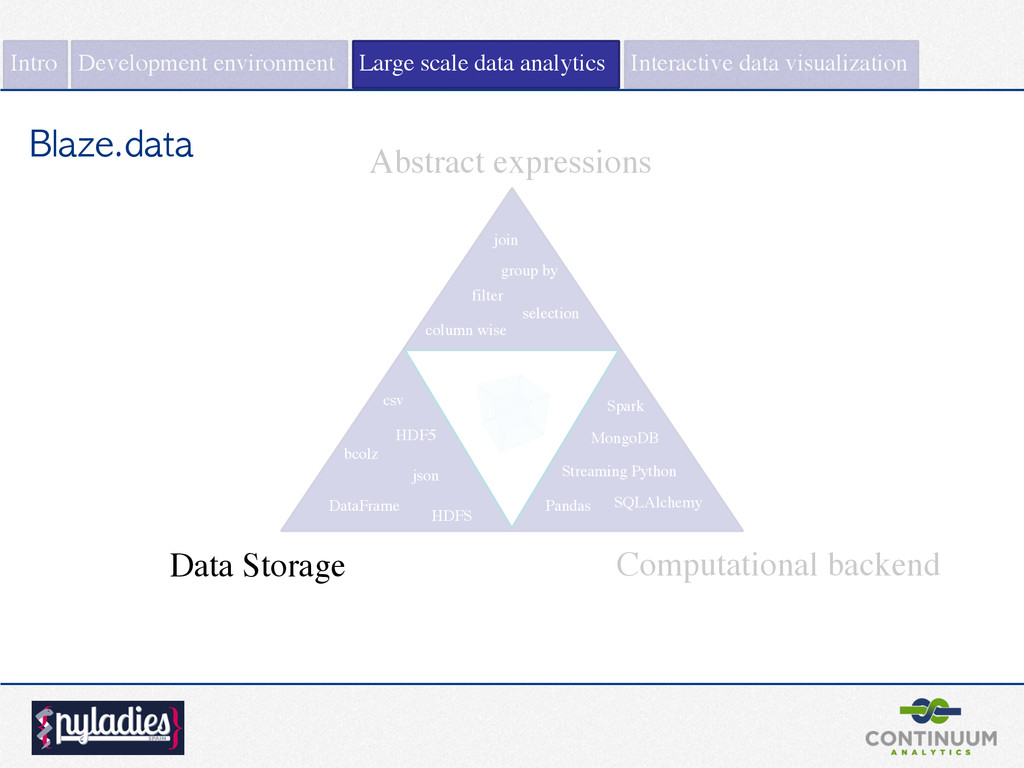
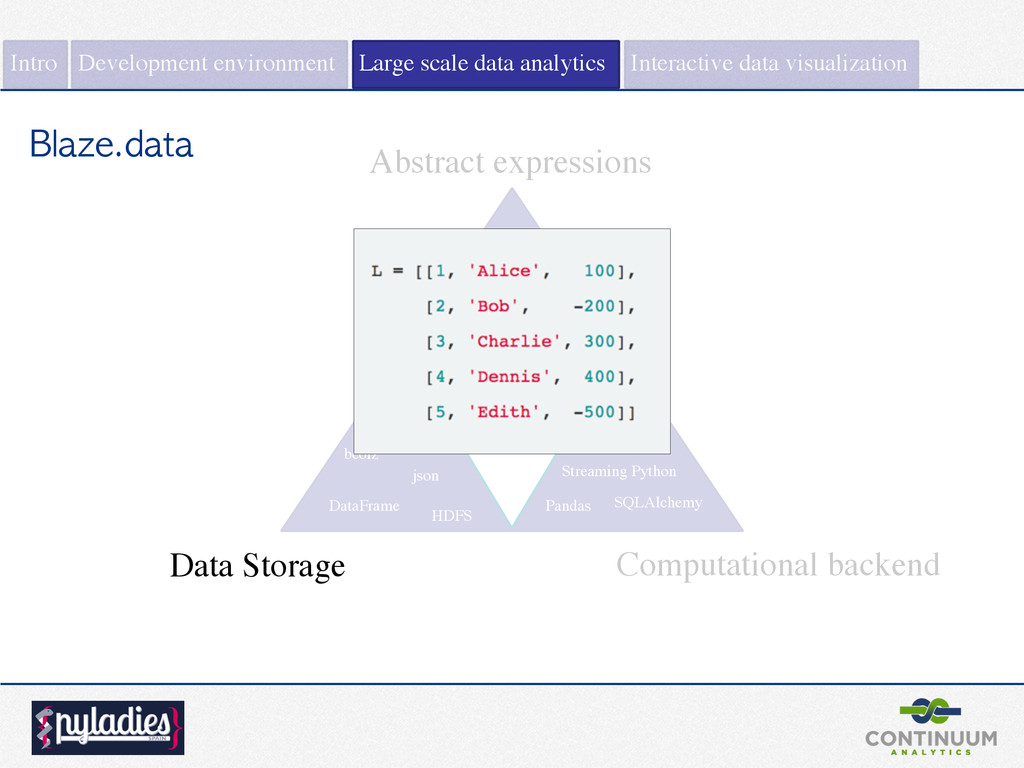
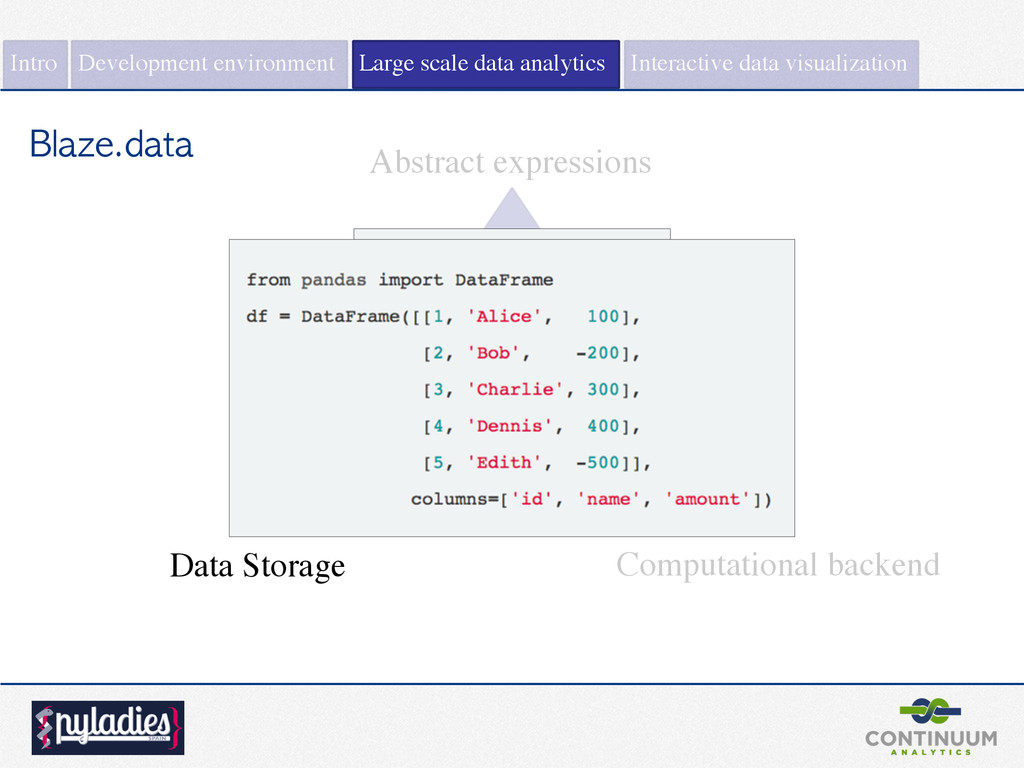
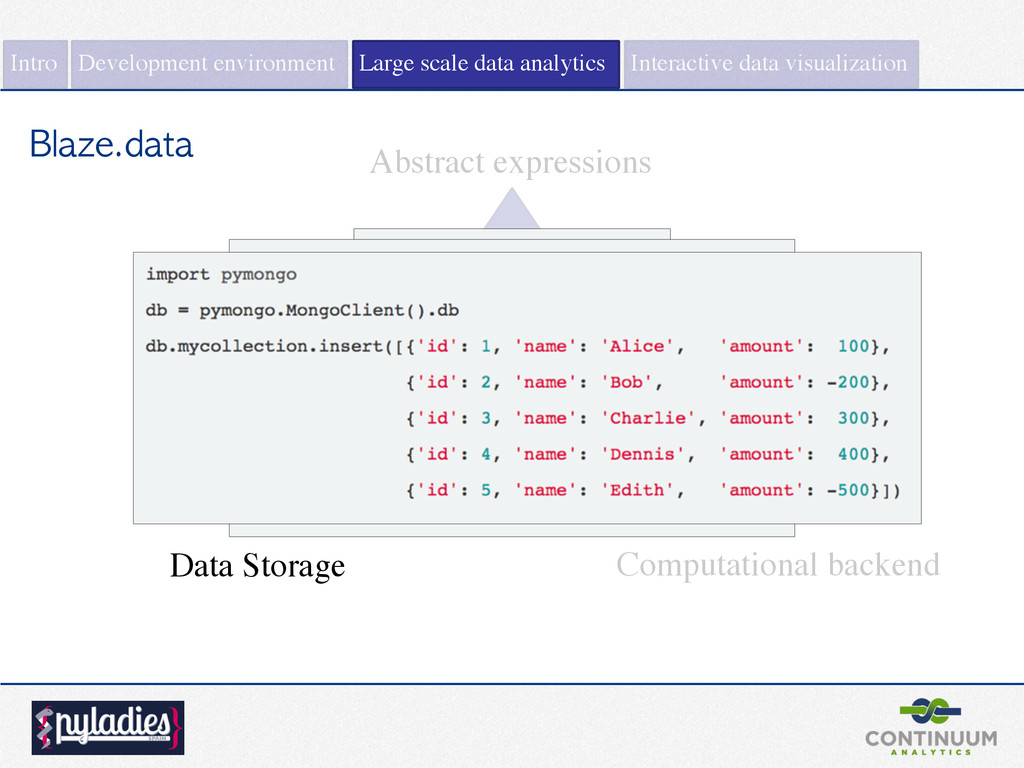
HDFS selection filter group by join column wise Pandas Streaming Python Spark MongoDB SQLAlchemy json Blaze.data Intro Large scale data analytics Interactive data visualization Development environment
HDFS selection filter group by join column wise Pandas Streaming Python Spark MongoDB SQLAlchemy json Blaze.data Intro Large scale data analytics Interactive data visualization Development environment
HDFS selection filter group by join column wise Pandas Streaming Python Spark MongoDB SQLAlchemy json Blaze.data Intro Large scale data analytics Interactive data visualization Development environment
HDFS selection filter group by join column wise Pandas Streaming Python Spark MongoDB SQLAlchemy json Blaze.data Intro Large scale data analytics Interactive data visualization Development environment
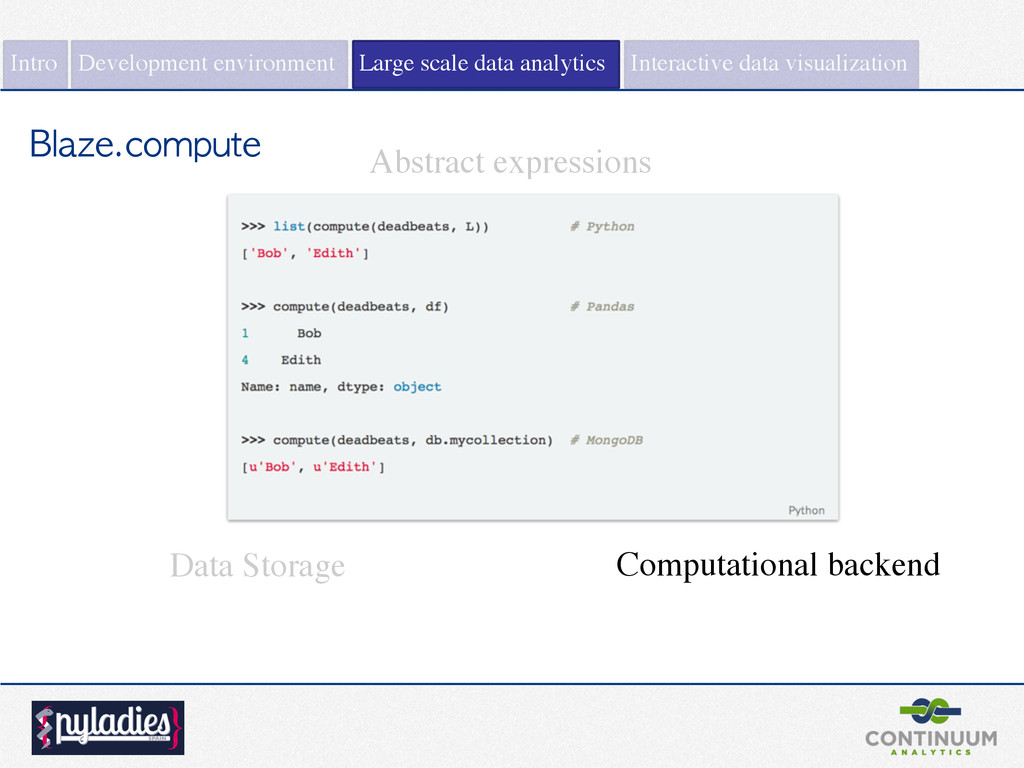
HDFS selection filter group by join column wise Pandas Streaming Python Spark MongoDB SQLAlchemy json Blaze.compute Intro Large scale data analytics Interactive data visualization Development environment
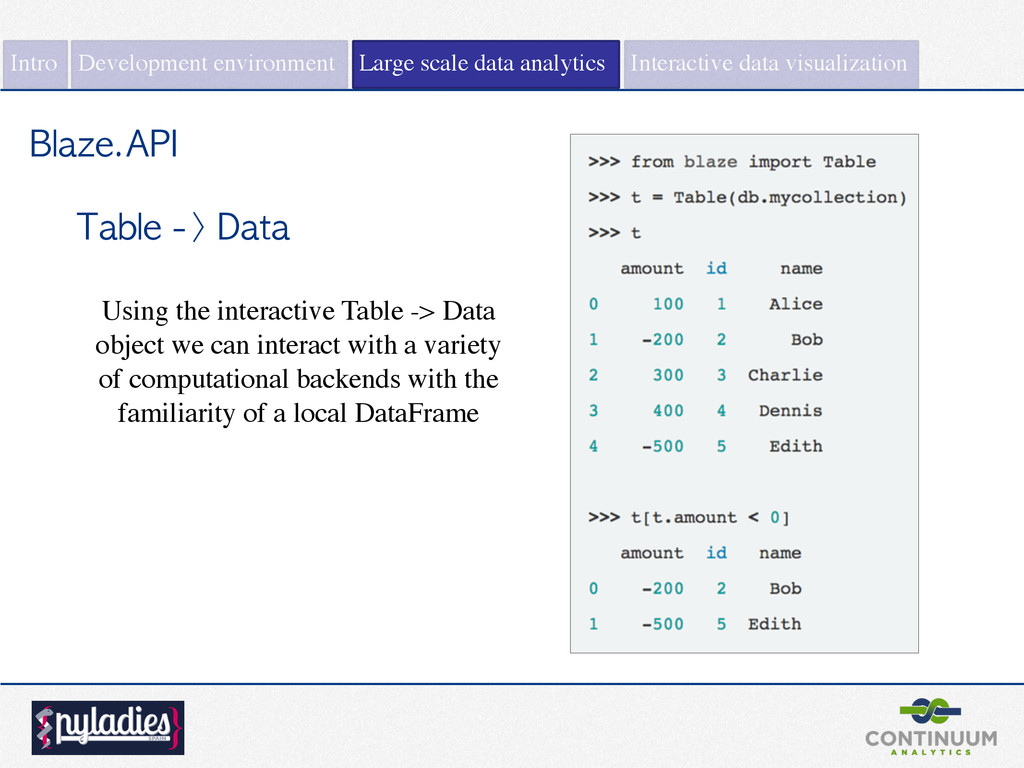
object we can interact with a variety of computational backends with the familiarity of a local DataFrame Intro Large scale data analytics Interactive data visualization Development environment
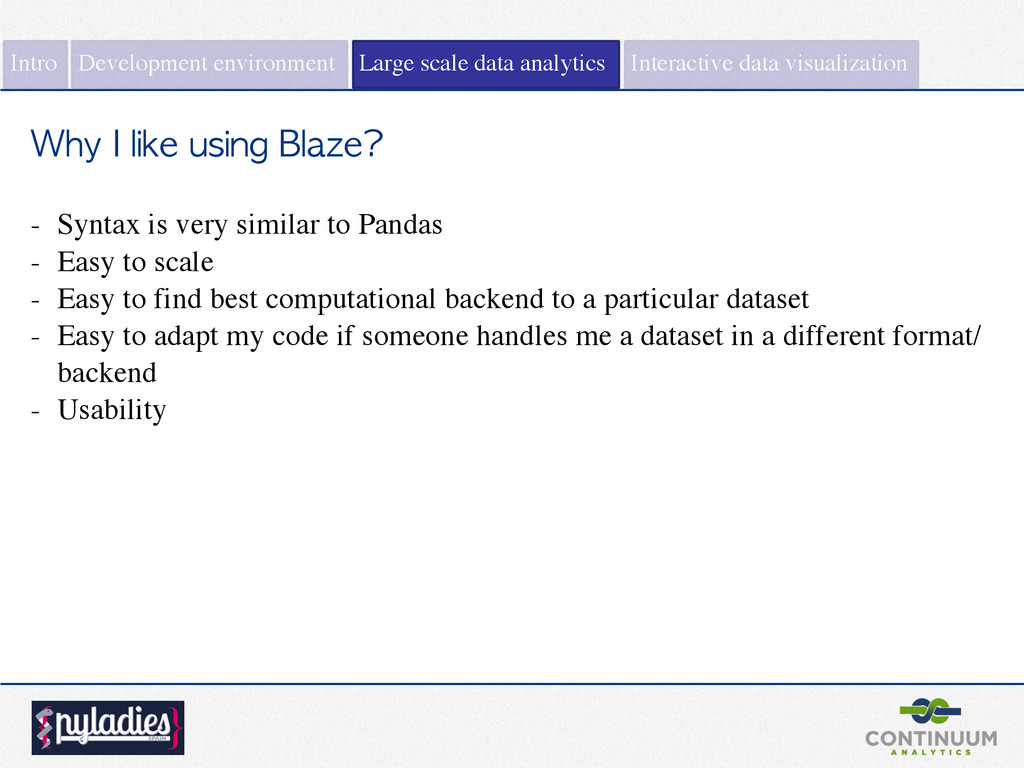
similar to Pandas - Easy to scale - Easy to find best computational backend to a particular dataset - Easy to adapt my code if someone handles me a dataset in a different format/ backend - Usability Intro Large scale data analytics Interactive data visualization Development environment
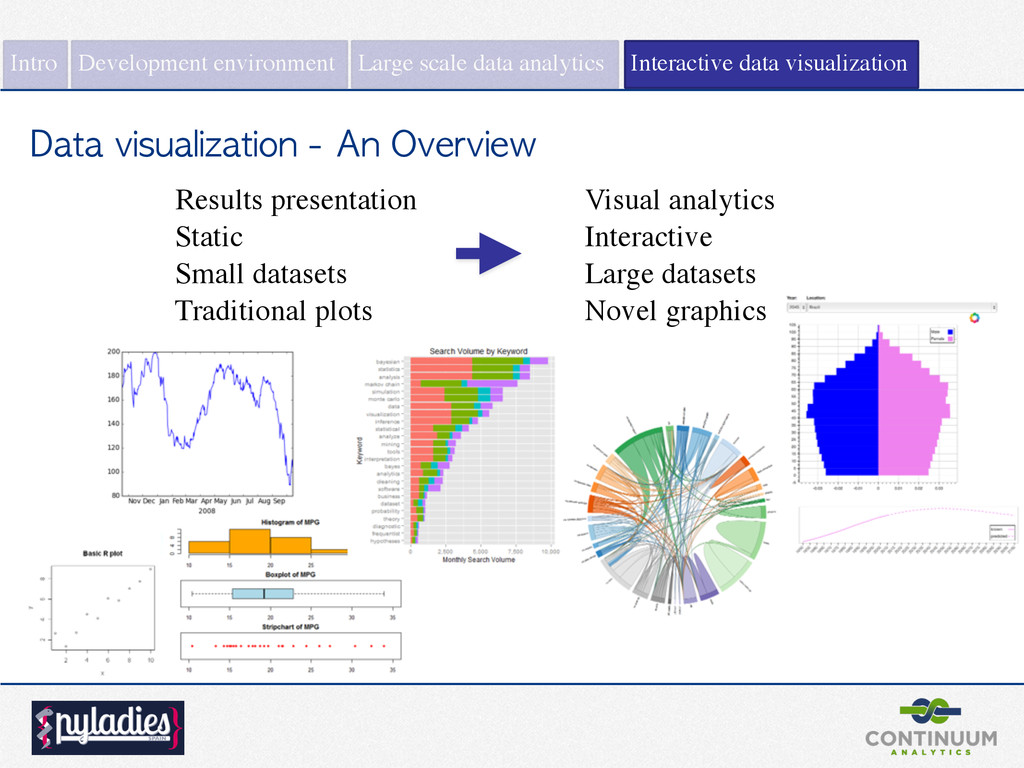
Interactive Small datasets Large datasets Traditional plots Novel graphics Intro Large scale data analytics Interactive data visualization Development environment
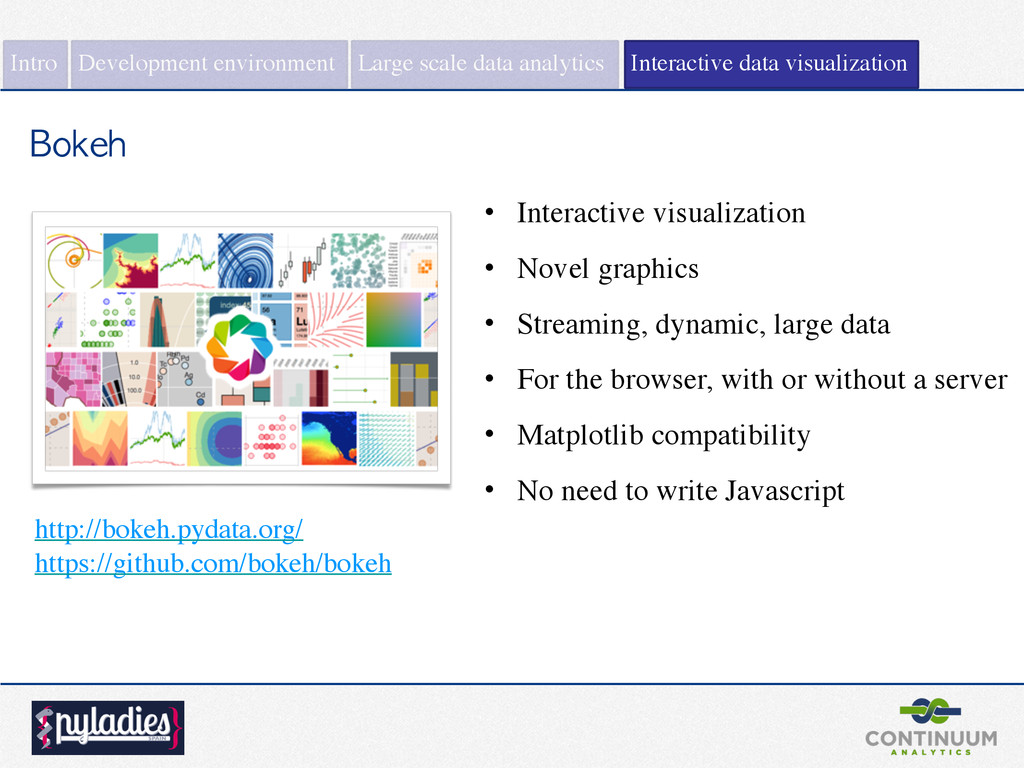
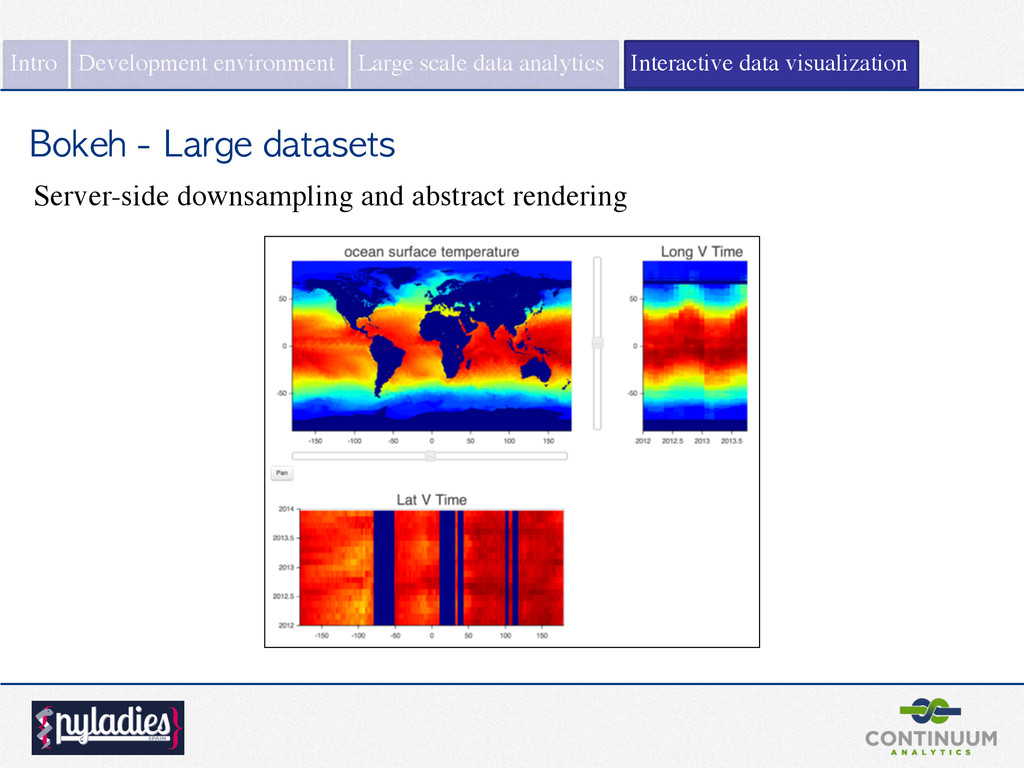
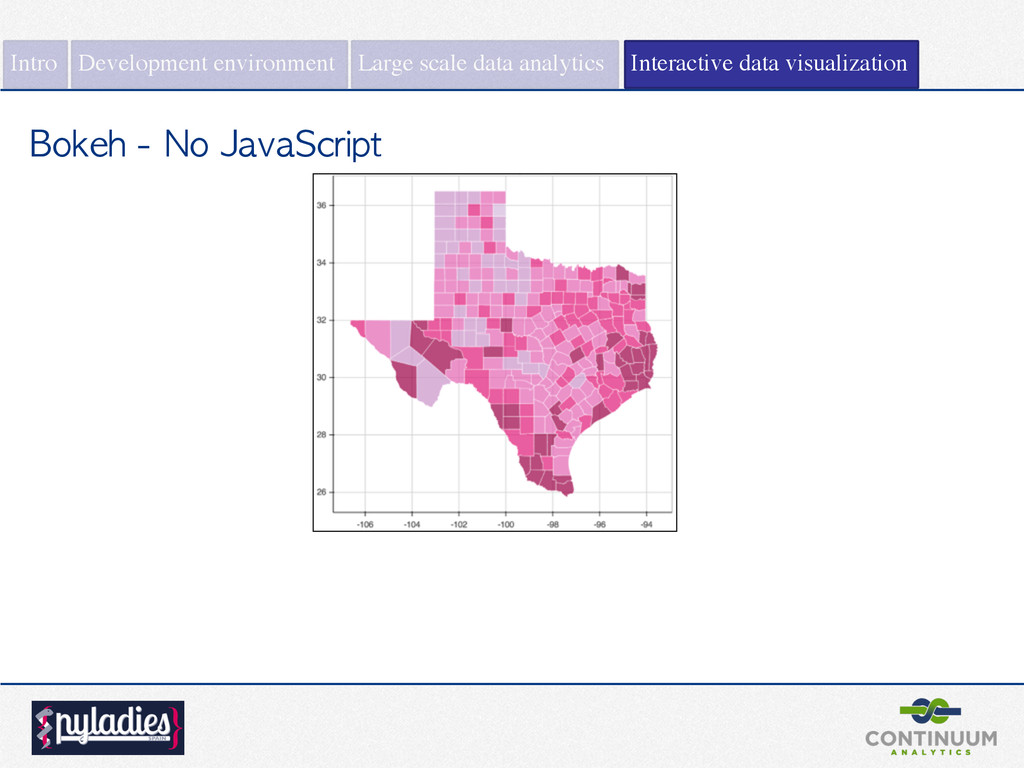
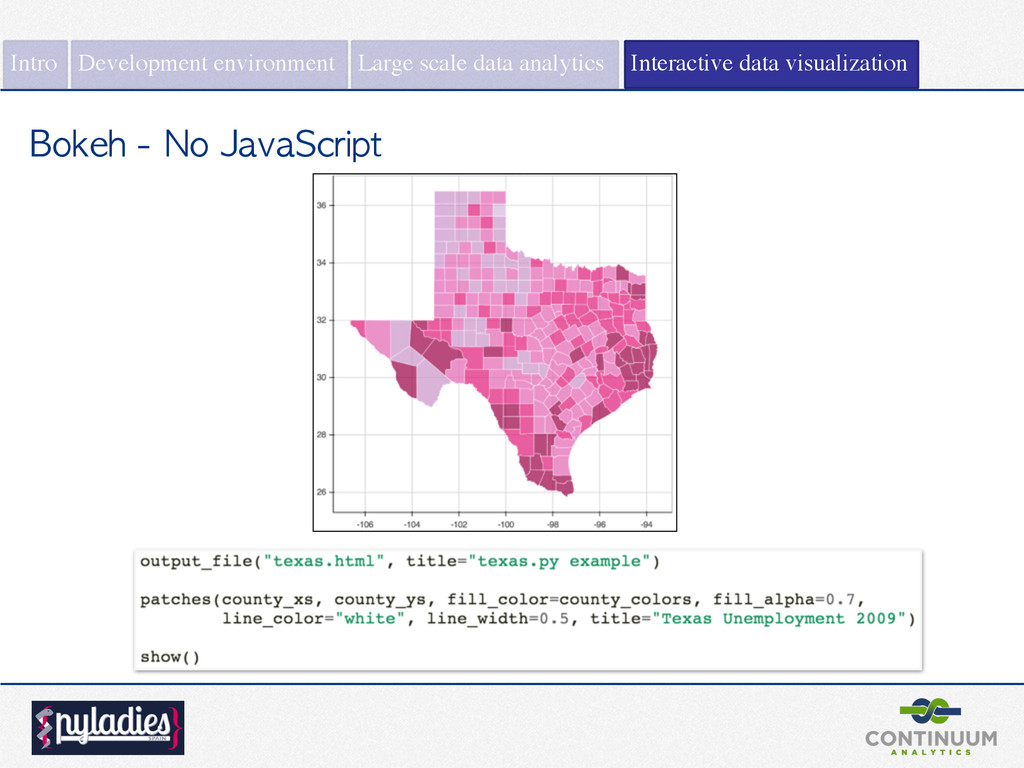
large data • For the browser, with or without a server • Matplotlib compatibility • No need to write Javascript http://bokeh.pydata.org/ https://github.com/bokeh/bokeh Intro Large scale data analytics Interactive data visualization Development environment