Upgrade to Pro — share decks privately, control downloads, hide ads and more …

Using Python with R

Daniel Chen
November 08, 2019

Using Python with R

Using the R Reticulate package to call Python in R.

Daniel Chen

November 08, 2019
Tweet

More Decks by Daniel Chen

Other Decks in Technology

Transcript

  1. Using Python with R Using Python with R Daniel Chen

    Daniel Chen @chendaniely @chendaniely DCR Conference 2019 DCR Conference 2019 1 / 42 1 / 42
  2. hi! hi! Daniel Chen @chendaniely DCR Conference 2019 https://github.com/chendaniely/rstatsdc_2019-python-r Daniel

    Chen @chendaniely DCR Conference 2019 https://github.com/chendaniely/rstatsdc_2019-python-r 2 / 42 2 / 42
  3. PhD Student: Virginia Tech PhD Student: Virginia Tech Data Science

    education Data Science education Medical practitioners Medical practitioners Inten at RStudio Inten at RStudio gradethis gradethis Code grader for Code grader for learnr learnr documents documents Author: Author: I'm Daniel I'm Daniel Daniel Chen @chendaniely DCR Conference 2019 https://github.com/chendaniely/rstatsdc_2019-python-r Daniel Chen @chendaniely DCR Conference 2019 https://github.com/chendaniely/rstatsdc_2019-python-r 3 / 42 3 / 42
  4. The Tiobe Index Top 10 Following are the top 10

    languages in the June 2019 Tiobe index: 1. Java 2. C 3. Python 4. C 5. Visual 6. C 7. JavaScript 8. PHP 9. SQL 10. Assembly The Pypl Index Top 10 Following are the top 10 languages in the June 2018 Pypl index: Python Java JavaScript C PHP C R Objective Swift Matlab R and Python Taken from: https://www.infoworld.com/article/3401536/python-popularity-reaches-an-all-time-high.html Daniel Chen @chendaniely DCR Conference 2019 https://github.com/chendaniely/rstatsdc_2019-python-r 4 / 42
  5. Python... ... a general-purpose programming language. May not be the

    best at everything (anything?) but second best at everthing is pretty good. Python does environments better than R (waiting to test out renv) One thing that Python is objectively better at than R is Web Development and Hardware Daniel Chen @chendaniely DCR Conference 2019 https://github.com/chendaniely/rstatsdc_2019-python-r 5 / 42
  6. What I like about R Communication Daniel Chen @chendaniely DCR

    Conference 2019 https://github.com/chendaniely/rstatsdc_2019-python-r 6 / 42
  7. Inspiration for talk 2019 Nonclinical Biostatistics Conference https://github.com/chendaniely/ncb-2019-python Jupyter notebook

    RISE plugin (reveal.js) Slow and clunky Unable to see source (nicely) without Jupyter loaded RMarkdown + Reticulate = Slides! (hint hint: this talk ;D) Daniel Chen @chendaniely DCR Conference 2019 https://github.com/chendaniely/rstatsdc_2019-python-r 7 / 42
  8. R and Python R and Python Daniel Chen @chendaniely DCR

    Conference 2019 https://github.com/chendaniely/rstatsdc_2019-python-r Daniel Chen @chendaniely DCR Conference 2019 https://github.com/chendaniely/rstatsdc_2019-python-r 8 / 42 8 / 42
  9. R analysis - Load data library(here) library(readr) raw = readr::read_csv(here::here("./data/billboard.csv"))

    head(raw) ## # A tibble: 6 x 83 ## year artist.inverted track time genre date.entered date.peaked ## <dbl> <chr> <chr> <tim> <chr> <date> <date> ## 1 2000 Destiny's Child Inde… 03:38 Rock 2000-09-23 2000-11-18 ## 2 2000 Santana Mari… 04:18 Rock 2000-02-12 2000-04-08 ## 3 2000 Savage Garden I Kn… 04:07 Rock 1999-10-23 2000-01-29 ## 4 2000 Madonna Music 03:45 Rock 2000-08-12 2000-09-16 ## 5 2000 Aguilera, Chri… Come… 03:38 Rock 2000-08-05 2000-10-14 ## 6 2000 Janet Does… 04:17 Rock 2000-06-17 2000-08-26 ## # … with 76 more variables: x1st.week <dbl>, x2nd.week <dbl>, ## # x3rd.week <dbl>, x4th.week <dbl>, x5th.week <dbl>, x6th.week <dbl>, ## # x7th.week <dbl>, x8th.week <dbl>, x9th.week <dbl>, x10th.week <dbl>, ## # x11th.week <dbl>, x12th.week <dbl>, x13th.week <dbl>, ## # x14th.week <dbl>, x15th.week <dbl>, x16th.week <dbl>, ## # x17th.week <dbl>, x18th.week <dbl>, x19th.week <dbl>, ## # x20th.week <dbl>, x21st.week <dbl>, x22nd.week <dbl>, ## # x23rd.week <dbl>, x24th.week <dbl>, x25th.week <dbl>, ## # x26th.week <dbl>, x27th.week <dbl>, x28th.week <dbl>, ## # x29th.week <dbl>, x30th.week <dbl>, x31st.week <dbl>, Daniel Chen @chendaniely DCR Conference 2019 https://github.com/chendaniely/rstatsdc_2019-python-r 9 / 42
  10. R analysis - Filter data library(dplyr) raw_filtered <- raw %>%

    dplyr::select(year, artist.inverted, track, time, date.entered, x1st.week:x73rd.week) %>% dplyr::rename(artist = artist.inverted) raw_filtered ## # A tibble: 317 x 78 ## year artist track time date.entered x1st.week x2nd.week x3rd.week ## <dbl> <chr> <chr> <tim> <date> <dbl> <dbl> <dbl> ## 1 2000 Desti… Inde… 03:38 2000-09-23 78 63 49 ## 2 2000 Santa… Mari… 04:18 2000-02-12 15 8 6 ## 3 2000 Savag… I Kn… 04:07 1999-10-23 71 48 43 ## 4 2000 Madon… Music 03:45 2000-08-12 41 23 18 ## 5 2000 Aguil… Come… 03:38 2000-08-05 57 47 45 ## 6 2000 Janet Does… 04:17 2000-06-17 59 52 43 ## 7 2000 Desti… Say … 04:31 1999-12-25 83 83 44 ## 8 2000 Igles… Be W… 03:36 2000-04-01 63 45 34 ## 9 2000 Sisqo Inco… 03:52 2000-06-24 77 66 61 ## 10 2000 Lones… Amaz… 04:25 1999-06-05 81 54 44 ## # … with 307 more rows, and 70 more variables: x4th.week <dbl>, ## # x5th.week <dbl>, x6th.week <dbl>, x7th.week <dbl>, x8th.week <dbl>, ## # x9th.week <dbl>, x10th.week <dbl>, x11th.week <dbl>, x12th.week <dbl>, ## # x13th.week <dbl>, x14th.week <dbl>, x15th.week <dbl>, Daniel Chen @chendaniely DCR Conference 2019 https://github.com/chendaniely/rstatsdc_2019-python-r 10 / 42
  11. R analysis - Tidy data library(tidyr) raw_tidy <- raw_filtered %>%

    tidyr::pivot_longer(cols = tidyselect::starts_with('x'), names_to = "week", values_to = "rank") raw_tidy ## # A tibble: 23,141 x 7 ## year artist track time date.entered week rank ## <dbl> <chr> <chr> <tim> <date> <chr> <dbl> ## 1 2000 Destiny's Ch… Independent Women… 03:38 2000-09-23 x1st.we… 78 ## 2 2000 Destiny's Ch… Independent Women… 03:38 2000-09-23 x2nd.we… 63 ## 3 2000 Destiny's Ch… Independent Women… 03:38 2000-09-23 x3rd.we… 49 ## 4 2000 Destiny's Ch… Independent Women… 03:38 2000-09-23 x4th.we… 33 ## 5 2000 Destiny's Ch… Independent Women… 03:38 2000-09-23 x5th.we… 23 ## 6 2000 Destiny's Ch… Independent Women… 03:38 2000-09-23 x6th.we… 15 ## 7 2000 Destiny's Ch… Independent Women… 03:38 2000-09-23 x7th.we… 7 ## 8 2000 Destiny's Ch… Independent Women… 03:38 2000-09-23 x8th.we… 5 ## 9 2000 Destiny's Ch… Independent Women… 03:38 2000-09-23 x9th.we… 1 ## 10 2000 Destiny's Ch… Independent Women… 03:38 2000-09-23 x10th.w… 1 ## # … with 23,131 more rows Daniel Chen @chendaniely DCR Conference 2019 https://github.com/chendaniely/rstatsdc_2019-python-r 11 / 42
  12. R analysis - Clean data library(purrr) library(stringr) billboard_clean <- raw_tidy

    %>% dplyr::mutate( week = purrr::map_int( week, #function(x){as.integer(stringr::str_extract(x, '\\d+'))} ~ as.integer(stringr::str_extract(., "\\d+")) ) ) billboard_clean ## # A tibble: 23,141 x 7 ## year artist track time date.entered week rank ## <dbl> <chr> <chr> <tim> <date> <int> <dbl> ## 1 2000 Destiny's Chi… Independent Women P… 03:38 2000-09-23 1 78 ## 2 2000 Destiny's Chi… Independent Women P… 03:38 2000-09-23 2 63 ## 3 2000 Destiny's Chi… Independent Women P… 03:38 2000-09-23 3 49 ## 4 2000 Destiny's Chi… Independent Women P… 03:38 2000-09-23 4 33 ## 5 2000 Destiny's Chi… Independent Women P… 03:38 2000-09-23 5 23 ## 6 2000 Destiny's Chi… Independent Women P… 03:38 2000-09-23 6 15 ## 7 2000 Destiny's Chi… Independent Women P… 03:38 2000-09-23 7 7 ## 8 2000 Destiny's Chi… Independent Women P… 03:38 2000-09-23 8 5 ## 9 2000 Destiny's Chi… Independent Women P… 03:38 2000-09-23 9 1 Daniel Chen @chendaniely DCR Conference 2019 https://github.com/chendaniely/rstatsdc_2019-python-r 12 / 42
  13. Python analysis import pandas as pd import re import janitor

    from pyprojroot import here raw_py = pd.read_csv(here('./data/billboard.csv'), encoding = "ISO-8859-1") billboard_clean_py = ( raw_py .select_columns(['year', 'artist.inverted', 'track', 'time', 'date.entered', 'x*.week']) .rename_columns({"artist.inverted": "artist"}) .melt(id_vars = ['year', 'artist', 'track', 'time', 'date.entered'], var_name = "week", value_name = "rank") .transform_column('week', lambda x: int(re.findall(r'\d+', x)[0])) ) Daniel Chen @chendaniely DCR Conference 2019 https://github.com/chendaniely/rstatsdc_2019-python-r 13 / 42
  14. Reticulate -- Python in R! Calling Python from R Translation

    between R and Python objects Python environments Daniel Chen @chendaniely DCR Conference 2019 https://github.com/chendaniely/rstatsdc_2019-python-r 14 / 42
  15. Reticulate library(reticulate) (conda_envs <- reticulate::conda_list()) ## name python ## 1

    miniconda3 /home/dchen/miniconda3/bin/python # use my default conda environment conda_envs$name[[1]] ## [1] "miniconda3" env <- conda_envs$name[[1]] reticulate::use_condaenv(env) reticulate::py_config() ## python: /home/dchen/miniconda3/bin/python ## libpython: /home/dchen/miniconda3/lib/libpython3.7m.so ## pythonhome: /home/dchen/miniconda3:/home/dchen/miniconda3 ## version: 3.7.3 | packaged by conda-forge | (default, Jul 1 2019, 21:52:21) [GCC 7.3.0] ## numpy: /home/dchen/miniconda3/lib/python3.7/site-packages/numpy ## numpy_version: 1.17.3 Daniel Chen @chendaniely DCR Conference 2019 https://github.com/chendaniely/rstatsdc_2019-python-r 15 / 42
  16. A Python script import pandas as pd import re import

    janitor from pyprojroot import here raw_py = pd.read_csv(here('./data/billboard.csv'), encoding = "ISO-8859-1") billboard_clean_py = ( raw_py .select_columns(['year', 'artist.inverted', 'track', 'time', 'date.entered', 'x*.week']) .rename_columns({"artist.inverted": "artist"}) .melt(id_vars = ['year', 'artist', 'track', 'time', 'date.entered'], var_name = "week", value_name = "rank") .transform_column('week', lambda x: int(re.findall(r'\d+', x)[0])) ) mean_rank_by_week = (billboard_clean_py.groupby("week")["rank"] .mean()) Daniel Chen @chendaniely DCR Conference 2019 https://github.com/chendaniely/rstatsdc_2019-python-r 16 / 42
  17. Python objects in R reticulate::source_python(here::here("./scripts/01-02-python.py")) head(mean_rank_by_week) ## 1 2 3

    4 5 6 ## 79.95899 71.17308 65.04560 59.76333 56.33904 52.36071 head(billboard_clean_py) ## year artist track time ## 1 2000 Destiny's Child Independent Women Part I 3:38 ## 2 2000 Santana Maria, Maria 4:18 ## 3 2000 Savage Garden I Knew I Loved You 4:07 ## 4 2000 Madonna Music 3:45 ## 5 2000 Aguilera, Christina Come On Over Baby (All I Want Is You) 3:38 ## 6 2000 Janet Doesn't Really Matter 4:17 ## date.entered week rank ## 1 2000-09-23 1 78 ## 2 2000-02-12 1 15 ## 3 1999-10-23 1 71 ## 4 2000-08-12 1 41 ## 5 2000-08-05 1 57 ## 6 2000-06-17 1 59 Daniel Chen @chendaniely DCR Conference 2019 https://github.com/chendaniely/rstatsdc_2019-python-r 17 / 42
  18. Type conversions table R Python Examples Single-element vector Scalar 1,

    1L, TRUE, "foo" Multi-element vector List c(1.0, 2.0, 3.0), c(1L, 2L, 3L) List of multiple types Tuple list(1L, TRUE, "foo") Named list Dict list(a = 1L, b = 2.0), dict(x = x_data) Matrix/Array NumPy ndarray matrix(c(1,2,3,4), nrow = 2, ncol = 2) Data Frame Pandas DataFrame data.frame(x = c(1,2,3), y = c("a", "b", "c")) Function Python function function(x) x + 1 NULL, TRUE, FALSE None, True, False NULL, TRUE, FALSE https://rstudio.github.io/reticulate/#type-conversions Daniel Chen @chendaniely DCR Conference 2019 https://github.com/chendaniely/rstatsdc_2019-python-r 18 / 42
  19. Machine Learning Machine Learning Daniel Chen @chendaniely DCR Conference 2019

    https://github.com/chendaniely/rstatsdc_2019-python-r Daniel Chen @chendaniely DCR Conference 2019 https://github.com/chendaniely/rstatsdc_2019-python-r 19 / 42 19 / 42
  20. The data No standard for how to transport data within

    a package... from sklearn.datasets import load_breast_cancer cancer = load_breast_cancer() print(type(cancer)) ## <class 'sklearn.utils.Bunch'> vs import seaborn as sns tips = sns.load_dataset("tips") print(type(tips)) ## <class 'pandas.core.frame.DataFrame'> Daniel Chen @chendaniely DCR Conference 2019 https://github.com/chendaniely/rstatsdc_2019-python-r 20 / 42
  21. The data cancer.target[:10] ## array([0, 0, 0, 0, 0, 0,

    0, 0, 0, 0]) cancer.data[:10] ## array([[1.799e+01, 1.038e+01, 1.228e+02, 1.001e+03, 1.184e-01, 2.776e-01, ## 3.001e-01, 1.471e-01, 2.419e-01, 7.871e-02, 1.095e+00, 9.053e-01, ## 8.589e+00, 1.534e+02, 6.399e-03, 4.904e-02, 5.373e-02, 1.587e-02, ## 3.003e-02, 6.193e-03, 2.538e+01, 1.733e+01, 1.846e+02, 2.019e+03, ## 1.622e-01, 6.656e-01, 7.119e-01, 2.654e-01, 4.601e-01, 1.189e-01], ## [2.057e+01, 1.777e+01, 1.329e+02, 1.326e+03, 8.474e-02, 7.864e-02, ## 8.690e-02, 7.017e-02, 1.812e-01, 5.667e-02, 5.435e-01, 7.339e-01, ## 3.398e+00, 7.408e+01, 5.225e-03, 1.308e-02, 1.860e-02, 1.340e-02, ## 1.389e-02, 3.532e-03, 2.499e+01, 2.341e+01, 1.588e+02, 1.956e+03, ## 1.238e-01, 1.866e-01, 2.416e-01, 1.860e-01, 2.750e-01, 8.902e-02], ## [1.969e+01, 2.125e+01, 1.300e+02, 1.203e+03, 1.096e-01, 1.599e-01, ## 1.974e-01, 1.279e-01, 2.069e-01, 5.999e-02, 7.456e-01, 7.869e-01, ## 4.585e+00, 9.403e+01, 6.150e-03, 4.006e-02, 3.832e-02, 2.058e-02, ## 2.250e-02, 4.571e-03, 2.357e+01, 2.553e+01, 1.525e+02, 1.709e+03, ## 1.444e-01, 4.245e-01, 4.504e-01, 2.430e-01, 3.613e-01, 8.758e-02], ## [1.142e+01, 2.038e+01, 7.758e+01, 3.861e+02, 1.425e-01, 2.839e-01, ## 2.414e-01, 1.052e-01, 2.597e-01, 9.744e-02, 4.956e-01, 1.156e+00, ## 3.445e+00, 2.723e+01, 9.110e-03, 7.458e-02, 5.661e-02, 1.867e-02, Daniel Chen @chendaniely DCR Conference 2019 https://github.com/chendaniely/rstatsdc_2019-python-r 21 / 42
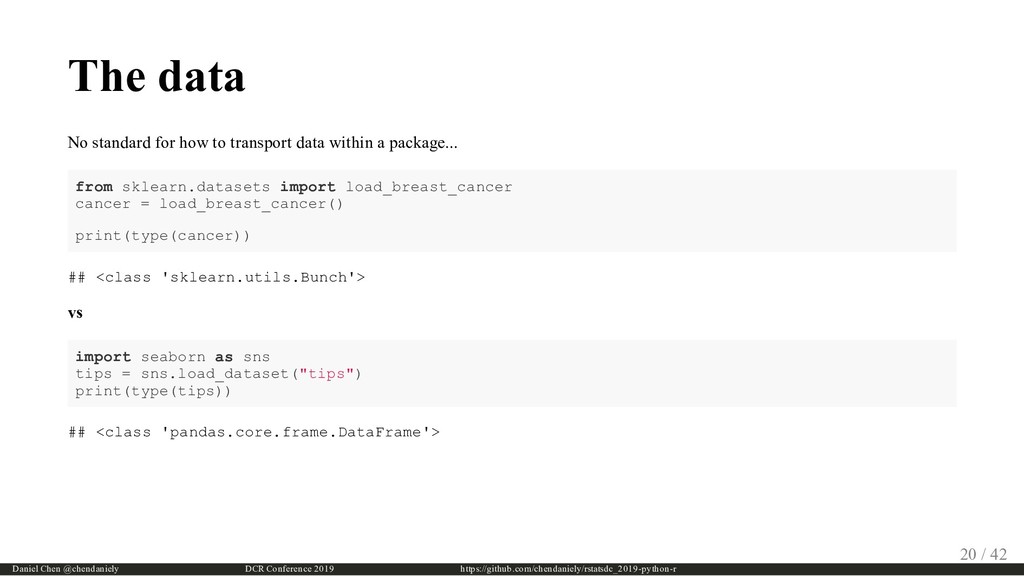
  22. Python -- Preprocess from sklearn.model_selection import train_test_split from sklearn.preprocessing import

    MinMaxScaler from sklearn.svm import SVC # split the data X_train, X_test, y_train, y_test = train_test_split( cancer.data, cancer.target, random_state=0) # compute minimum and maximum on the training data scaler = MinMaxScaler().fit(X_train) # rescale training data X_train_scaled = scaler.transform(X_train) Daniel Chen @chendaniely DCR Conference 2019 https://github.com/chendaniely/rstatsdc_2019-python-r 22 / 42
  23. Python -- Fit svm = SVC() # learn an SVM

    on the scaled training data svm.fit(X_train_scaled, y_train) ## SVC(C=1.0, cache_size=200, class_weight=None, coef0=0.0, ## decision_function_shape='ovr', degree=3, gamma='auto_deprecated', ## kernel='rbf', max_iter=-1, probability=False, random_state=None, ## shrinking=True, tol=0.001, verbose=False) Daniel Chen @chendaniely DCR Conference 2019 https://github.com/chendaniely/rstatsdc_2019-python-r 23 / 42
  24. Python -- Evaluate # scale test data and score the

    scaled data X_test_scaled = scaler.transform(X_test) svm.score(X_test_scaled, y_test) ## 0.951048951048951 Default scoring metric is accuracy Daniel Chen @chendaniely DCR Conference 2019 https://github.com/chendaniely/rstatsdc_2019-python-r 24 / 42
  25. R -- Python setup library(reticulate) # reticulate::use_condaenv("miniconda3") (conda_envs <- reticulate::conda_list())

    ## name python ## 1 miniconda3 /home/dchen/miniconda3/bin/python conda_envs$name[[1]] ## [1] "miniconda3" env <- conda_envs$name[[1]] reticulate::use_condaenv(env) Daniel Chen @chendaniely DCR Conference 2019 https://github.com/chendaniely/rstatsdc_2019-python-r 25 / 42
  26. R -- Get data sklearn_datasets = reticulate::import_from_path("sklearn.datasets") cancer = sklearn_datasets$load_breast_cancer()

    library(tibble) cancer_df <- tibble::as_tibble(cancer$data) names(cancer_df) <- cancer$feature_names cancer_df$target <- cancer$target cancer_df ## # A tibble: 569 x 31 ## `mean radius` `mean texture` `mean perimeter` `mean area` ## <dbl> <dbl> <dbl> <dbl> ## 1 18.0 10.4 123. 1001 ## 2 20.6 17.8 133. 1326 ## 3 19.7 21.2 130 1203 ## 4 11.4 20.4 77.6 386. ## 5 20.3 14.3 135. 1297 ## 6 12.4 15.7 82.6 477. ## 7 18.2 20.0 120. 1040 ## 8 13.7 20.8 90.2 578. ## 9 13 21.8 87.5 520. ## 10 12.5 24.0 84.0 476. ## # … with 559 more rows, and 27 more variables: `mean smoothness` <dbl>, ## # `mean compactness` <dbl>, `mean concavity` <dbl>, `mean concave ## # points` <dbl>, `mean symmetry` <dbl>, `mean fractal dimension` <dbl>, Daniel Chen @chendaniely DCR Conference 2019 https://github.com/chendaniely/rstatsdc_2019-python-r 26 / 42
  27. R -- Preprocess library(rsample) library(recipes) cancer_split <- rsample::initial_split(cancer_df) cancer_train <-

    rsample::training(cancer_split) cancer_test <- rsample::testing(cancer_split) res <- recipes::recipe(target ~ ., data = cancer_train) %>% recipes::step_scale(recipes::all_predictors()) %>% recipes::step_num2factor(recipes::all_outcomes()) res_preped <- res %>% recipes::prep() res_baked <- res_preped %>% bake(new_data = cancer_train, composition = "tibble") res_test <- res_preped %>% bake(new_data = cancer_test, composition = "tibble") Daniel Chen @chendaniely DCR Conference 2019 https://github.com/chendaniely/rstatsdc_2019-python-r 27 / 42
  28. R -- Fit https://tidymodels.github.io/parsnip/articles/articles/Models.html library(parsnip) svm <- parsnip::svm_rbf(mode = "classification",

    cost = 1) %>% parsnip::set_engine("kernlab") %>% parsnip::fit(target ~ ., data = res_baked) Daniel Chen @chendaniely DCR Conference 2019 https://github.com/chendaniely/rstatsdc_2019-python-r 28 / 42
  29. R -- Evaluate library(yardstick) predict(svm, res_test) %>% dplyr::bind_cols(res_test %>% dplyr::select(target))

    %>% yardstick::accuracy(truth = target, estimate = .pred_class) ## # A tibble: 1 x 3 ## .metric .estimator .estimate ## <chr> <chr> <dbl> ## 1 accuracy binary 0.972 Daniel Chen @chendaniely DCR Conference 2019 https://github.com/chendaniely/rstatsdc_2019-python-r 29 / 42
  30. Communication Communication Daniel Chen @chendaniely DCR Conference 2019 https://github.com/chendaniely/rstatsdc_2019-python-r Daniel

    Chen @chendaniely DCR Conference 2019 https://github.com/chendaniely/rstatsdc_2019-python-r 30 / 42 30 / 42
  31. This presentation Written in RMarkdown exported as a xaringan slide

    deck All the R and Python code are live executed by changing the execution engine ```{r} library(reticulate) reticulate::use_condaenv("Anaconda3") ``` ```{python} from sklearn.datasets import load_breast_cancer cancer = load_breast_cancer() ``` Daniel Chen @chendaniely DCR Conference 2019 https://github.com/chendaniely/rstatsdc_2019-python-r 31 / 42
  32. Sharing objects R < -- > Python In R chunks,

    you can access python objects with: py$ In Python chunks, you can access R objects with: r. Note the dot in r. In Python chunk: single_obs_py = X_test_scaled[:1, :] # first row of the test data single_obs_py ## array([[0.30380046, 0.44854772, 0.30993021, 0.17527041, 0.62962963, ## 0.43668242, 0.33856607, 0.40616302, 0.53333333, 0.49052233, ## 0.10106826, 0.12555836, 0.11006926, 0.04942689, 0.17120785, ## 0.1958559 , 0.08717172, 0.25269937, 0.17111501, 0.10745132, ## 0.301672 , 0.47014925, 0.31321281, 0.16201337, 0.56943802, ## 0.34763416, 0.40782748, 0.70651051, 0.39818648, 0.36639118]]) In R chunk: single_obs_r <-py$single_obs_py # get an R object Daniel Chen @chendaniely DCR Conference 2019 https://github.com/chendaniely/rstatsdc_2019-python-r 32 / 42
  33. Python -- Prediction svm.predict(single_obs_py) # using python variable ## array([0])

    svm.predict(r.single_obs_r) # using R variable ## array([0]) Daniel Chen @chendaniely DCR Conference 2019 https://github.com/chendaniely/rstatsdc_2019-python-r 33 / 42
  34. R -- Prediction r_dat <- as.data.frame(single_obs_r) names(r_dat) <- py$cancer$feature_names predict(svm,

    r_dat) ## # A tibble: 1 x 1 ## .pred_class ## <fct> ## 1 0 Daniel Chen @chendaniely DCR Conference 2019 https://github.com/chendaniely/rstatsdc_2019-python-r 34 / 42
  35. Shiny https://scikit-learn.org/stable/modules/model_persistence.html Save out the model from joblib import dump,

    load from pyprojroot import here dump(svm, here("output/python_model.joblib", warn=False)) ## ['/home/dchen/git/hub/rstatsdc_2019-python-r/output/python_model.joblib'] Load the model python_model = load(here("output/python_model.joblib")) Daniel Chen @chendaniely DCR Conference 2019 https://github.com/chendaniely/rstatsdc_2019-python-r 35 / 42
  36. Shiny https://github.com/chendaniely/rstatsdc_2019-python-r/blob/master/shiny_example.Rmd ```{r} inputPanel( sliderInput("bw_adjust", label = "Bandwidth adjustment:", min

    = 1, max = 20, value = 1, step = 1) ) renderText({ py$python_model$predict(py$X_test_scaled[1:input$bw_adjust, , drop=FALSE]) }) ``` Daniel Chen @chendaniely DCR Conference 2019 https://github.com/chendaniely/rstatsdc_2019-python-r 36 / 42
  37. The -down ecosystem All of this is using the reticulate

    R package https://rstudio.github.io/reticulate/ Bookdown Blogdown Hugo academic already supports Jupyter notebooks https://sourcethemes.com/academic/docs/jupyter By the way... knitpy: https://github.com/jankatins/knitpy jupyter books: https://jupyterbook.org/intro.html Daniel Chen @chendaniely DCR Conference 2019 https://github.com/chendaniely/rstatsdc_2019-python-r 37 / 42
  38. Creating a reticulated R package The R keras package is

    an R wrapper around keras for Python https://keras.rstudio.com/ https://rstudio.github.io/reticulate/articles/package.html Daniel Chen @chendaniely DCR Conference 2019 https://github.com/chendaniely/rstatsdc_2019-python-r 38 / 42
  39. Installing Python... I recommend looking at the Software-Carpentry setup instructions:

    https://swcarpentry.github.io/python-novice-inflammation/setup/index.html Most people in data science use Anaconda to install Python https://www.anaconda.com/distribution/ People who mainly use python for Web development don't use Anaconda Daniel Chen @chendaniely DCR Conference 2019 https://github.com/chendaniely/rstatsdc_2019-python-r 39 / 42
  40. About conda.. What they forgot to teach you about R:

    https://rstats.wtf/ There's a section about using conda with R: https://rstats.wtf/set-up-an-r-dev-environment.html#what-about-conda tl;dr - don't mix conda install with install.packages() Daniel Chen @chendaniely DCR Conference 2019 https://github.com/chendaniely/rstatsdc_2019-python-r 40 / 42
  41. Apache arrow If you heard me speak before... DCR 2018:

    Structuring Your Data Science Projects https://youtu.be/UQHz38s3DyA NYR 2019: Building Reproducible and Replicable Projects https://youtu.be/t-vY9FeIIMk Save out data objects to share between Python and R scripts Python: https://arrow.apache.org/docs/python/ R: https://arrow.apache.org/docs/r/ Daniel Chen @chendaniely DCR Conference 2019 https://github.com/chendaniely/rstatsdc_2019-python-r 41 / 42