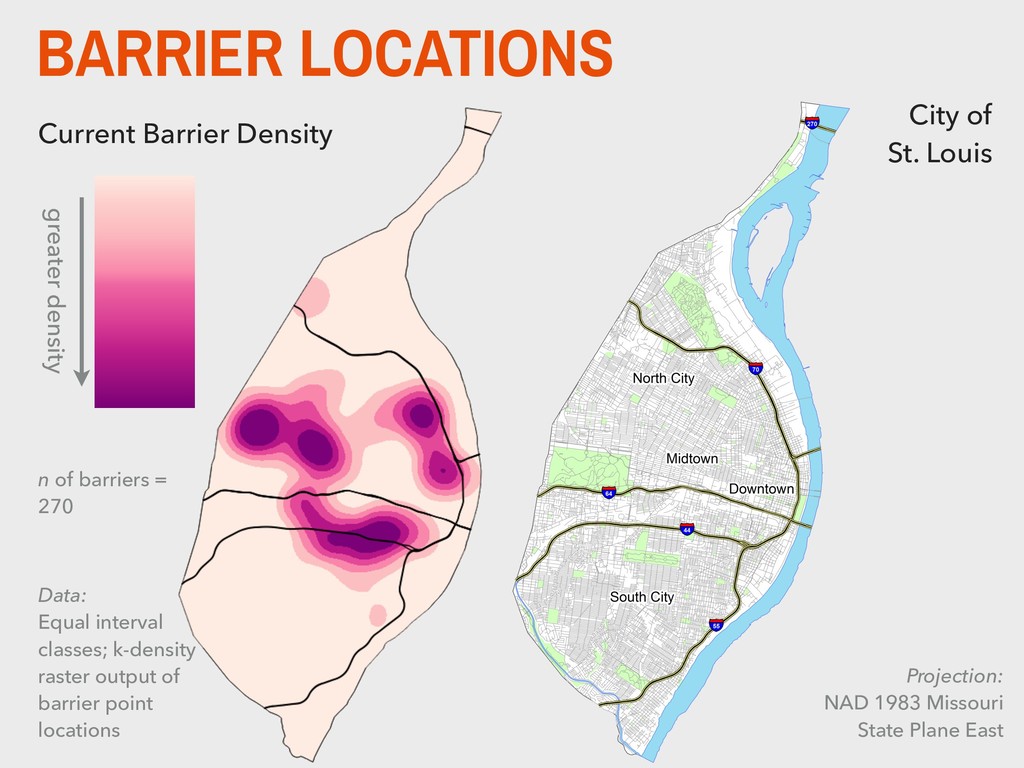
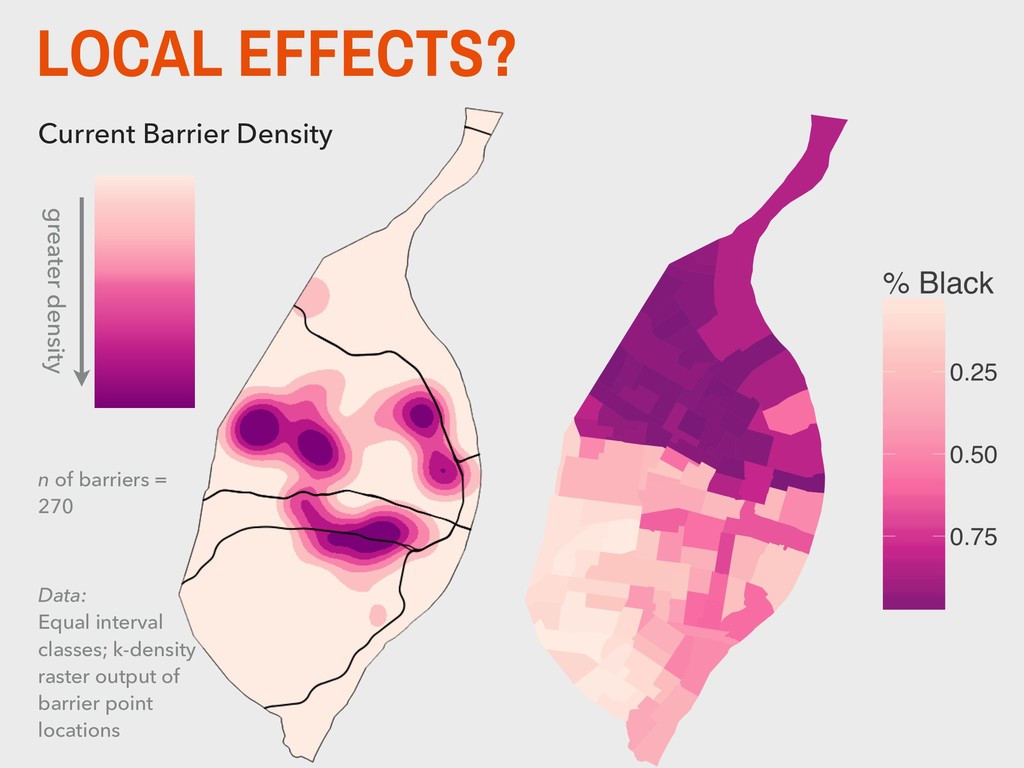
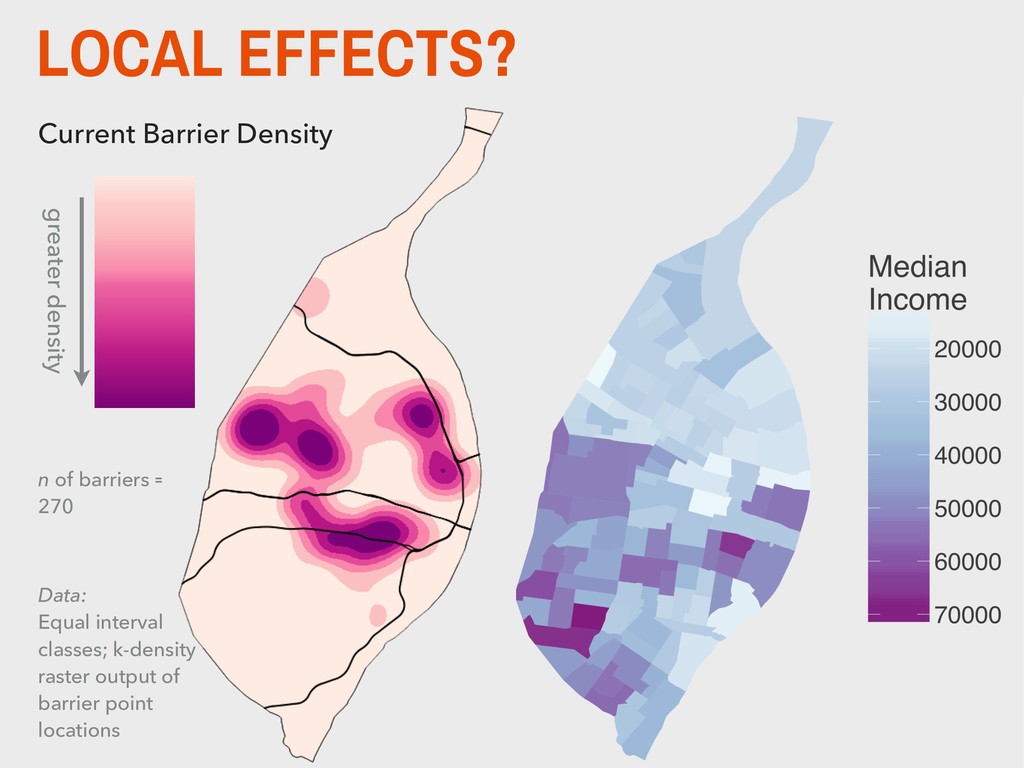
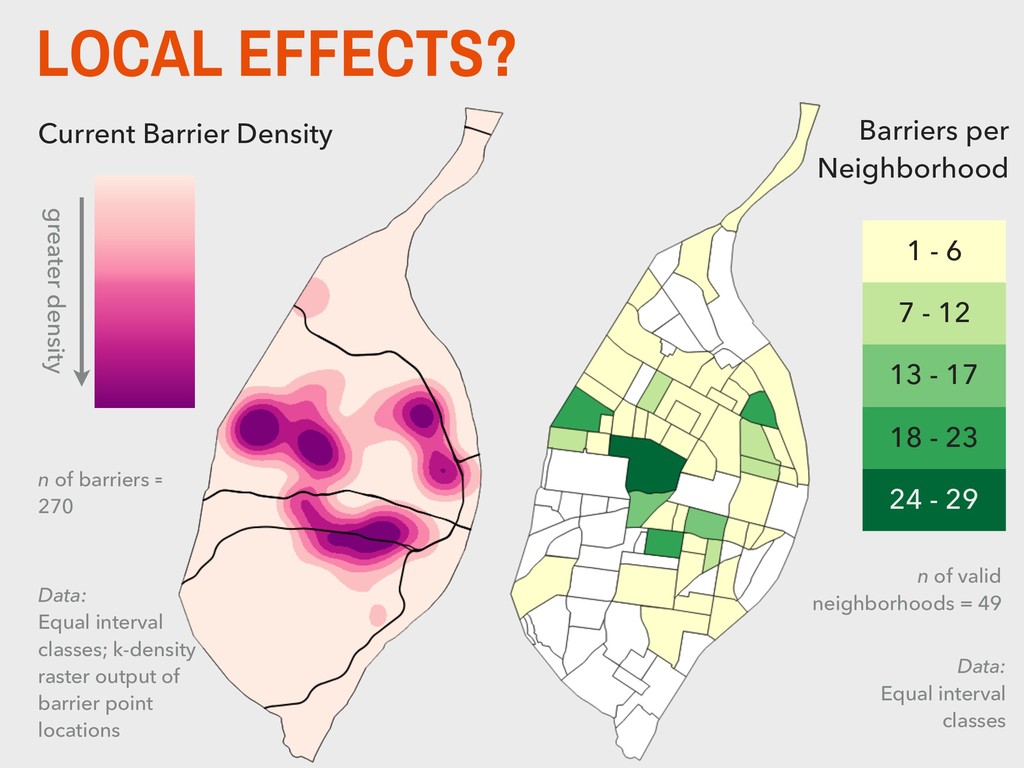
Projection: NAD 1983 Missouri State Plane East greater density n of barriers = 270 Data: Equal interval classes; k-density raster output of barrier point locations
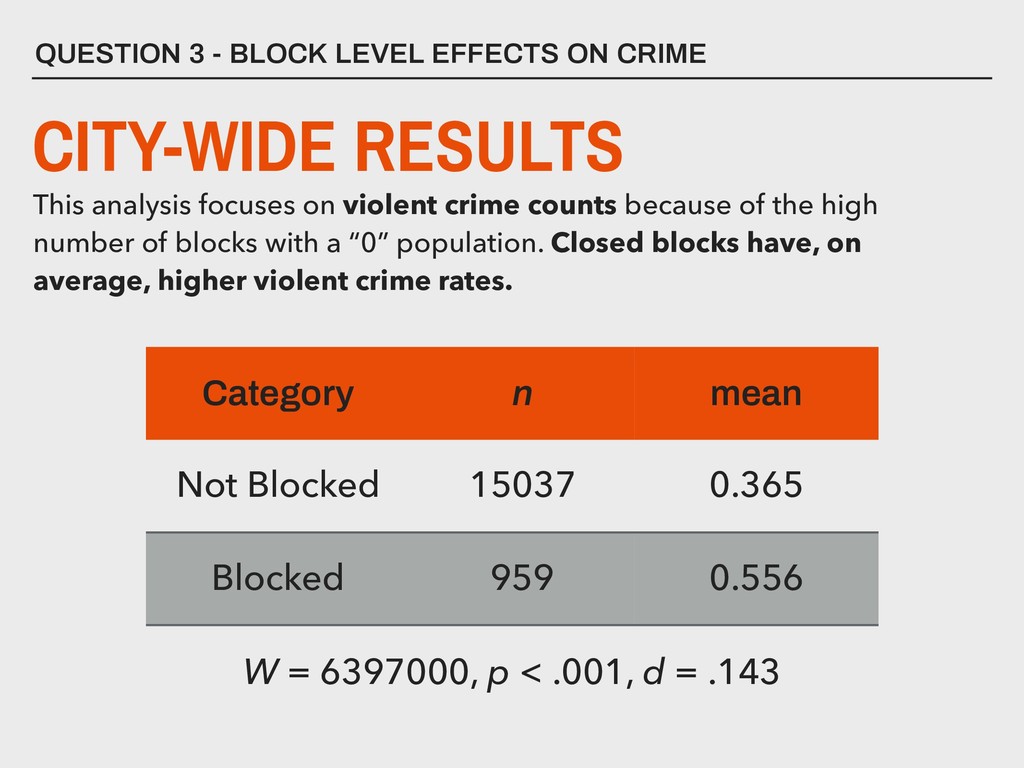
This analysis focuses on violent crime counts because of the high number of blocks with a “0” population. Closed blocks have, on average, higher violent crime rates. Category n mean Not Blocked 15037 0.365 Blocked 959 0.556 W = 6397000, p < .001, d = .143
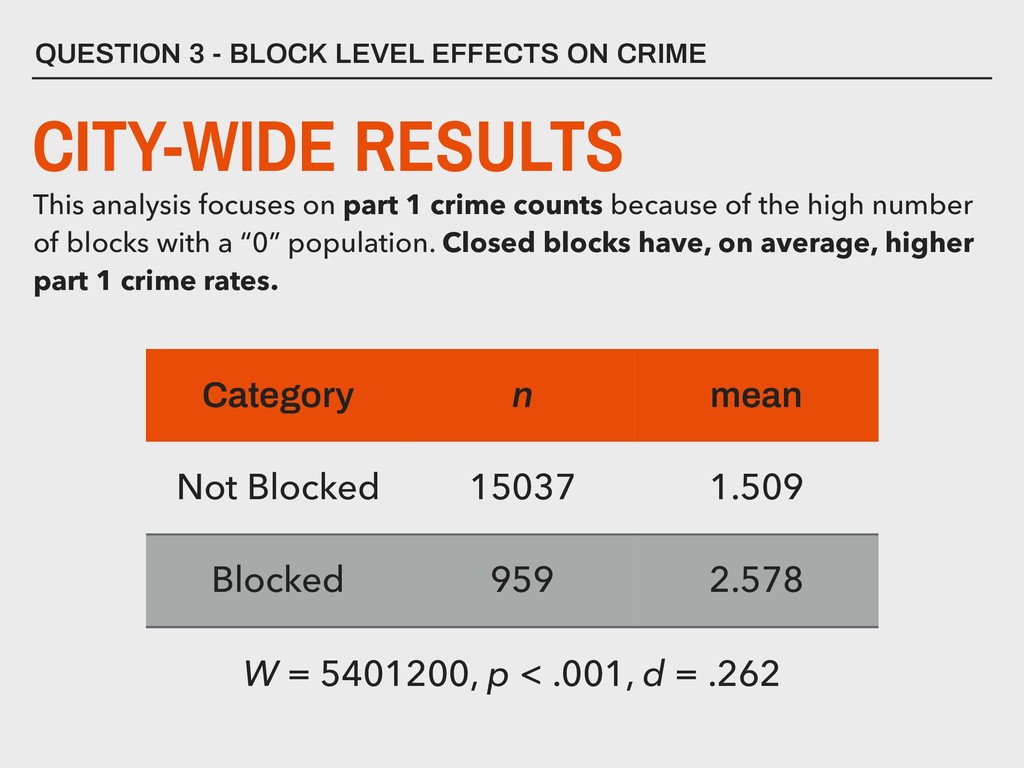
This analysis focuses on part 1 crime counts because of the high number of blocks with a “0” population. Closed blocks have, on average, higher part 1 crime rates. Category n mean Not Blocked 15037 1.509 Blocked 959 2.578 W = 5401200, p < .001, d = .262
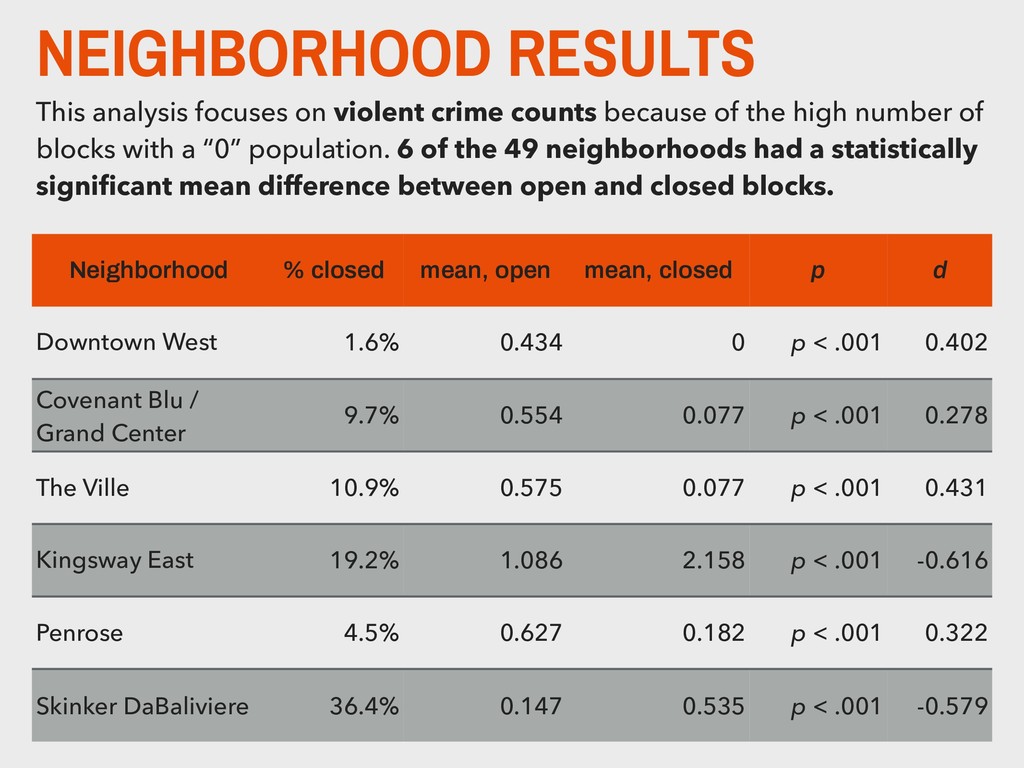
of the high number of blocks with a “0” population. 6 of the 49 neighborhoods had a statistically significant mean difference between open and closed blocks. Neighborhood % closed mean, open mean, closed p d Downtown West 1.6% 0.434 0 p < .001 0.402 Covenant Blu / Grand Center 9.7% 0.554 0.077 p < .001 0.278 The Ville 10.9% 0.575 0.077 p < .001 0.431 Kingsway East 19.2% 1.086 2.158 p < .001 -0.616 Penrose 4.5% 0.627 0.182 p < .001 0.322 Skinker DaBaliviere 36.4% 0.147 0.535 p < .001 -0.579
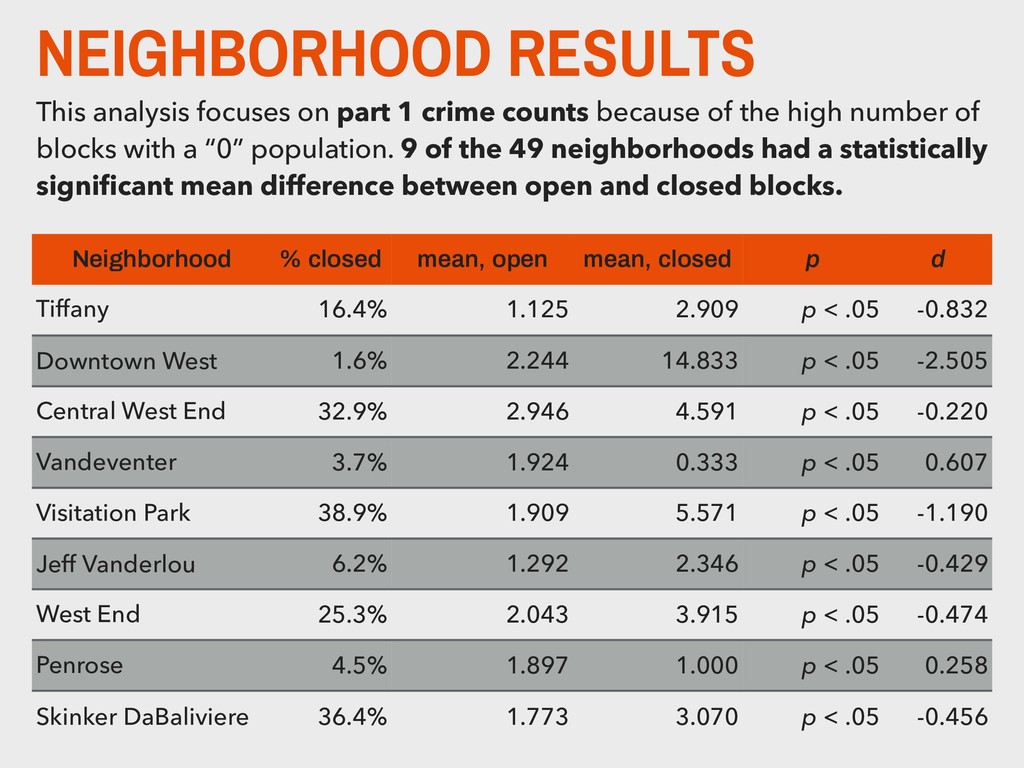
because of the high number of blocks with a “0” population. 9 of the 49 neighborhoods had a statistically significant mean difference between open and closed blocks. Neighborhood % closed mean, open mean, closed p d Tiffany 16.4% 1.125 2.909 p < .05 -0.832 Downtown West 1.6% 2.244 14.833 p < .05 -2.505 Central West End 32.9% 2.946 4.591 p < .05 -0.220 Vandeventer 3.7% 1.924 0.333 p < .05 0.607 Visitation Park 38.9% 1.909 5.571 p < .05 -1.190 Jeff Vanderlou 6.2% 1.292 2.346 p < .05 -0.429 West End 25.3% 2.043 3.915 p < .05 -0.474 Penrose 4.5% 1.897 1.000 p < .05 0.258 Skinker DaBaliviere 36.4% 1.773 3.070 p < .05 -0.456
FOR COMING! Caution Text You can find out more about our project and download our data on the locations of all known barriers at: https://chris-prener.github.io/barriers/ [email protected] https://chris-prener.github.io , :