Slides for Lecture 06 of the Saint Louis University Course Introduction to GIS. These slides introduce map layout construction techniques using R and ArcGIS.
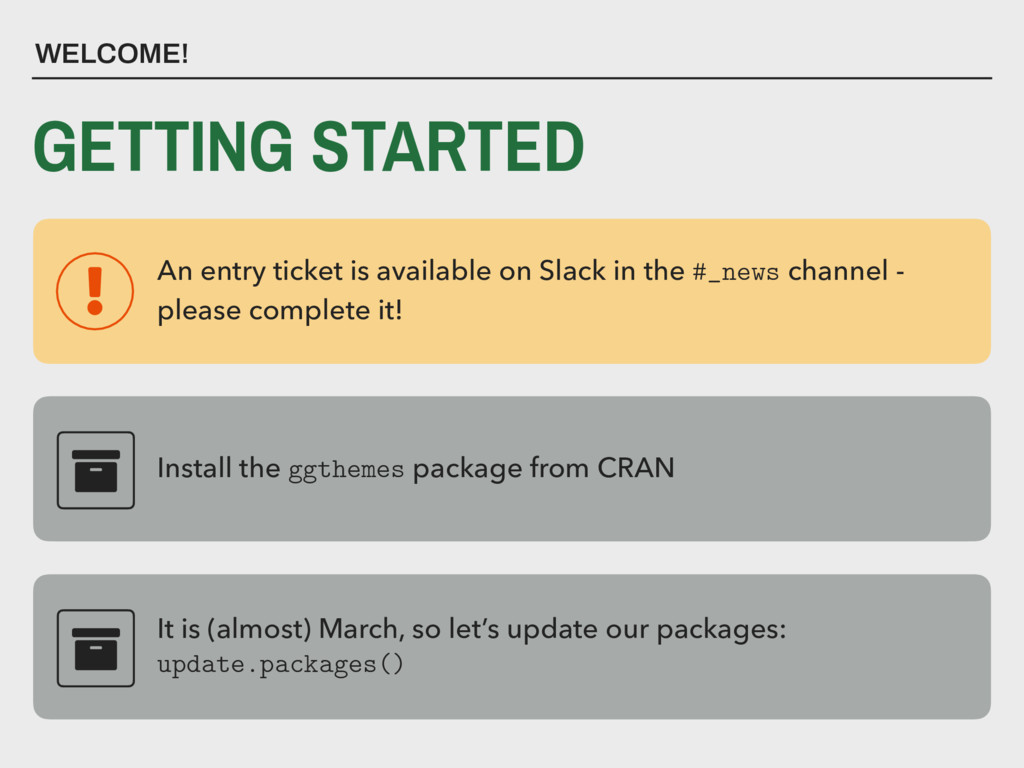
channel - please complete it! It is (almost) March, so let’s update our packages: update.packages() WELCOME! GETTING STARTED Install the ggthemes package from CRAN
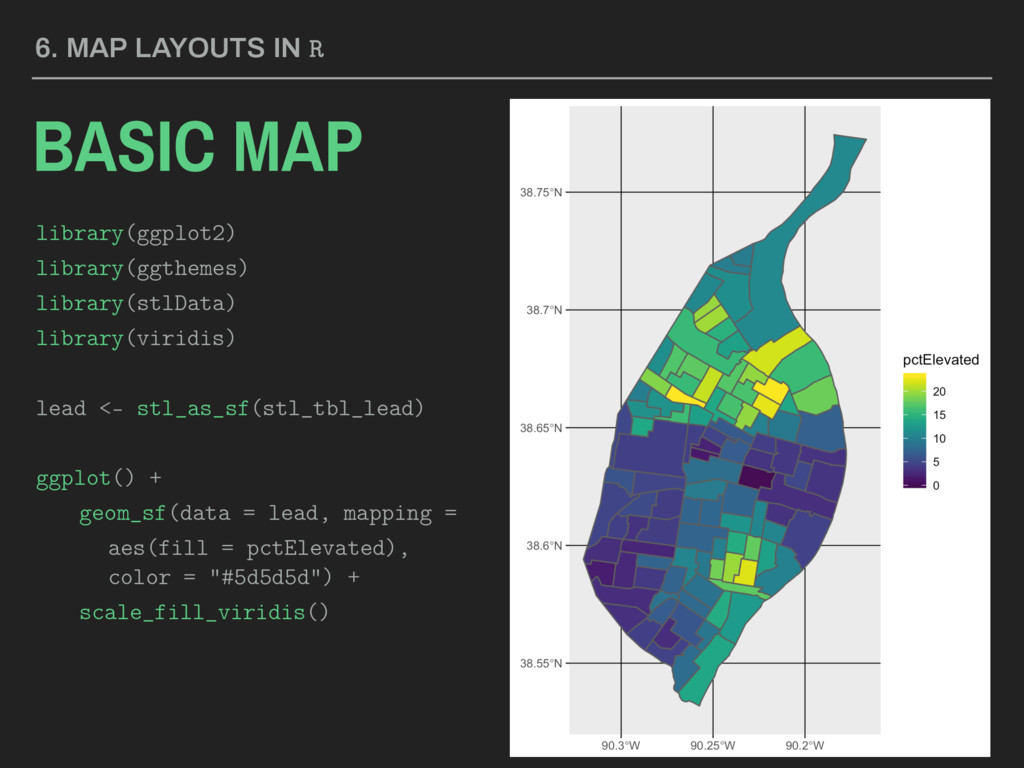
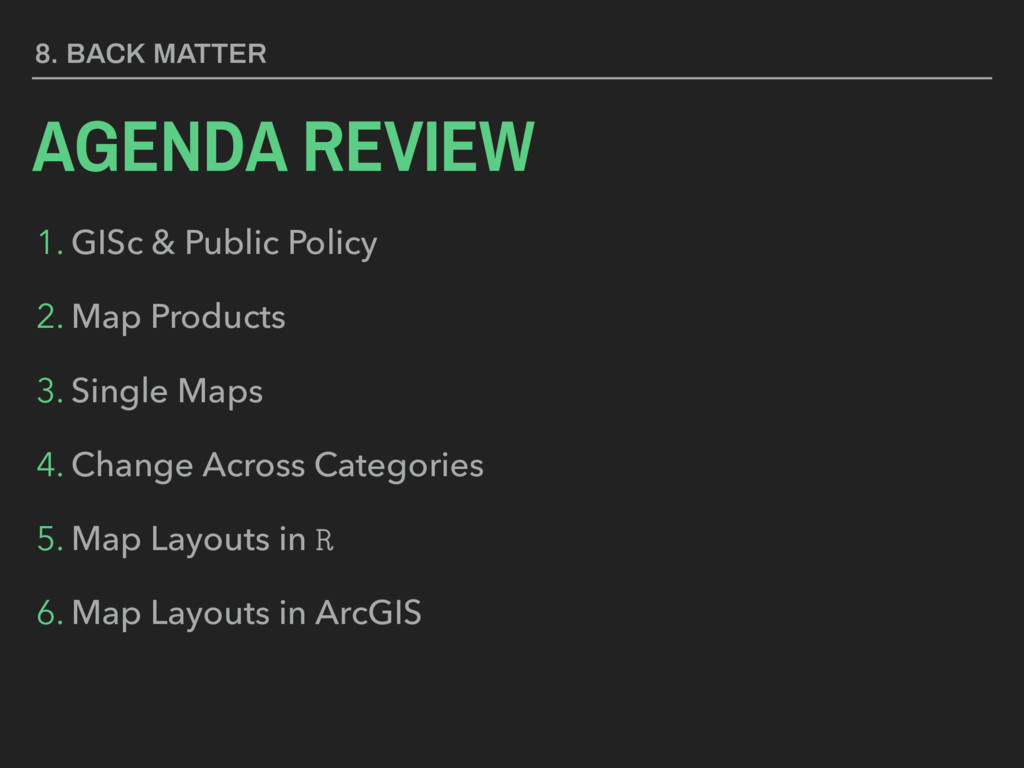
Map Products 4. Single Maps 5. Change Across Categories 6. Map Layouts in R INTRO TO GISC / WEEK 07 / LECTURE 06 7. Map Layouts in ArcGIS 8. Back Matter
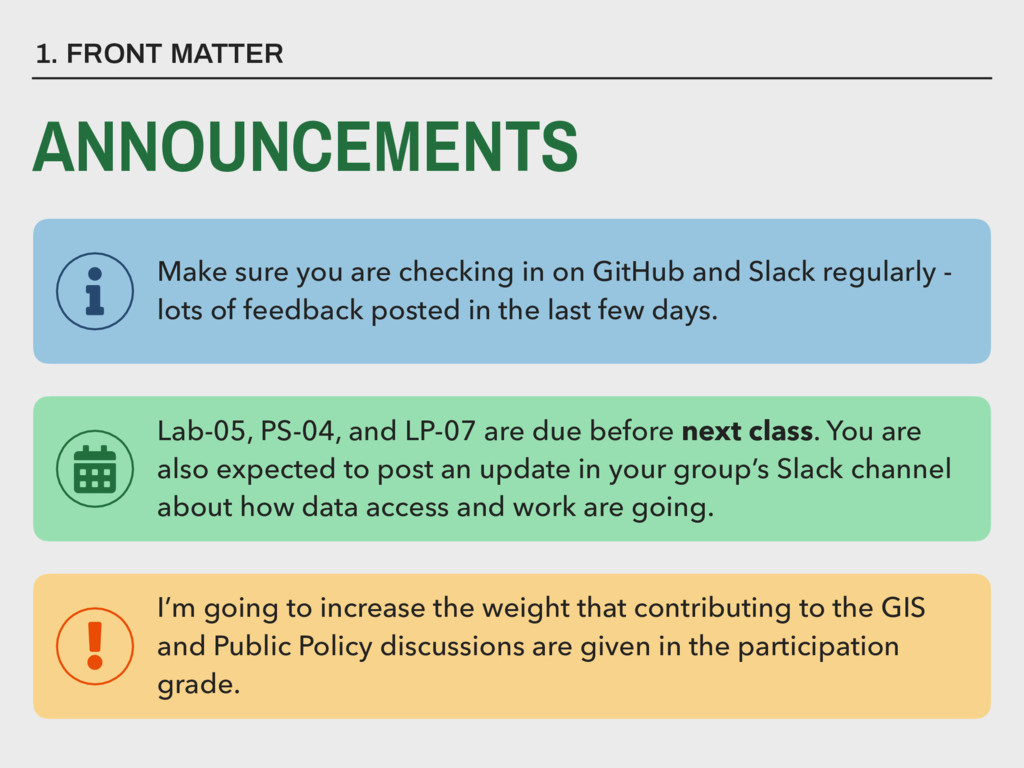
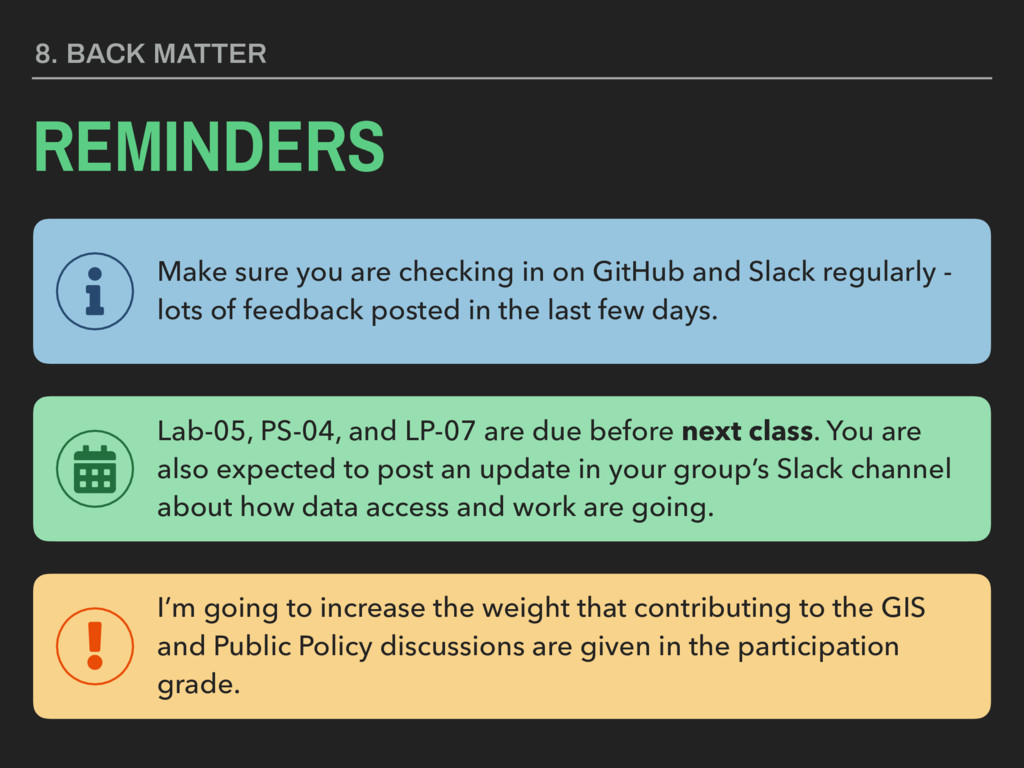
before next class. You are also expected to post an update in your group’s Slack channel about how data access and work are going. I’m going to increase the weight that contributing to the GIS and Public Policy discussions are given in the participation grade. Make sure you are checking in on GitHub and Slack regularly - lots of feedback posted in the last few days.
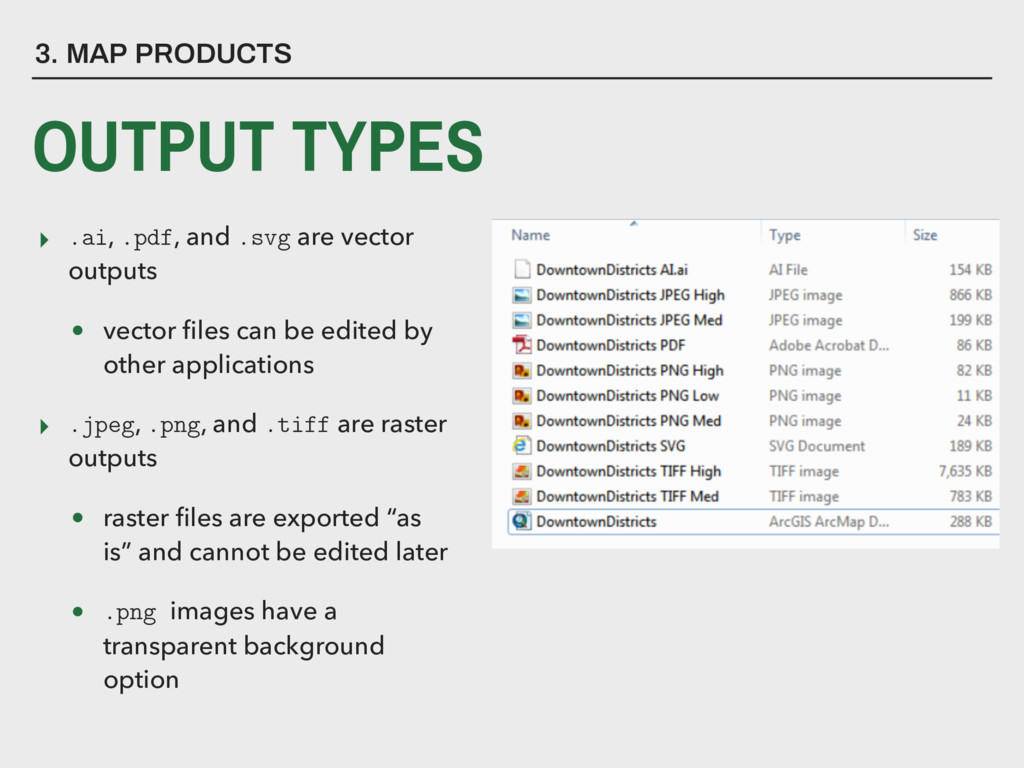
files can be edited by other applications ▸ .jpeg, .png, and .tiff are raster outputs • raster files are exported “as is” and cannot be edited later • .png images have a transparent background option 3. MAP PRODUCTS OUTPUT TYPES
in ArcMap ▸ Use standard sizes (8.5” x 11”, legal, 11”x17”) ▸ Can also use custom sizes like 3’ x 3’ or larger for wall maps with access to a large-format printer ▸ Export as .pdf from Arc with at least 300 dots per inch resolution
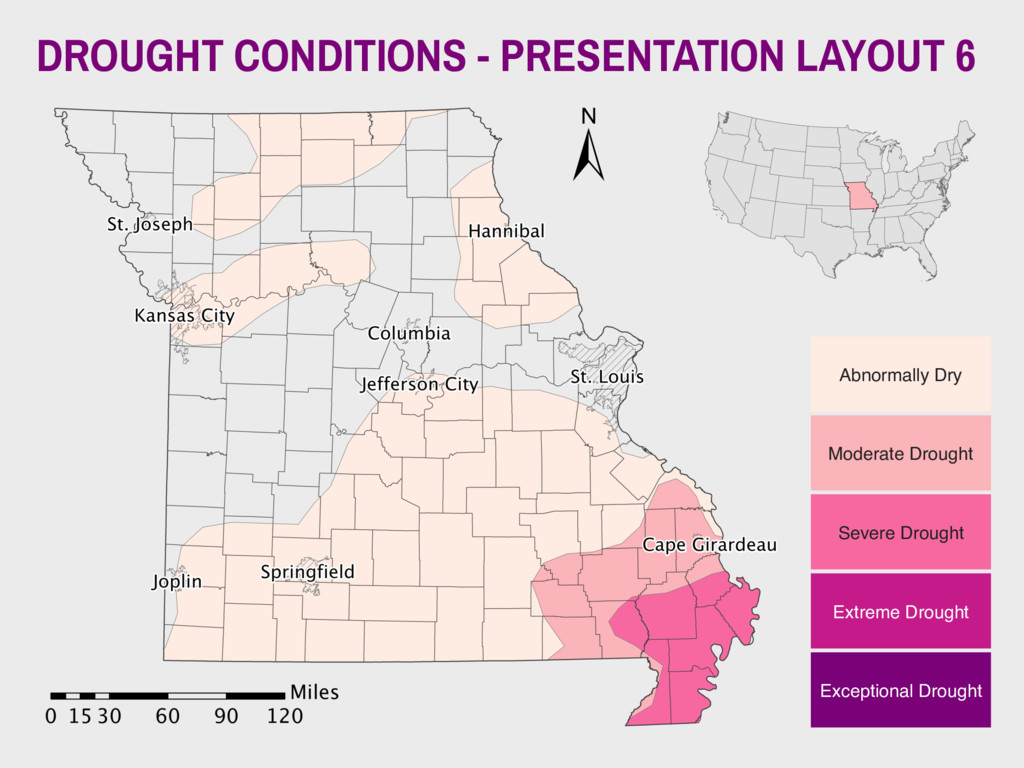
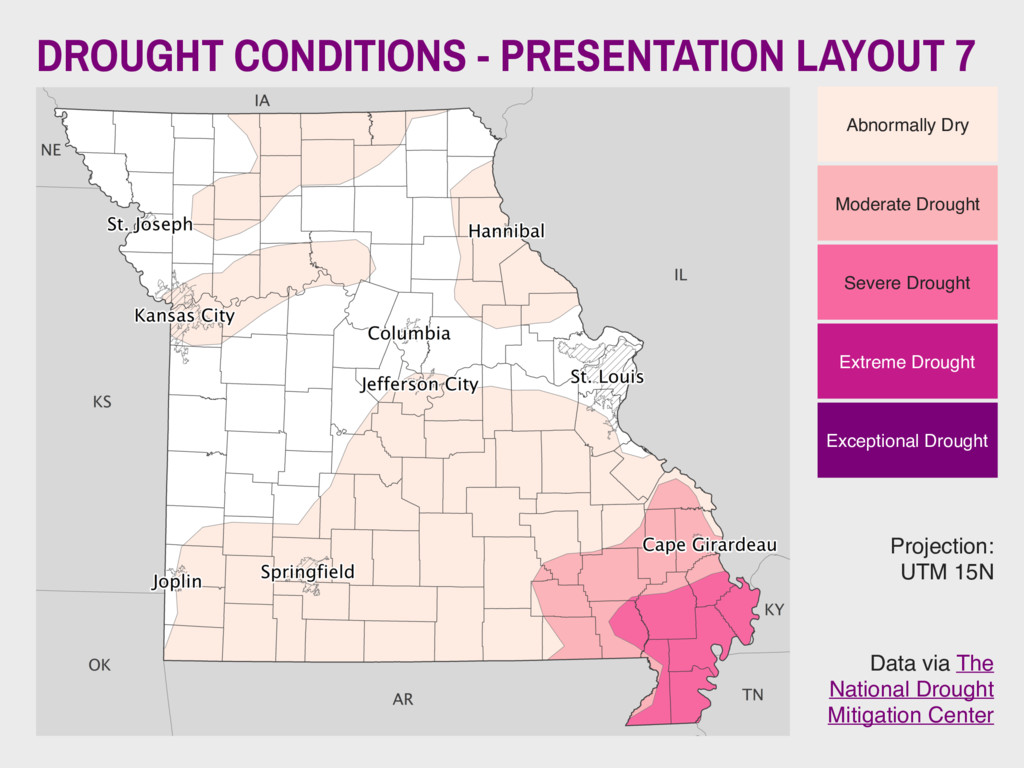
Only design what is necessary in ArcMap ▸ Can size layout space to your slides: - 4:3 slide size (ideal for printing) - 1024 by 768 points - 16:9 slide size (widescreen) - 1280 by 720 points ▸ Export as .png from Arc with at least 300 dots per inch resolution ▸ Set background of export image to match your slide background
design what is necessary in ArcMap ▸ Wire frame - draw a rectangular box on the slide that covers the area you wish the map to take up. Identify its dimensions, and size the layout space accordingly. ▸ Think carefully about font size - generally nothing less than ~24 point (though this varies by font family) ▸ Less is more when it comes to data, labels, and ground layers
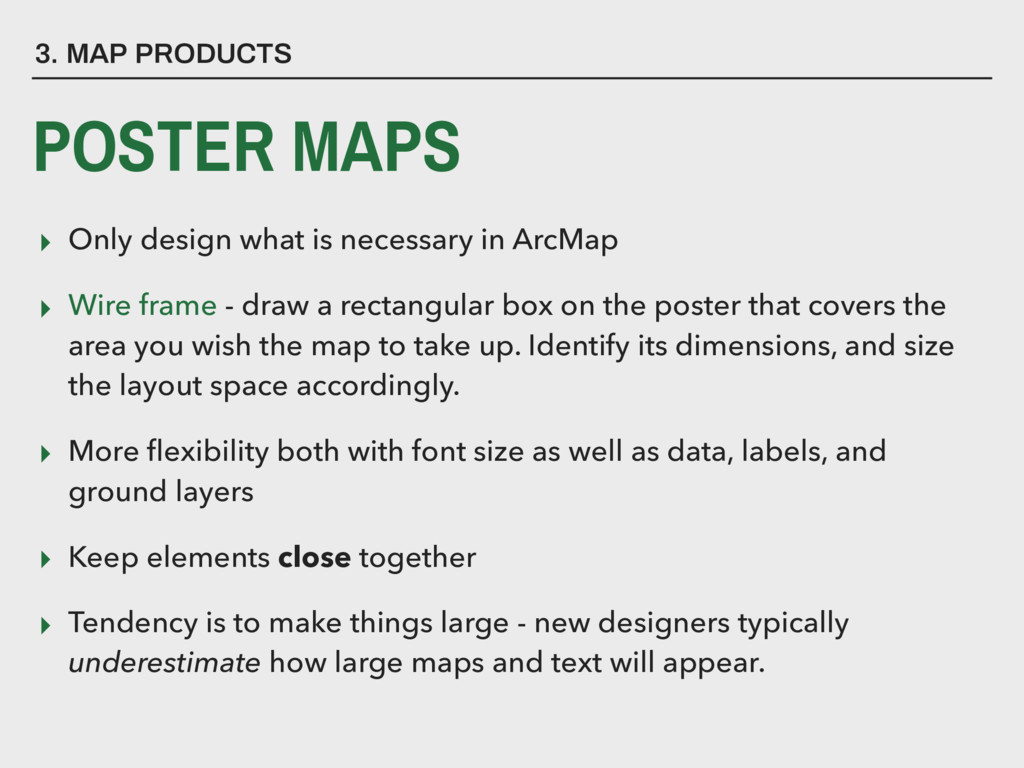
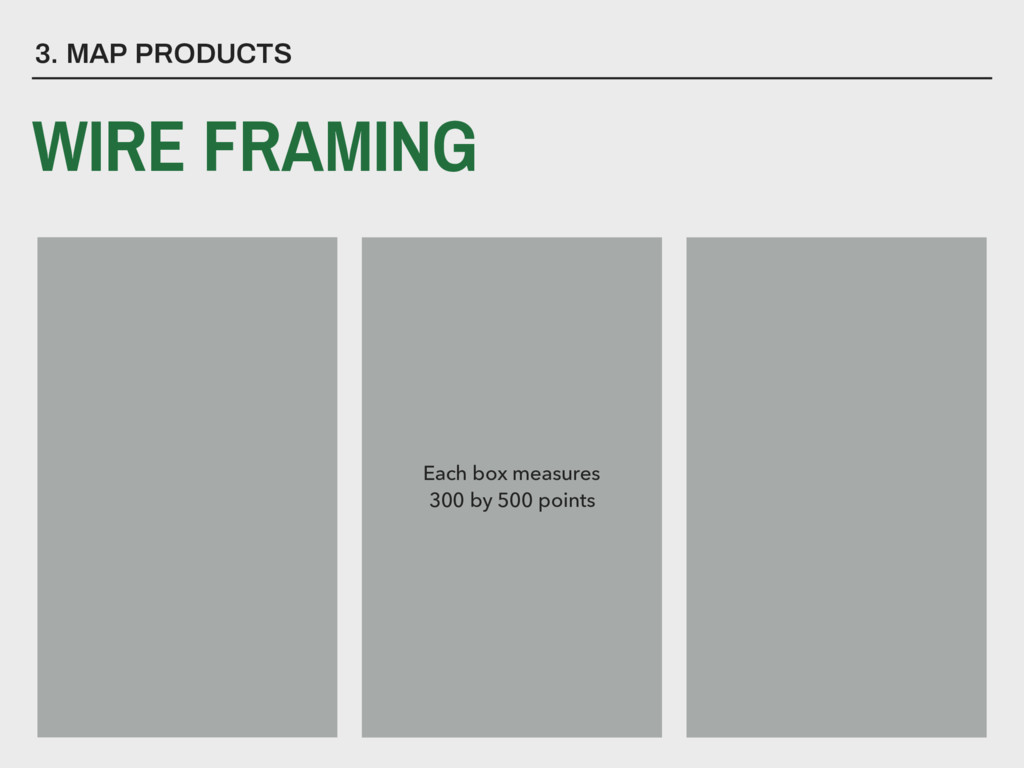
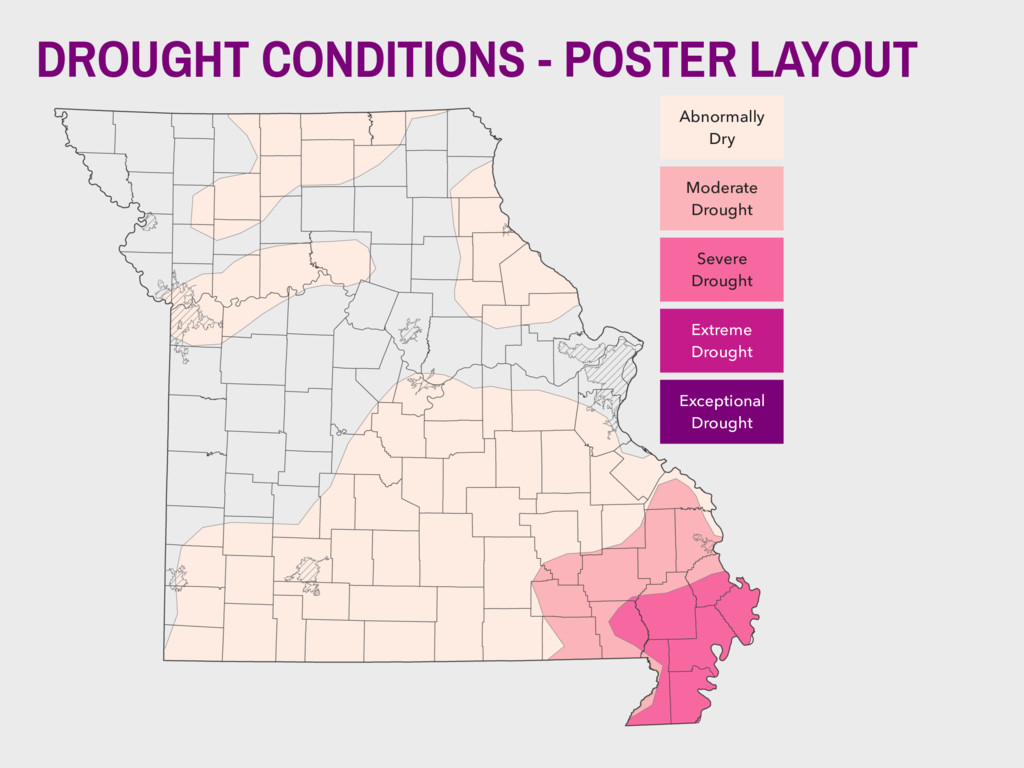
necessary in ArcMap ▸ Wire frame - draw a rectangular box on the poster that covers the area you wish the map to take up. Identify its dimensions, and size the layout space accordingly. ▸ More flexibility both with font size as well as data, labels, and ground layers ▸ Keep elements close together ▸ Tendency is to make things large - new designers typically underestimate how large maps and text will appear.
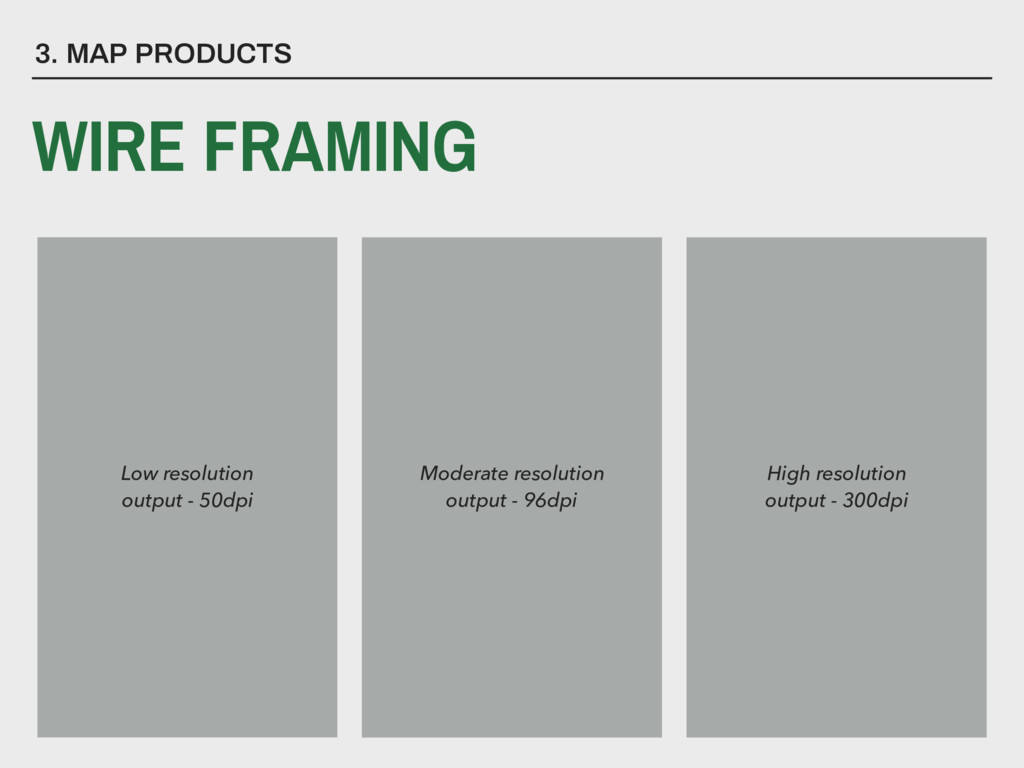
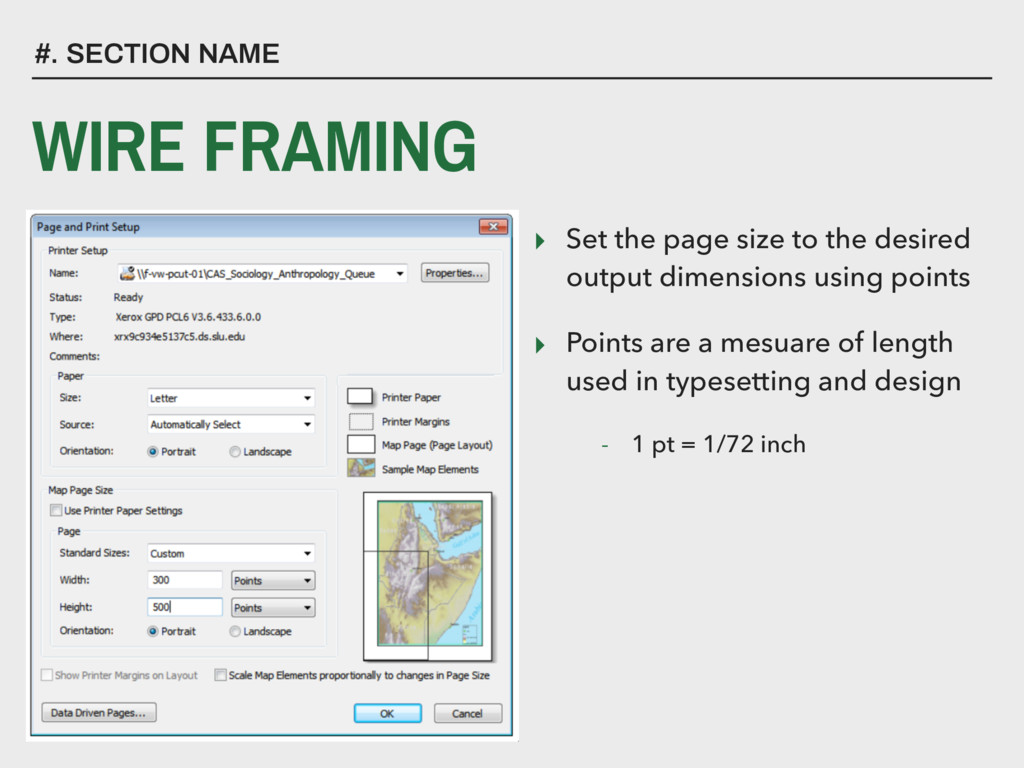
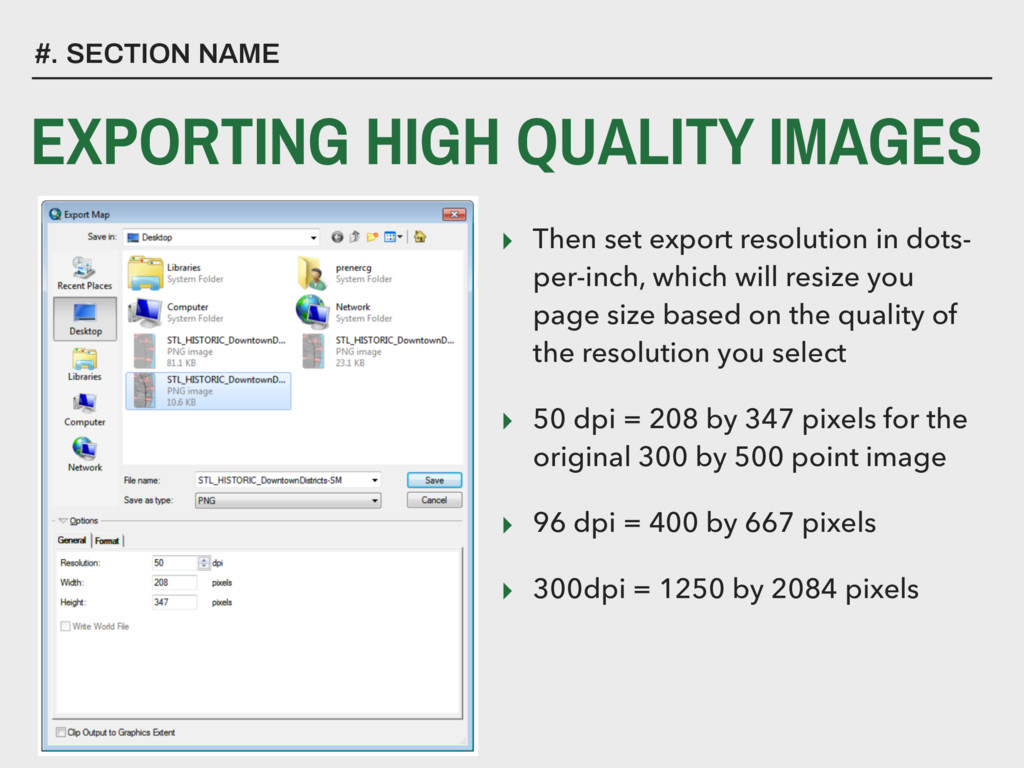
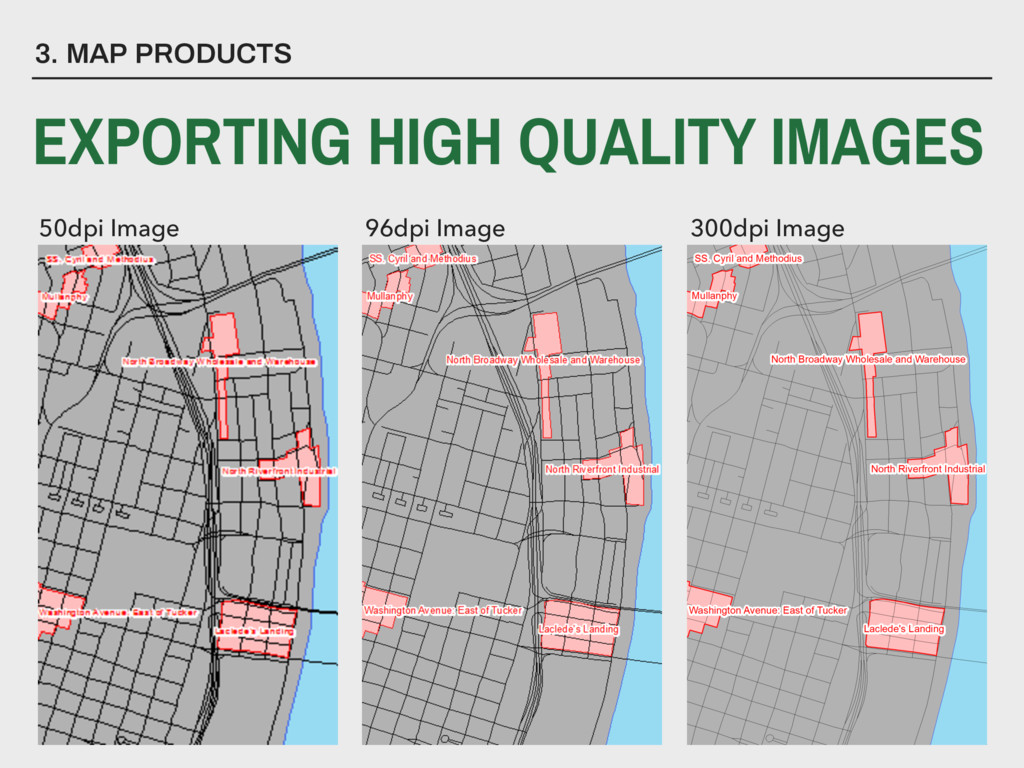
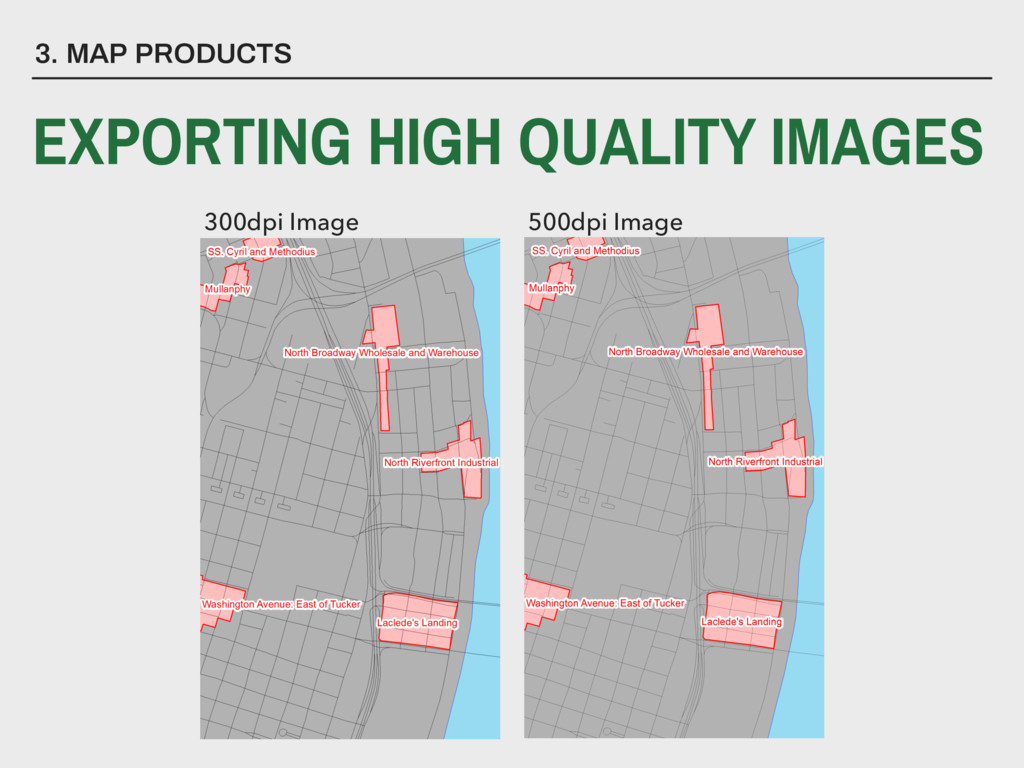
resize you page size based on the quality of the resolution you select ▸ 50 dpi = 208 by 347 pixels for the original 300 by 500 point image ▸ 96 dpi = 400 by 667 pixels ▸ 300dpi = 1250 by 2084 pixels #. SECTION NAME EXPORTING HIGH QUALITY IMAGES
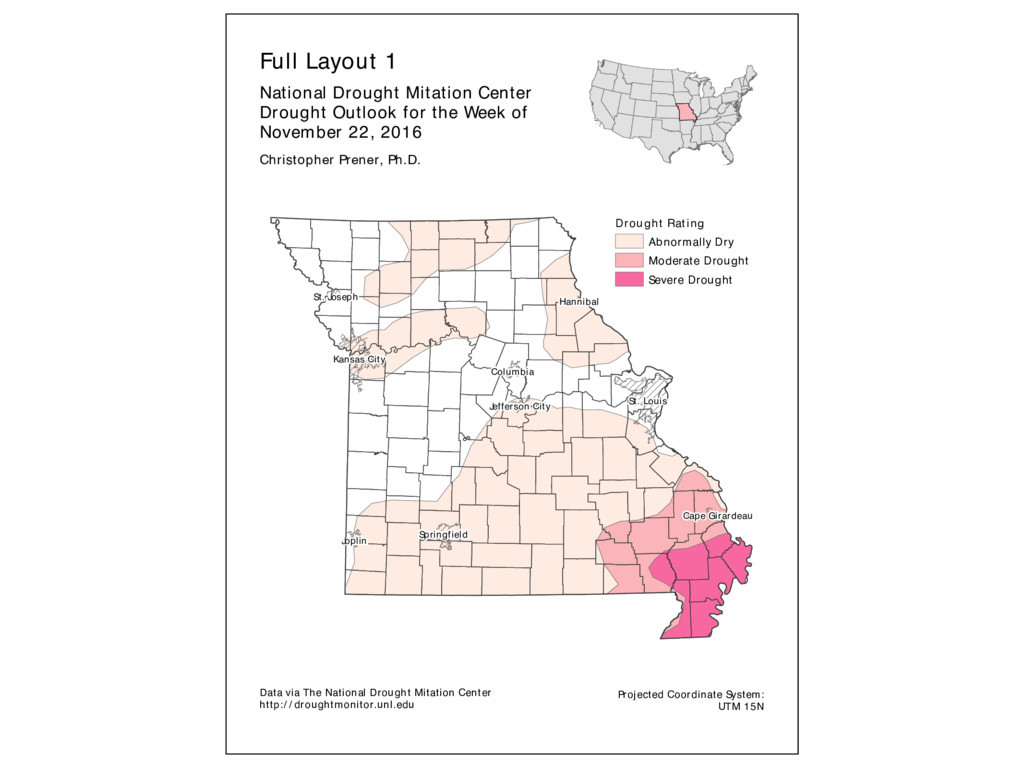
City Cape Girardeau Hannibal Drought Rating Abnormally Dry Moderate Drought Severe Drought Full Layout 1 National Drought Mitation Center Drought Outlook for the Week of November 22, 2016 Data via The National Drought Mitation Center http:/ / droughtmonitor.unl.edu Projected Coordinate System: UTM 15N Christopher Prener, Ph.D.
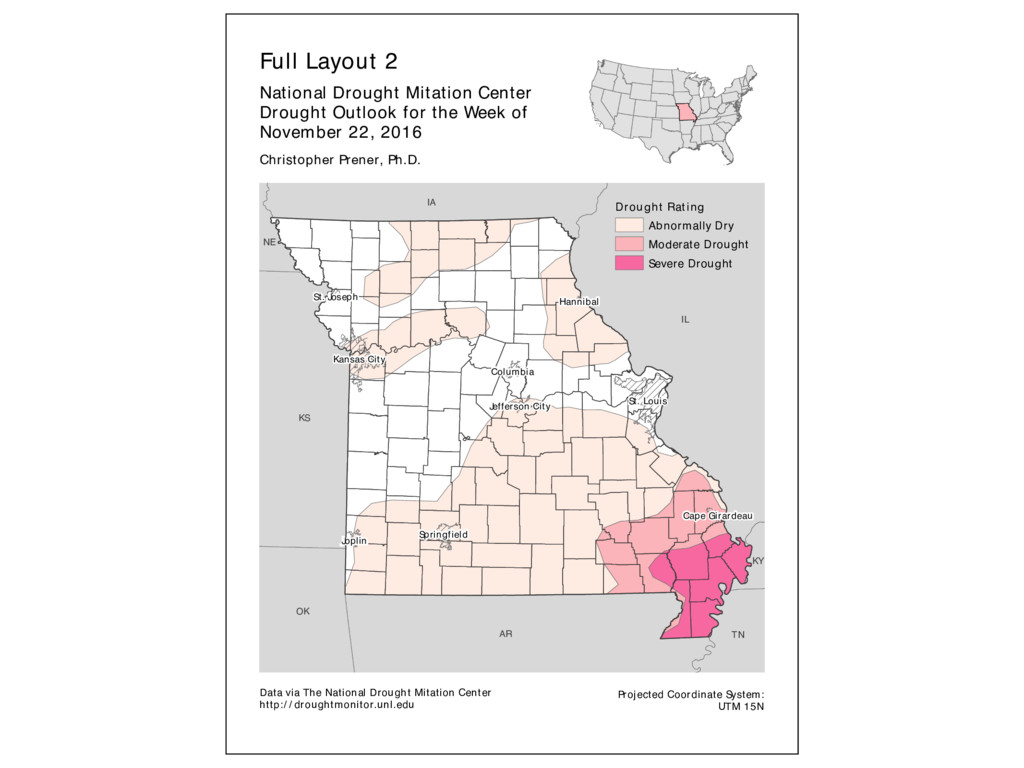
City Cape Girardeau Hannibal TN OK NE KY KS IL IA AR Drought Rating Abnormally Dry Moderate Drought Severe Drought Full Layout 2 National Drought Mitation Center Drought Outlook for the Week of November 22, 2016 Data via The National Drought Mitation Center http:/ / droughtmonitor.unl.edu Projected Coordinate System: UTM 15N Christopher Prener, Ph.D.
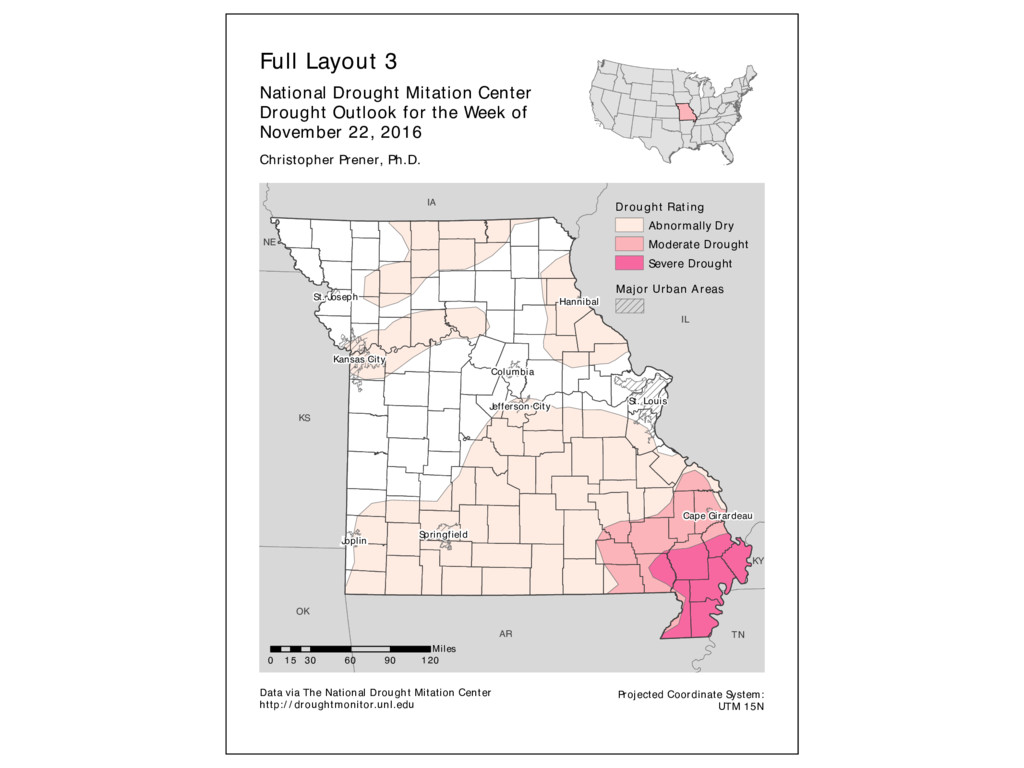
City Cape Girardeau Hannibal TN OK NE KY KS IL IA AR Drought Rating Abnormally Dry Moderate Drought Severe Drought Full Layout 3 National Drought Mitation Center Drought Outlook for the Week of November 22, 2016 Data via The National Drought Mitation Center http:/ / droughtmonitor.unl.edu Projected Coordinate System: UTM 15N Christopher Prener, Ph.D. Major Urban Areas 0 30 60 90 120 15 Miles
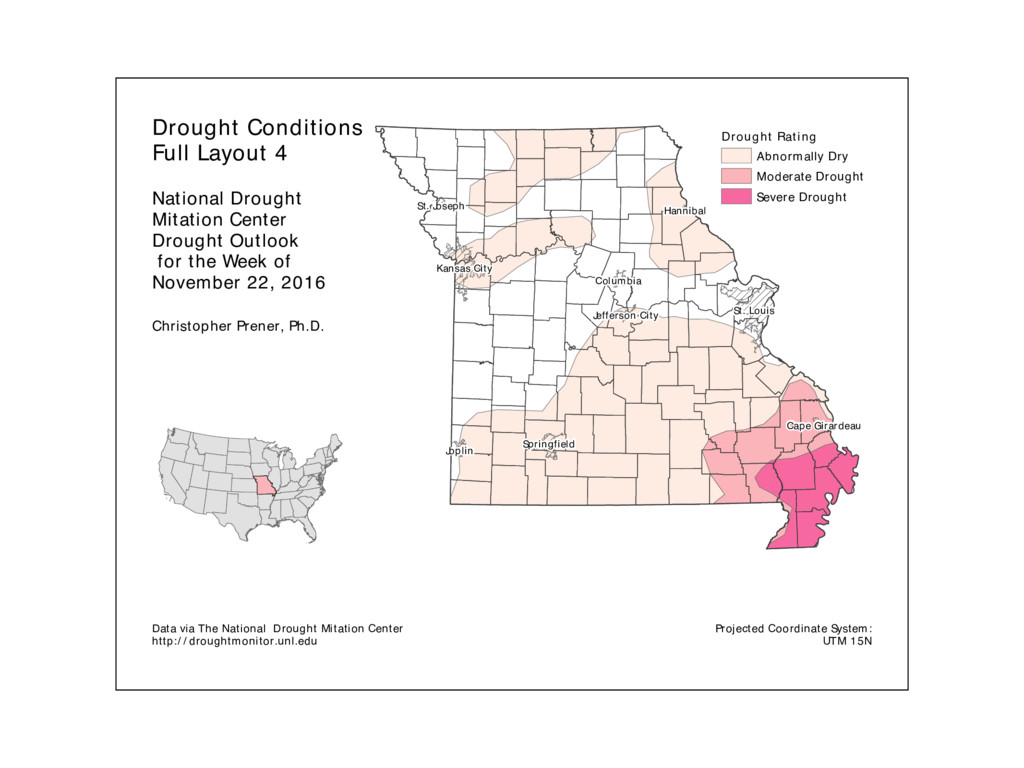
City Cape Girardeau Hannibal Drought Rating Abnormally Dry Moderate Drought Severe Drought Drought Conditions Full Layout 4 National Drought Mitation Center Drought Outlook for the Week of November 22, 2016 Data via The National Drought Mitation Center http:/ / droughtmonitor.unl.edu Projected Coordinate System: UTM 15N Christopher Prener, Ph.D.
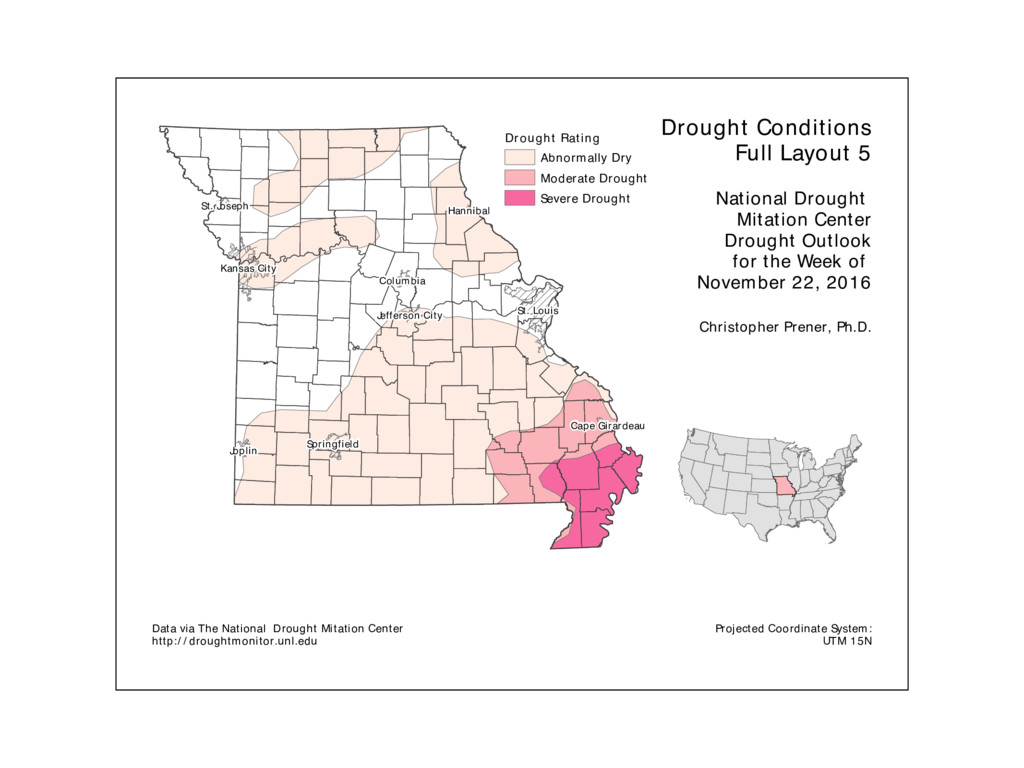
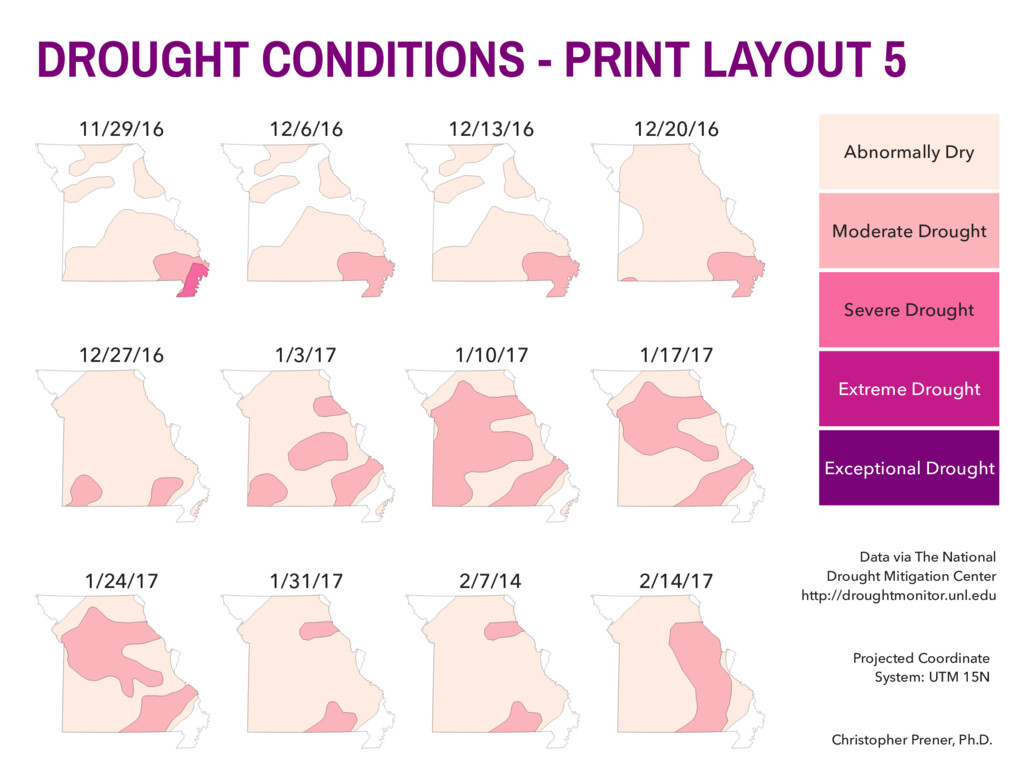
City Cape Girardeau Hannibal Drought Rating Abnormally Dry Moderate Drought Severe Drought Drought Conditions Full Layout 5 National Drought Mitation Center Drought Outlook for the Week of November 22, 2016 Data via The National Drought Mitation Center http:/ / droughtmonitor.unl.edu Projected Coordinate System: UTM 15N Christopher Prener, Ph.D.
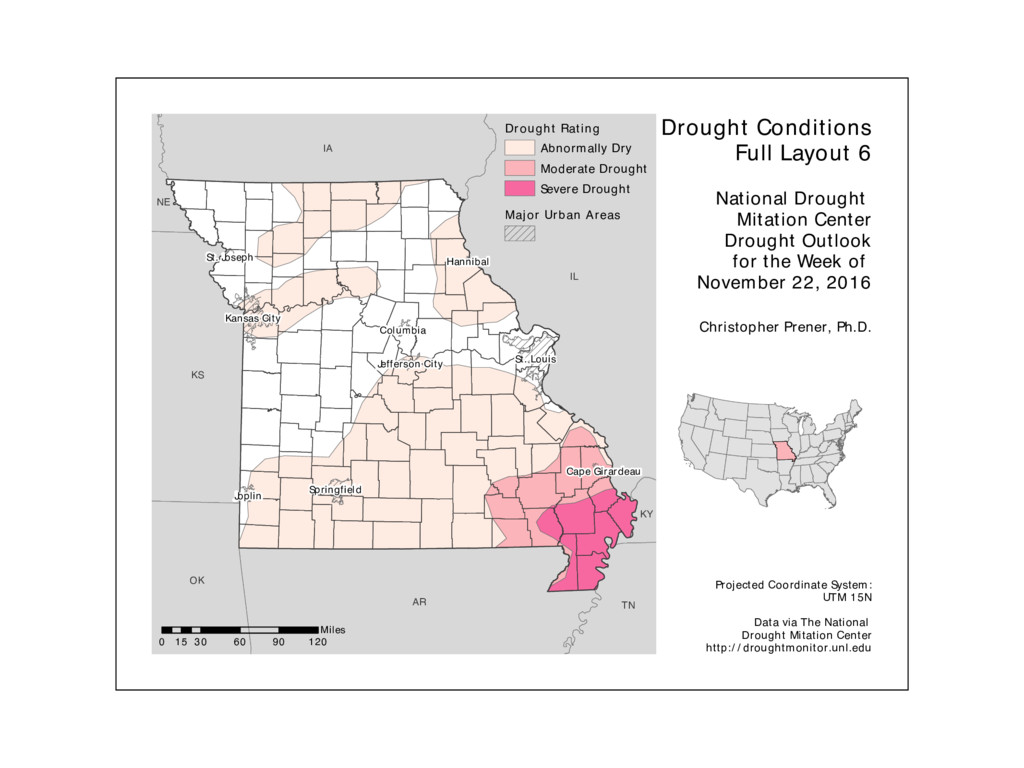
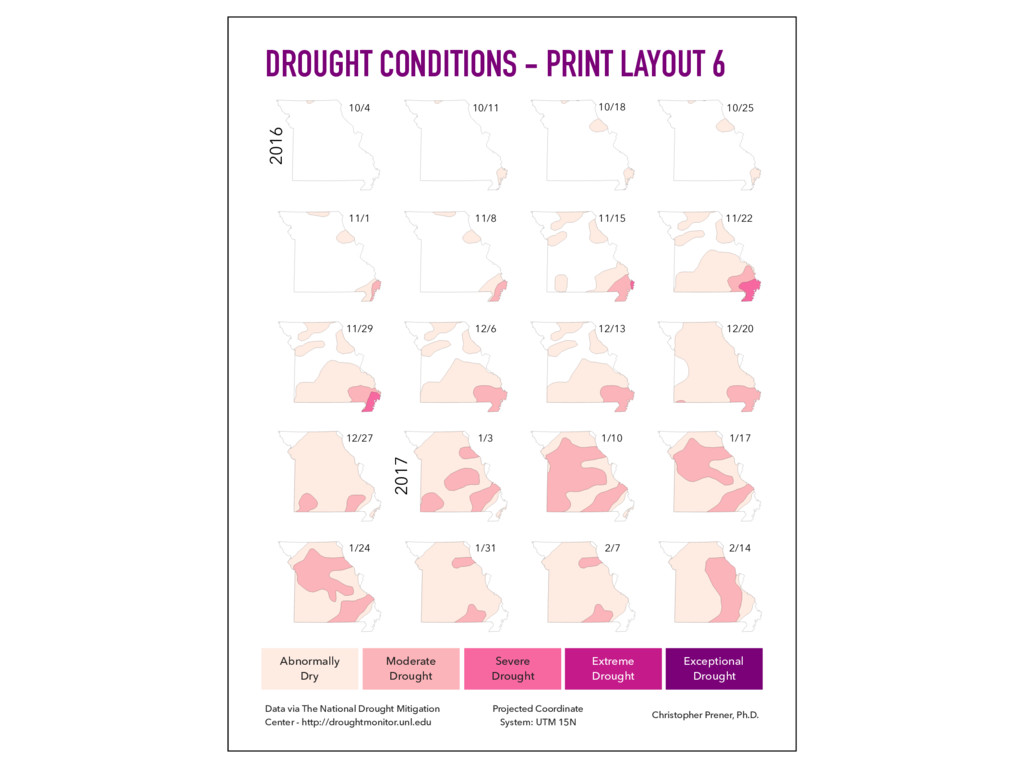
City Cape Girardeau Hannibal TN OK NE KY KS IL IA AR Drought Rating Abnormally Dry Moderate Drought Severe Drought Drought Conditions Full Layout 6 National Drought Mitation Center Drought Outlook for the Week of November 22, 2016 Data via The National Drought Mitation Center http:/ / droughtmonitor.unl.edu Projected Coordinate System: UTM 15N Christopher Prener, Ph.D. 0 30 60 90 120 15 Miles Major Urban Areas
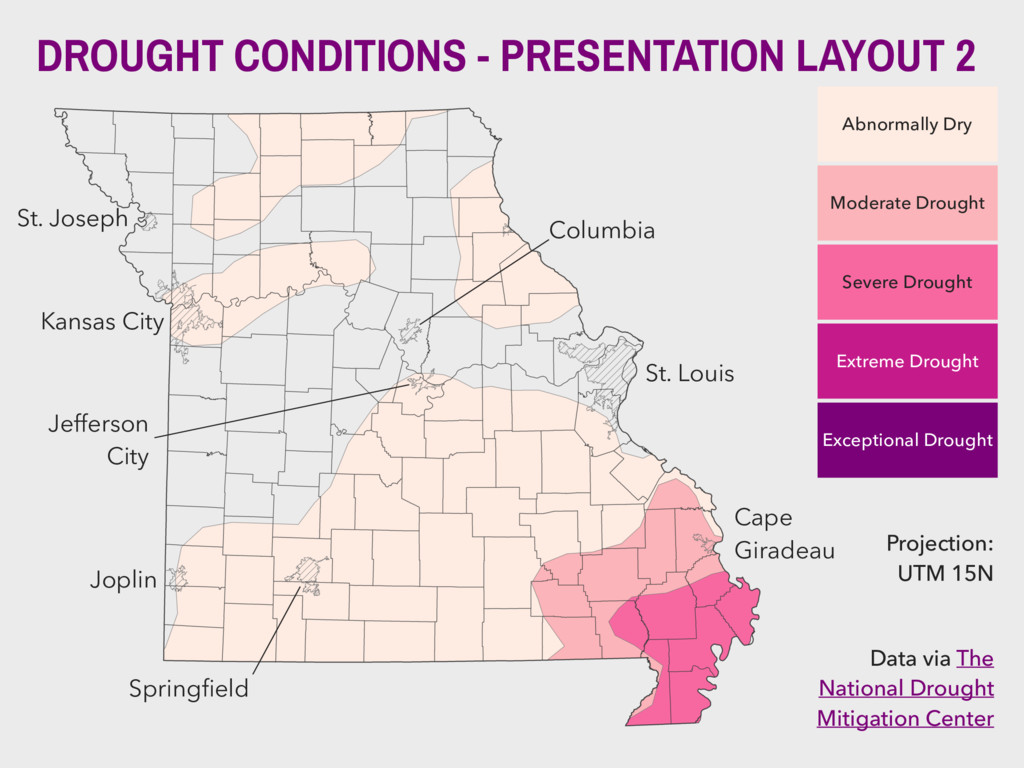
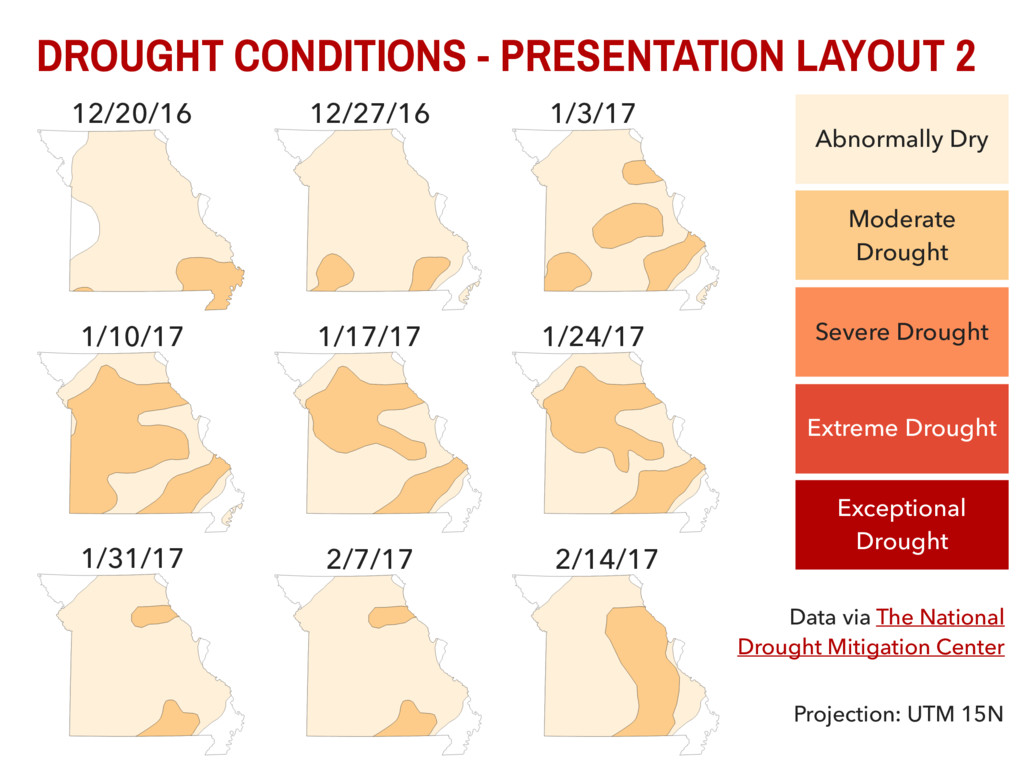
Projection: UTM 15N Data via The National Drought Mitigation Center St. Louis Cape Giradeau Joplin Kansas City St. Joseph Springfield Columbia Jefferson City DROUGHT CONDITIONS - PRESENTATION LAYOUT 2
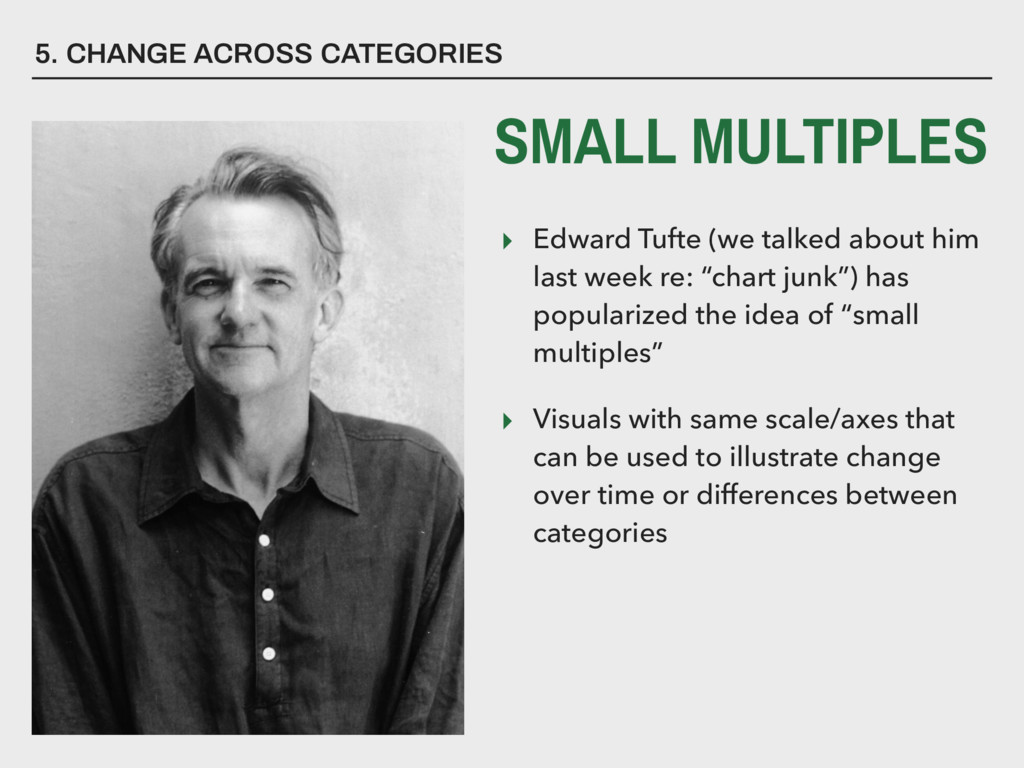
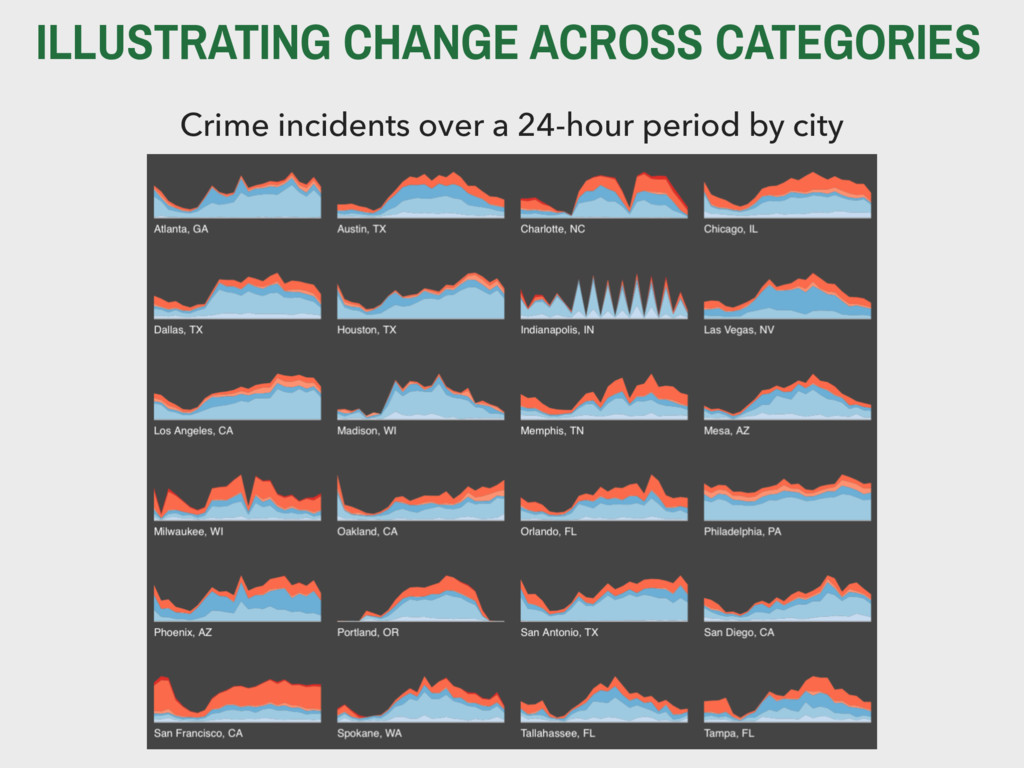
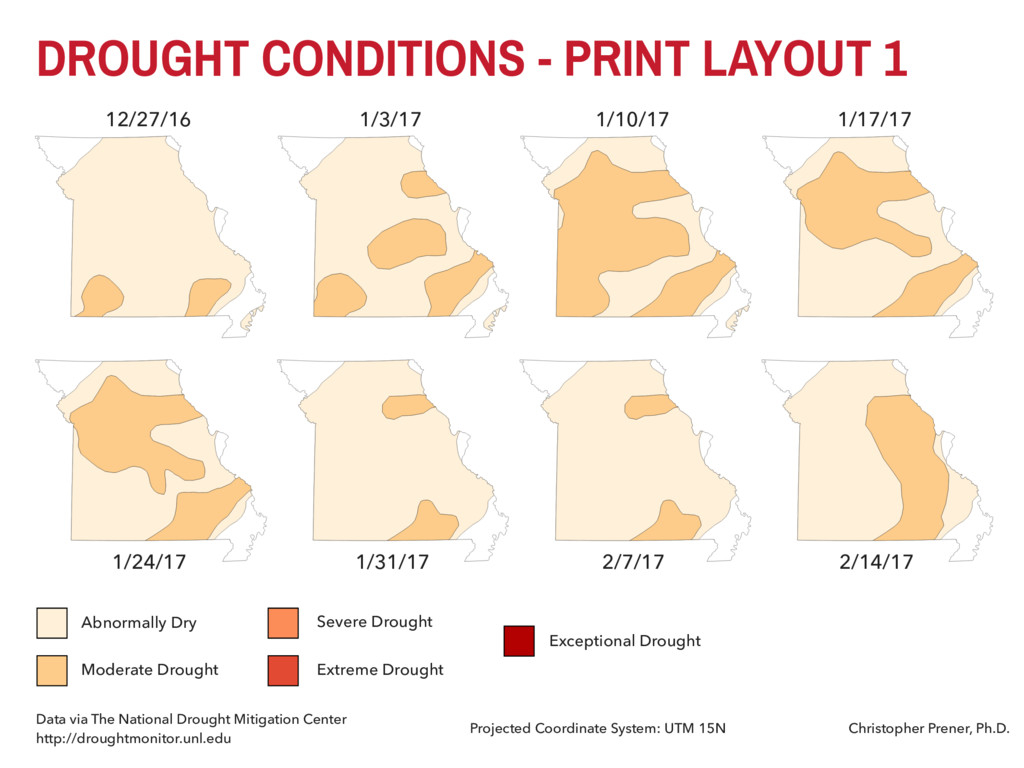
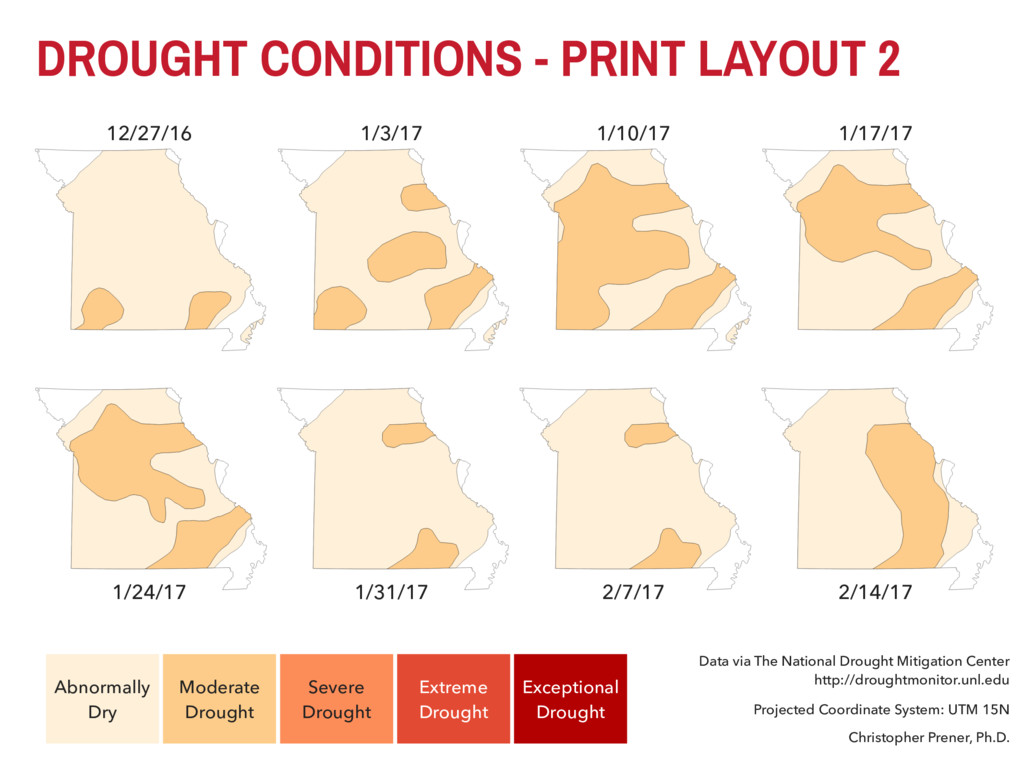
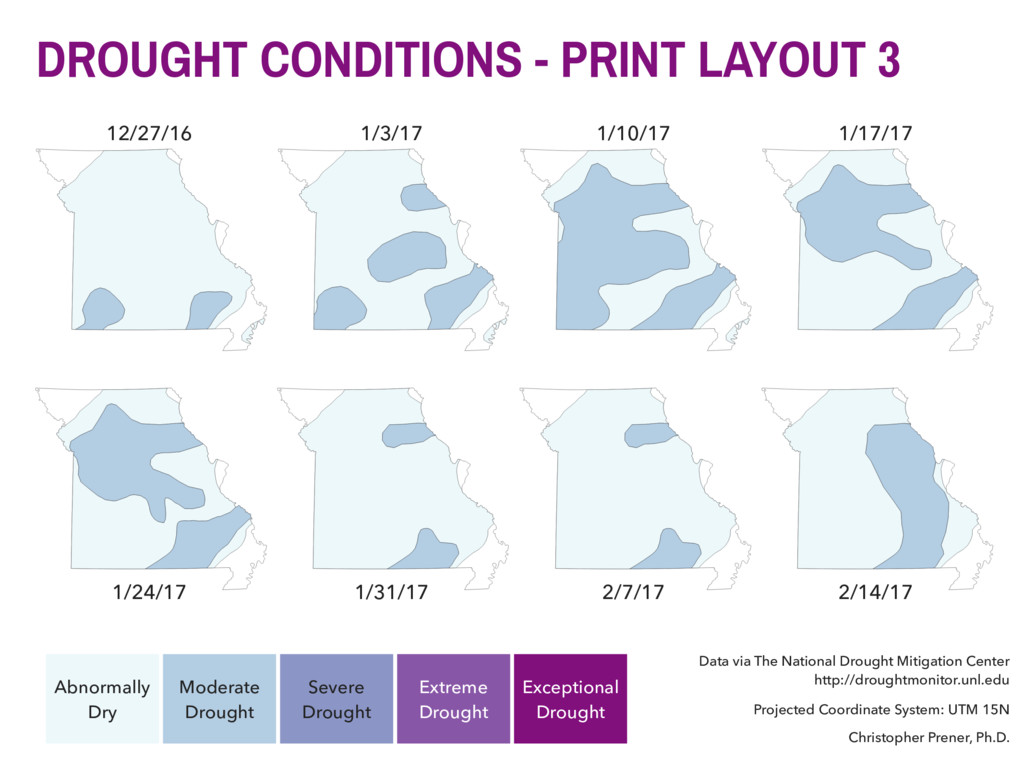
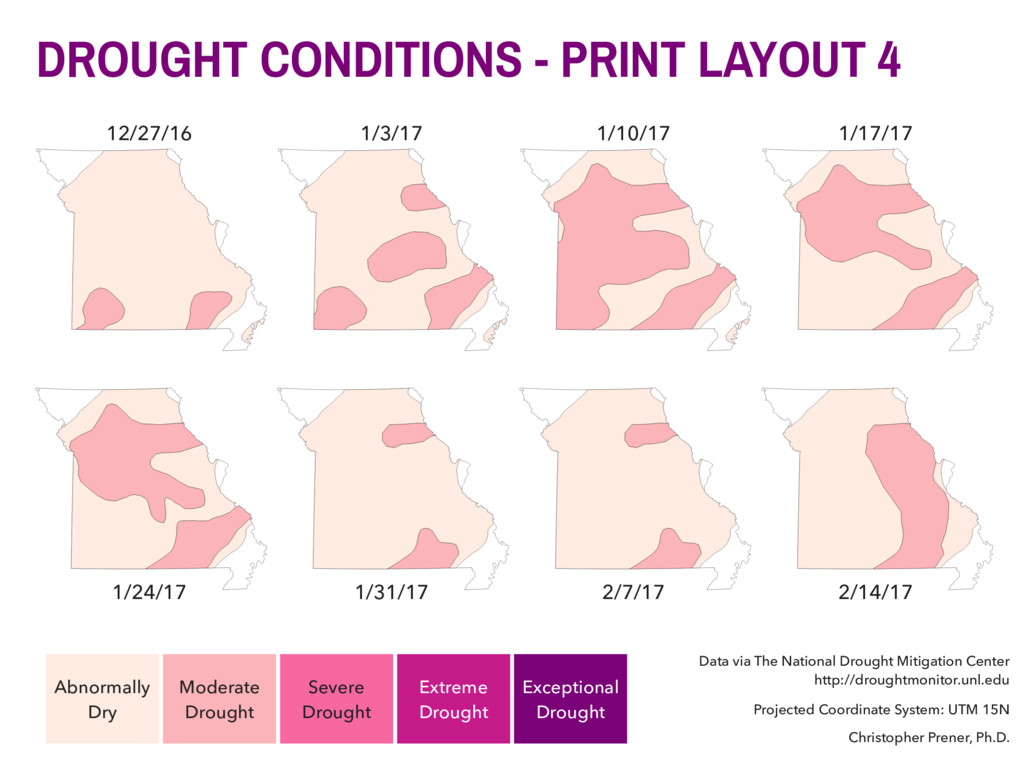
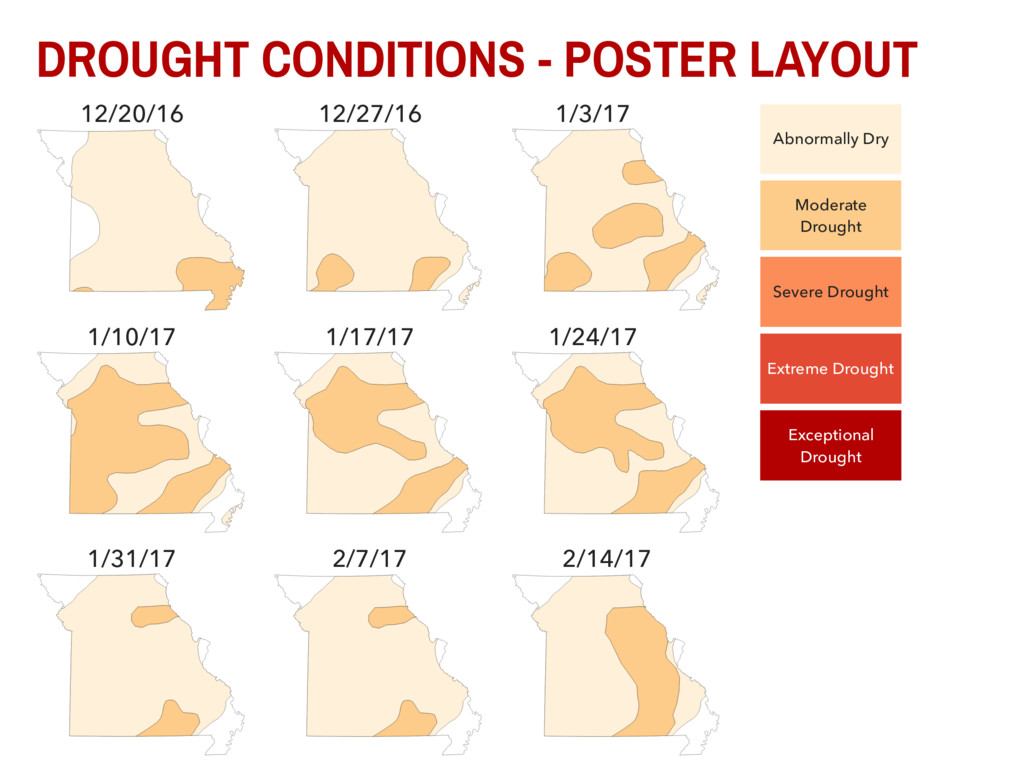
“chart junk”) has popularized the idea of “small multiples” ▸ Visuals with same scale/axes that can be used to illustrate change over time or differences between categories 5. CHANGE ACROSS CATEGORIES SMALL MULTIPLES
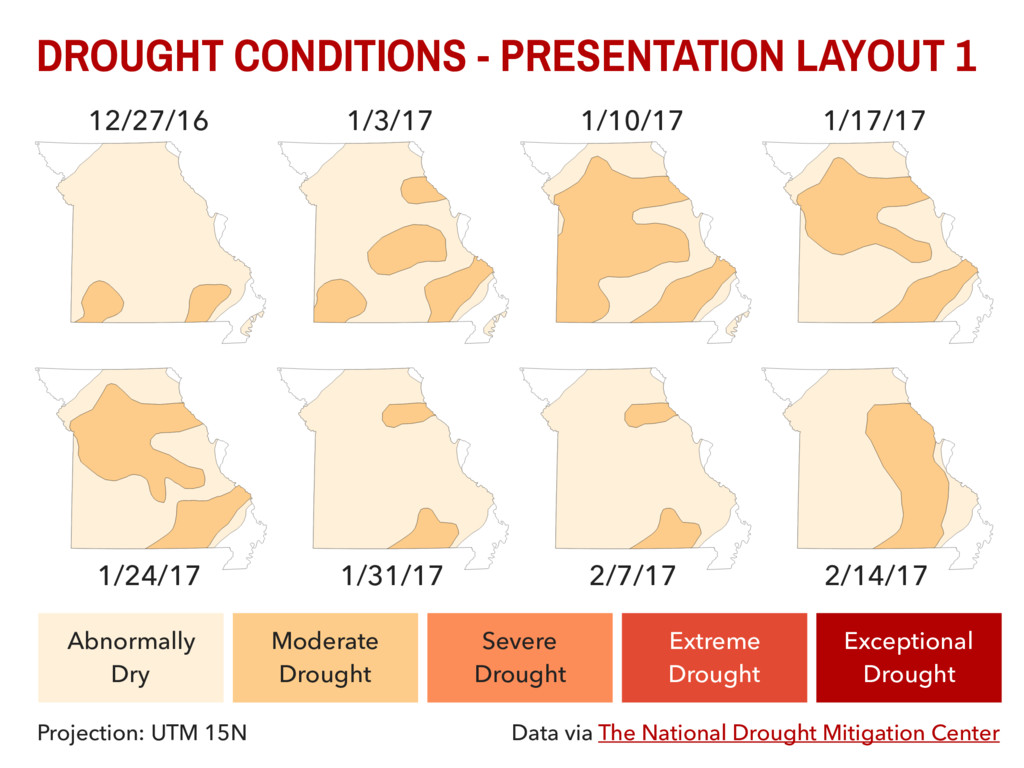
1/24/17 1/31/17 2/7/17 2/14/17 Data via The National Drought Mitigation Center http://droughtmonitor.unl.edu Projected Coordinate System: UTM 15N Christopher Prener, Ph.D. Abnormally Dry Moderate Drought Severe Drought Extreme Drought Exceptional Drought
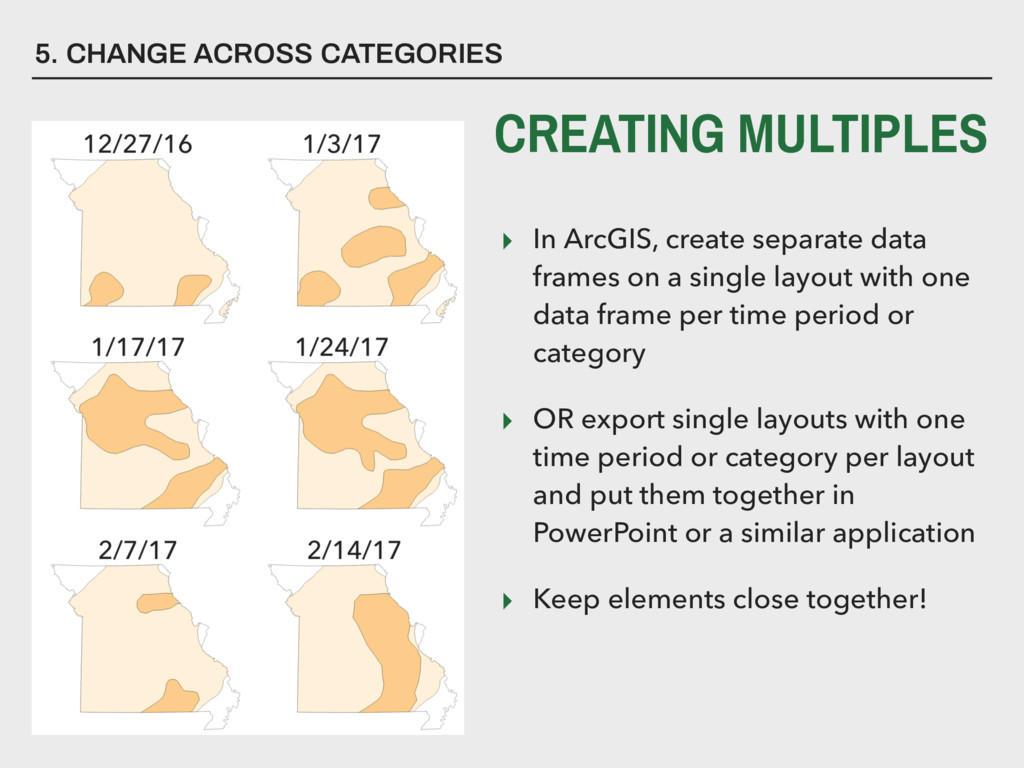
Drought Data via The National Drought Mitigation Center http://droughtmonitor.unl.edu Severe Drought Extreme Drought Exceptional Drought Projected Coordinate System: UTM 15N Christopher Prener, Ph.D. 12/27/16 1/3/17 1/10/17 1/17/17 1/24/17 1/31/17 2/7/17 2/14/17
Drought Data via The National Drought Mitigation Center http://droughtmonitor.unl.edu Severe Drought Extreme Drought Exceptional Drought Projected Coordinate System: UTM 15N Christopher Prener, Ph.D. 12/27/16 1/3/17 1/10/17 1/17/17 1/24/17 1/31/17 2/7/17 2/14/17
12/27/16 1/24/17 1/31/17 2/7/14 2/14/17 1/17/17 1/10/17 1/3/17 Abnormally Dry Moderate Drought Severe Drought Extreme Drought Exceptional Drought Data via The National Drought Mitigation Center http://droughtmonitor.unl.edu Projected Coordinate System: UTM 15N Christopher Prener, Ph.D.
1/24/17 1/31/17 2/7/17 2/14/17 Abnormally Dry Moderate Drought Data via The National Drought Mitigation Center Severe Drought Extreme Drought Exceptional Drought Projection: UTM 15N
2/14/17 Abnormally Dry Moderate Drought Severe Drought Extreme Drought Exceptional Drought Data via The National Drought Mitigation Center Projection: UTM 15N 12/27/16 1/3/17 1/10/17 12/20/16
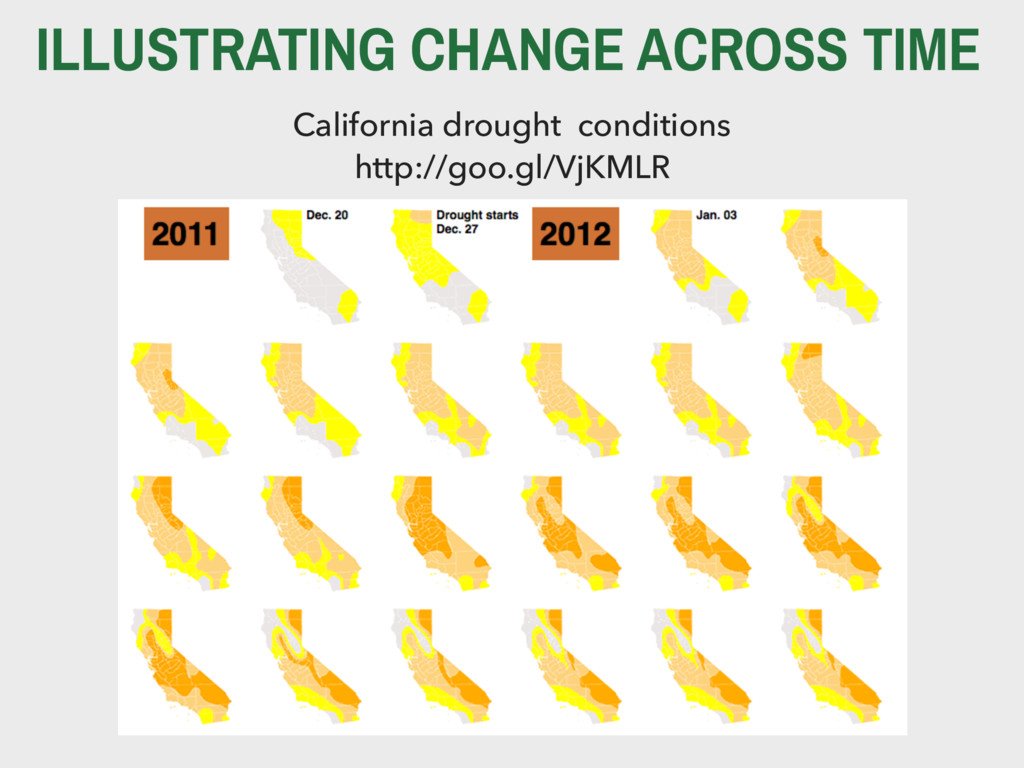
layout with one data frame per time period or category ▸ OR export single layouts with one time period or category per layout and put them together in PowerPoint or a similar application ▸ Keep elements close together! 5. CHANGE ACROSS CATEGORIES CREATING MULTIPLES
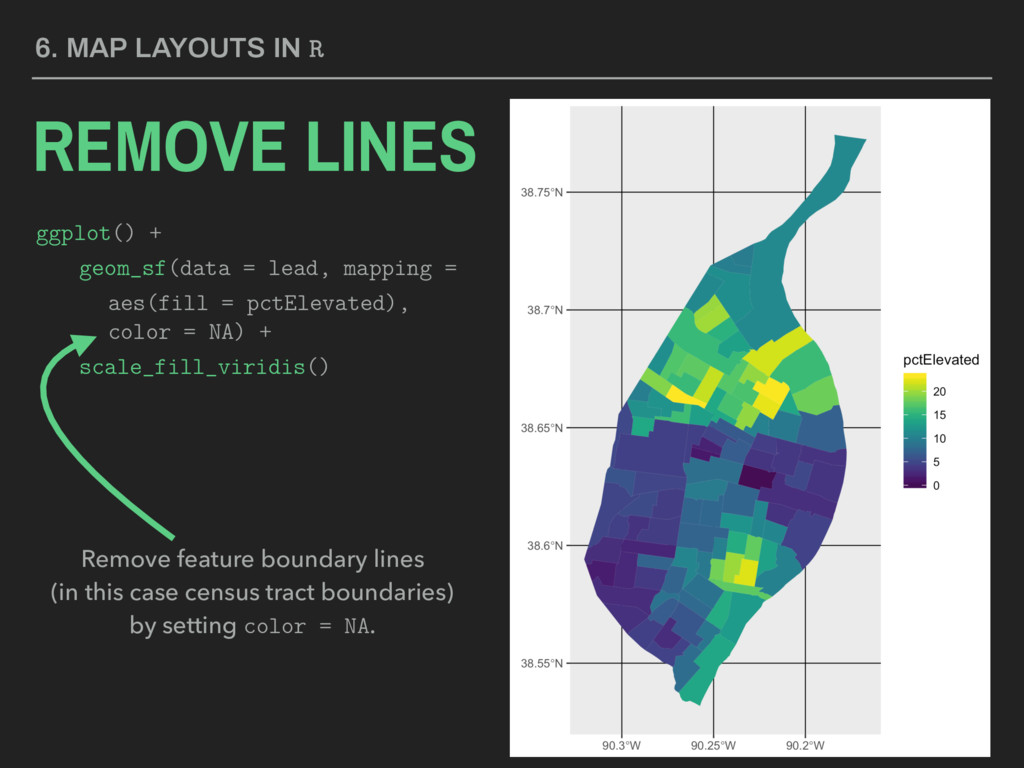
color = NA) + scale_fill_viridis() 6. MAP LAYOUTS IN R REMOVE LINES Remove feature boundary lines (in this case census tract boundaries) by setting color = NA.
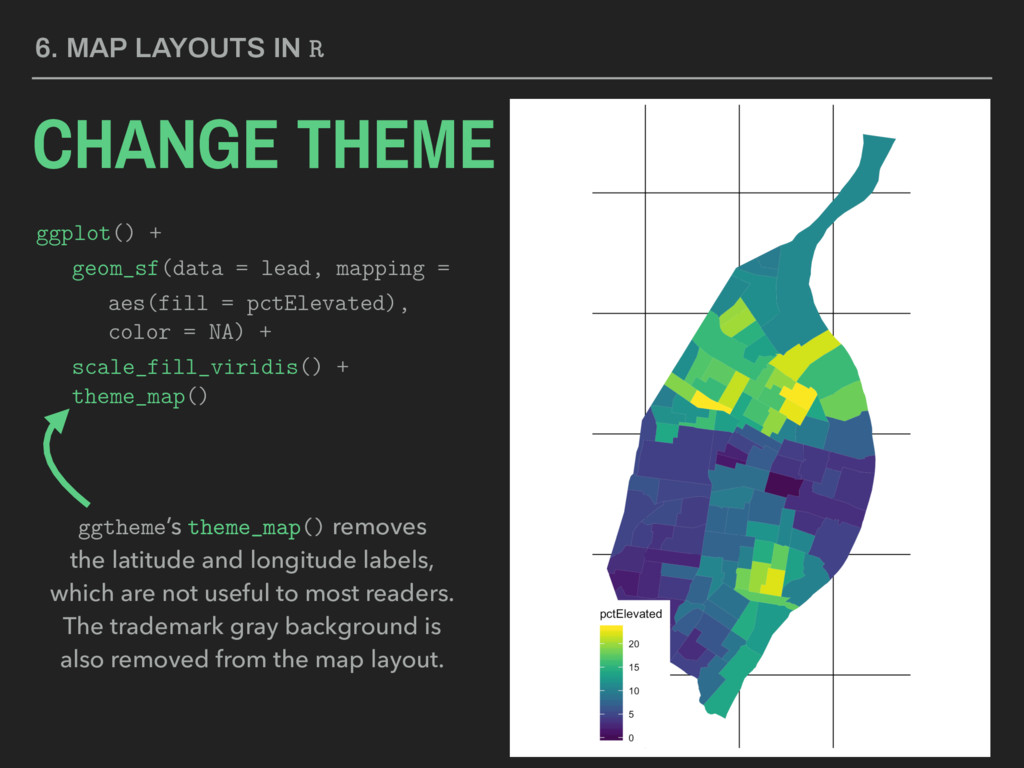
color = NA) + scale_fill_viridis() + theme_map() 6. MAP LAYOUTS IN R CHANGE THEME ggtheme’s theme_map() removes the latitude and longitude labels, which are not useful to most readers. The trademark gray background is also removed from the map layout.
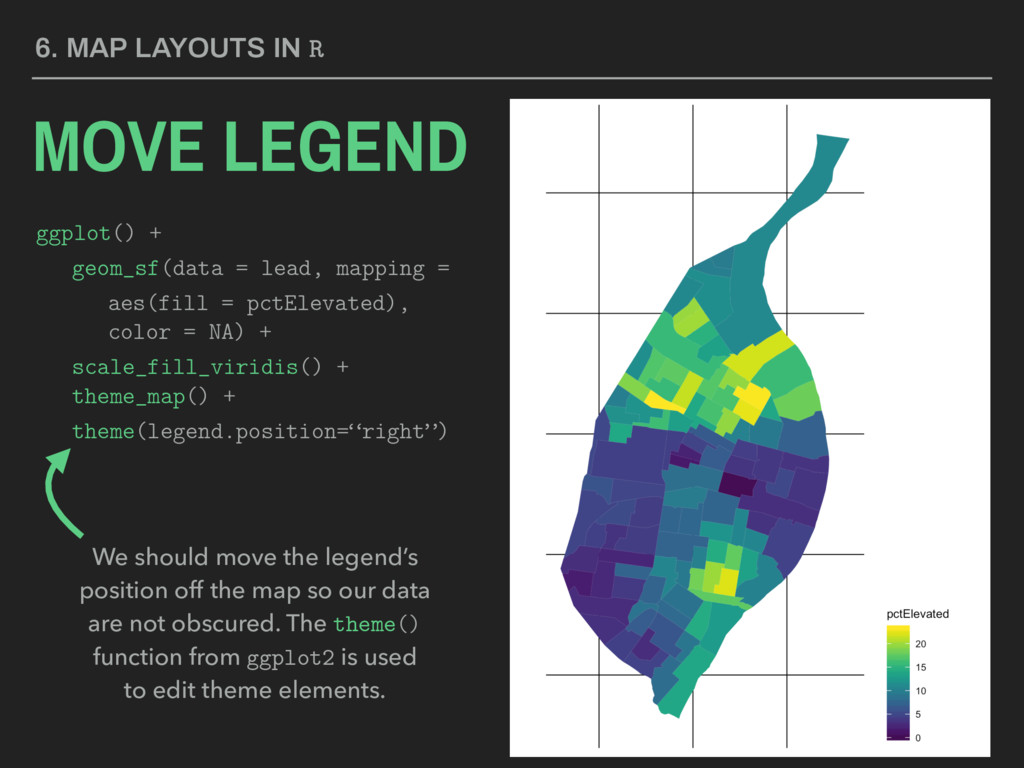
color = NA) + scale_fill_viridis() + theme_map() + theme(legend.position=“right”) 6. MAP LAYOUTS IN R MOVE LEGEND We should move the legend’s position off the map so our data are not obscured. The theme() function from ggplot2 is used to edit theme elements.
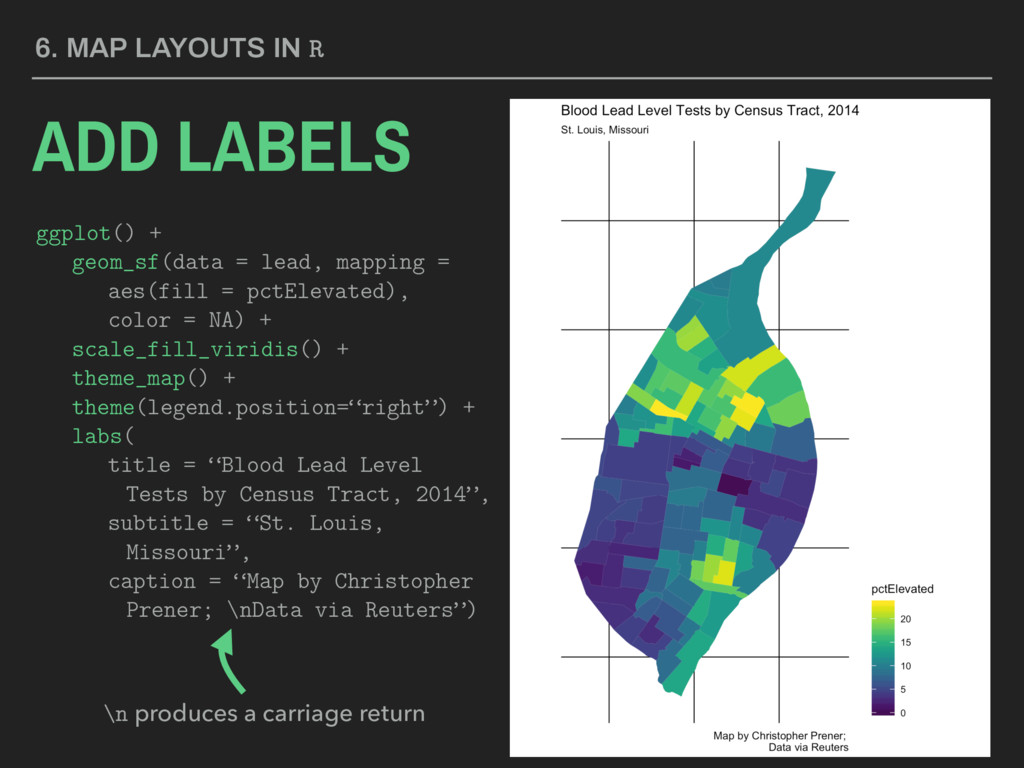
color = NA) + scale_fill_viridis() + theme_map() + theme(legend.position=“right”) + labs( title = “Blood Lead Level Tests by Census Tract, 2014”, subtitle = “St. Louis, Missouri”, caption = “Map by Christopher Prener; \nData via Reuters”) 6. MAP LAYOUTS IN R ADD LABELS \n produces a carriage return
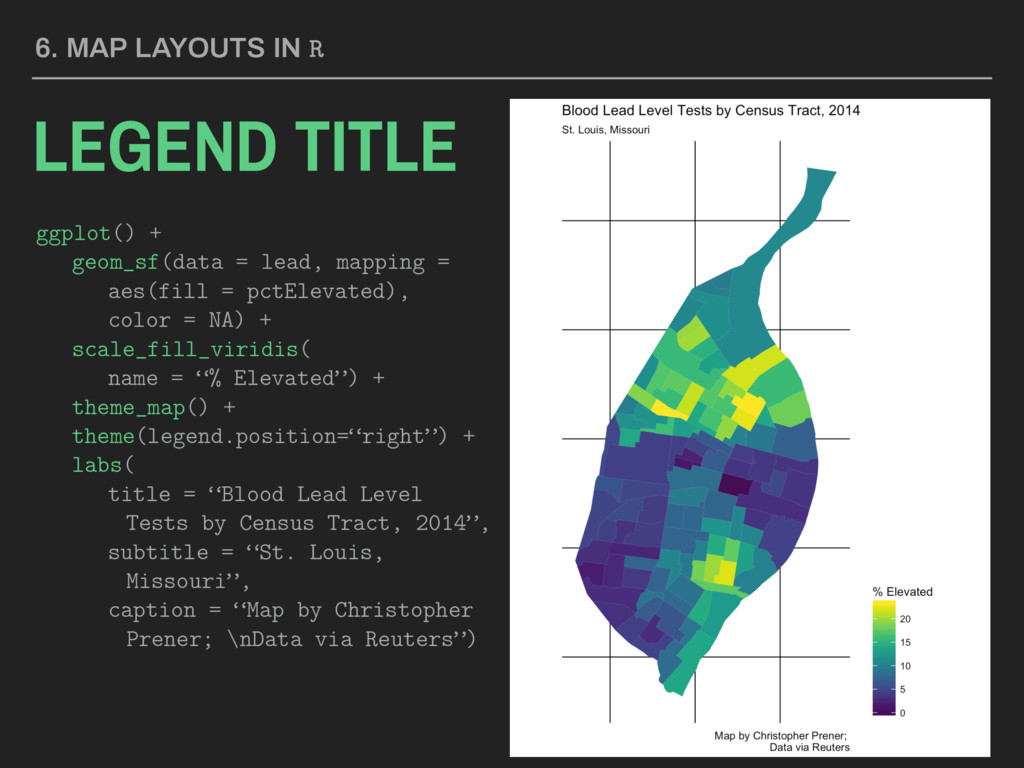
color = NA) + scale_fill_viridis( name = “% Elevated”) + theme_map() + theme(legend.position=“right”) + labs( title = “Blood Lead Level Tests by Census Tract, 2014”, subtitle = “St. Louis, Missouri”, caption = “Map by Christopher Prener; \nData via Reuters”) 6. MAP LAYOUTS IN R LEGEND TITLE
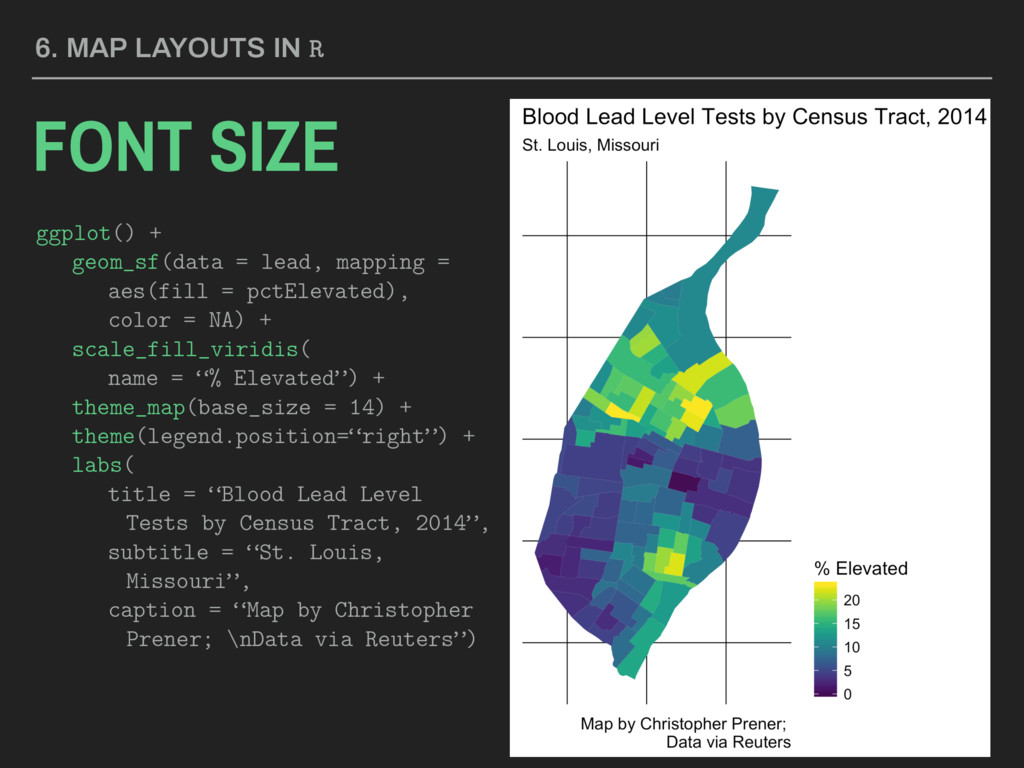
color = NA) + scale_fill_viridis( name = “% Elevated”) + theme_map(base_size = 14) + theme(legend.position=“right”) + labs( title = “Blood Lead Level Tests by Census Tract, 2014”, subtitle = “St. Louis, Missouri”, caption = “Map by Christopher Prener; \nData via Reuters”) 6. MAP LAYOUTS IN R FONT SIZE
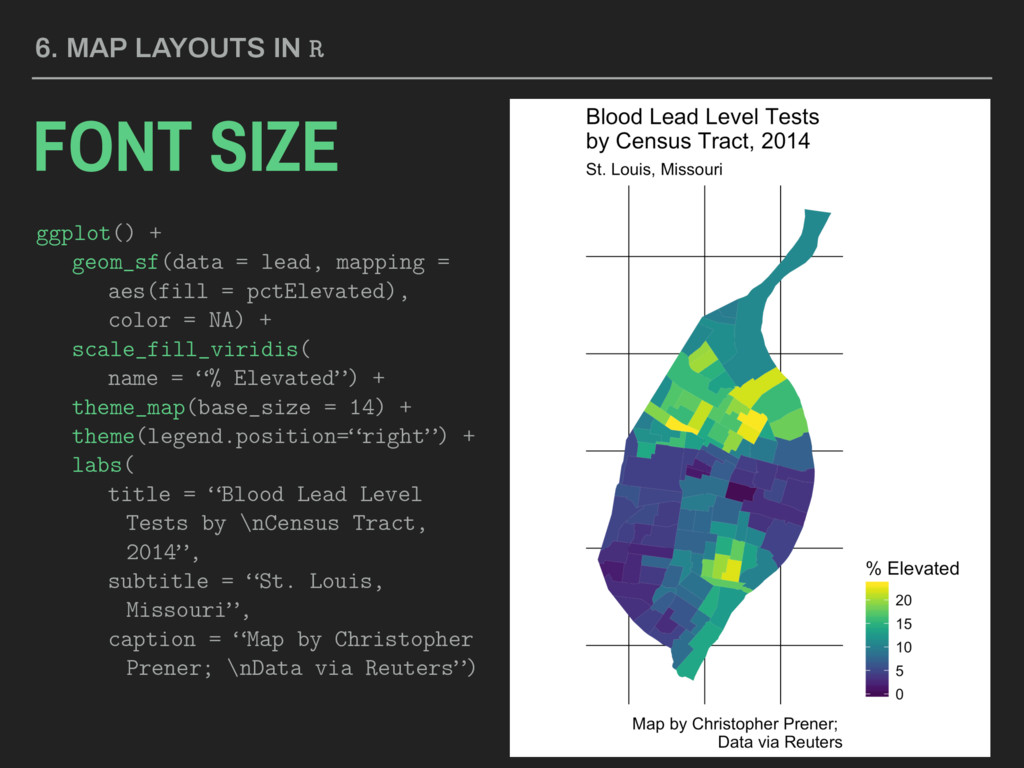
color = NA) + scale_fill_viridis( name = “% Elevated”) + theme_map(base_size = 14) + theme(legend.position=“right”) + labs( title = “Blood Lead Level Tests by \nCensus Tract, 2014”, subtitle = “St. Louis, Missouri”, caption = “Map by Christopher Prener; \nData via Reuters”) 6. MAP LAYOUTS IN R FONT SIZE
before next class. You are also expected to post an update in your group’s Slack channel about how data access and work are going. I’m going to increase the weight that contributing to the GIS and Public Policy discussions are given in the participation grade. Make sure you are checking in on GitHub and Slack regularly - lots of feedback posted in the last few days.