Upgrade to Pro
— share decks privately, control downloads, hide ads and more …
Speaker Deck
Features
Speaker Deck
PRO
Sign in
Sign up for free
Search
Search
DTrace & Python
Search
Sponsored
·
SiteGround - Reliable hosting with speed, security, and support you can count on.
→
Conor McDermottroe
March 13, 2013
Technology
140
2
Share
Embed
Copy iframe code
Copy JS code
Copy link
Start on current slide
DTrace & Python
An introduction to DTrace and to using DTrace to inspect Python programs.
Conor McDermottroe
March 13, 2013
Other Decks in Technology
See All in Technology
2026TECHFRESH畢業分享會 - Lightning Talk - 打造精準高效的 MCP 設計模式與測試實務
line_developers_tw
PRO
0
1k
Snowflakeと仲良くなる第一歩
coco_se
4
470
小さくはじめるSLI/SLO ~育てながら組織に定着させる実践知~ / Starting Small with SLI/SLOs: Building Adoption Through Continuous Growth
nari_ex
7
1.9k
ルールやカスタム機能、どう活かす?ハンズオンで体感するIBM Bobの出力コントロール
muehara
1
160
20260619 私の日常業務での生成 AI 活用
masaruogura
1
210
NAB Show 2026 動画技術関連レポート / NAB Show 2026 Report
cyberagentdevelopers
PRO
0
200
中期計画、2回作ってみた ~業務委託と正社員、両方の視点から~
demaecan
1
750
LayerXにおけるセキュリティ管理の現在地と次の一手
tosho
0
190
【Cyber-sec+】経営層を"動かす"ための考え方
hssh2_bin
0
180
2026 TECHFRESH 畢業分享會 - AI-Native 重塑軟體工程與虛擬講師
line_developers_tw
PRO
0
1k
ACE-Step-1.5で見る 音楽生成AIのしくみと“破綻だけ直す”Retake機能の開発【zennfes spring 2026 登壇資料】
personabb
1
460
白金鉱業Meetup_Vol.24_「AIエージェントは分けるほど良い」は本当か? / Is it true that “the more you divide AI agents, the better”?
brainpadpr
1
380
Featured
See All Featured
A Soul's Torment
seathinner
6
2.9k
B2B Lead Gen: Tactics, Traps & Triumph
marketingsoph
0
150
The Art of Delivering Value - GDevCon NA Keynote
reverentgeek
16
2k
Navigating the moral maze — ethical principles for Al-driven product design
skipperchong
2
390
[SF Ruby Conf 2025] Rails X
palkan
2
1.1k
Docker and Python
trallard
47
3.9k
A brief & incomplete history of UX Design for the World Wide Web: 1989–2019
jct
2
400
How To Stay Up To Date on Web Technology
chriscoyier
790
250k
Breaking role norms: Why Content Design is so much more than writing copy - Taylor Woolridge
uxyall
0
320
個人開発の失敗を避けるイケてる考え方 / tips for indie hackers
panda_program
123
22k
Stewardship and Sustainability of Urban and Community Forests
pwiseman
0
230
Tips & Tricks on How to Get Your First Job In Tech
honzajavorek
1
540
Transcript
DTrace & Python Conor McDermottroe @IRLConor
WARNING • I’ve only been using DTrace for a couple
of months • Sometimes it helps to know C • Sometimes it helps to know AWK
What is it? • It’s like having logging everywhere •
... but without being slow • ... and with good query tools
What is it not? • A debugger • A profiler
• A logging framework
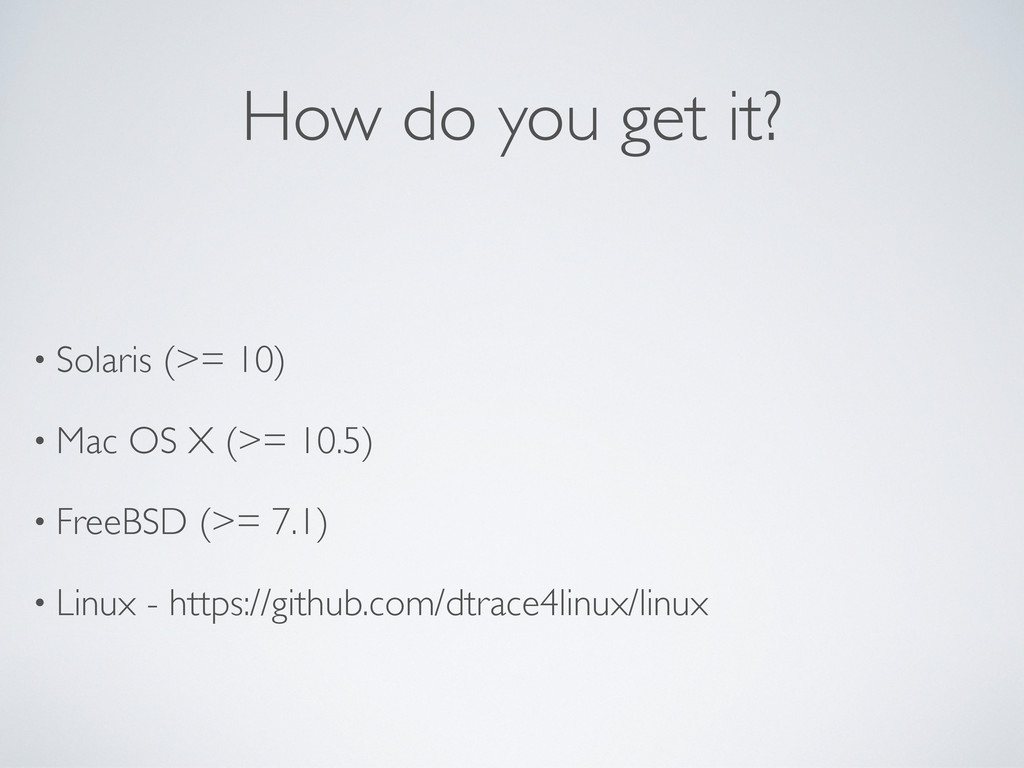
How do you get it? • Solaris (>= 10) •
Mac OS X (>= 10.5) • FreeBSD (>= 7.1) • Linux - https://github.com/dtrace4linux/linux
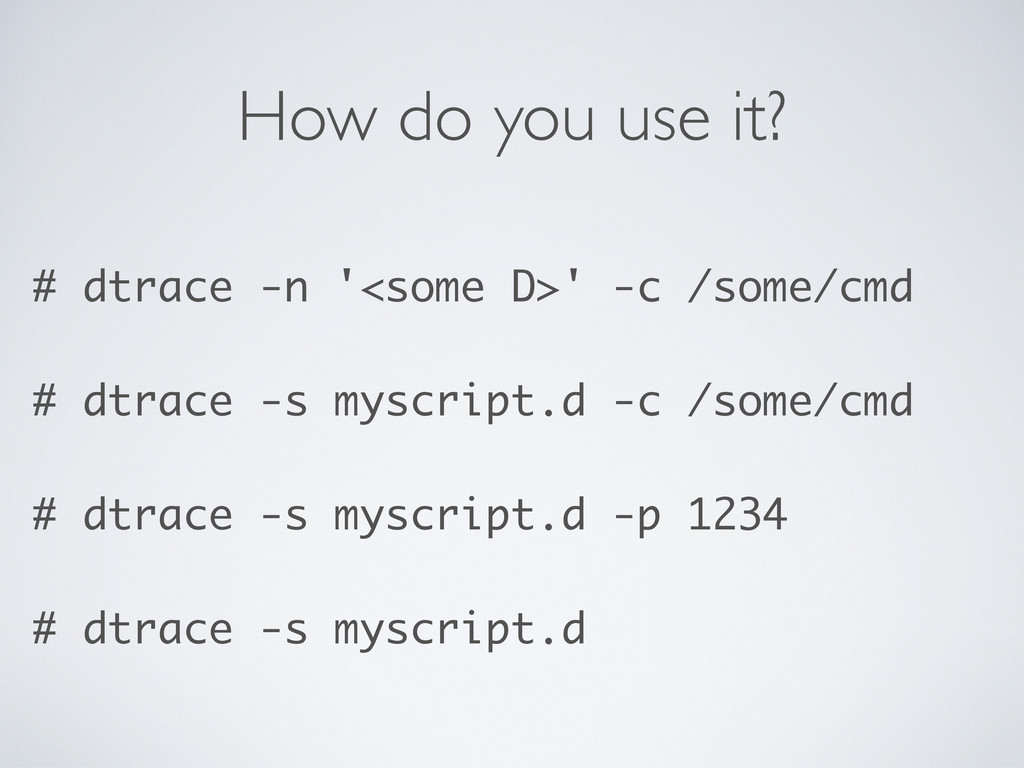
How do you use it? # dtrace -n '<some D>'
-c /some/cmd # dtrace -s myscript.d -c /some/cmd # dtrace -s myscript.d -p 1234 # dtrace -s myscript.d
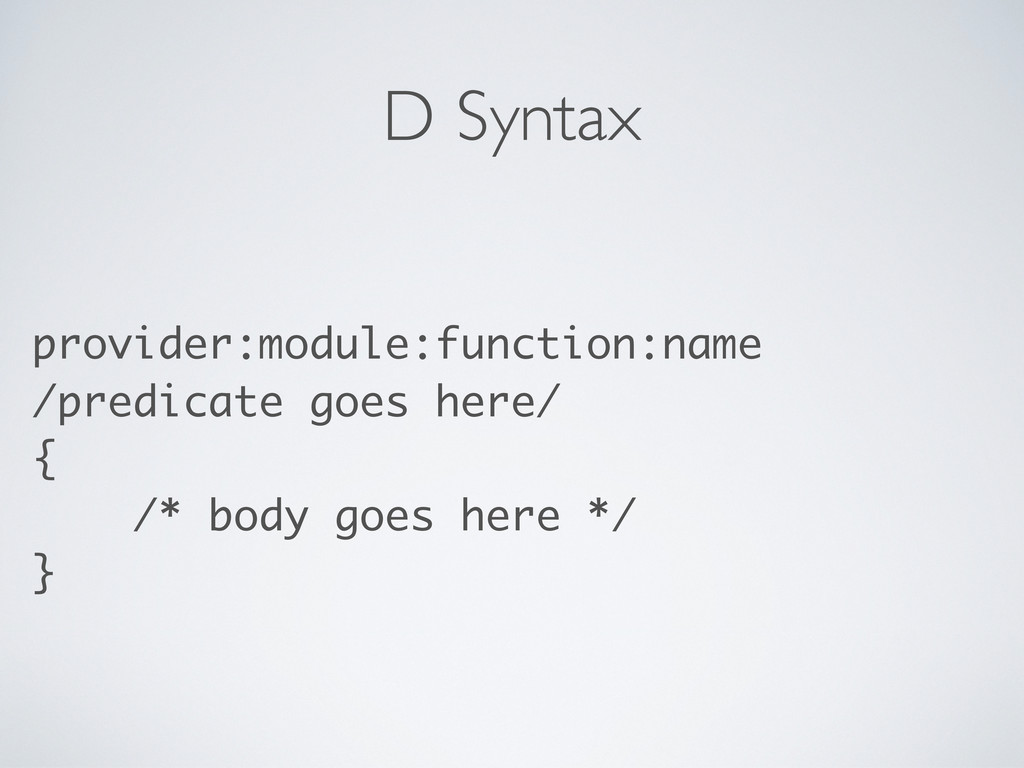
D Syntax provider:module:function:name /predicate goes here/ { /* body goes
here */ }
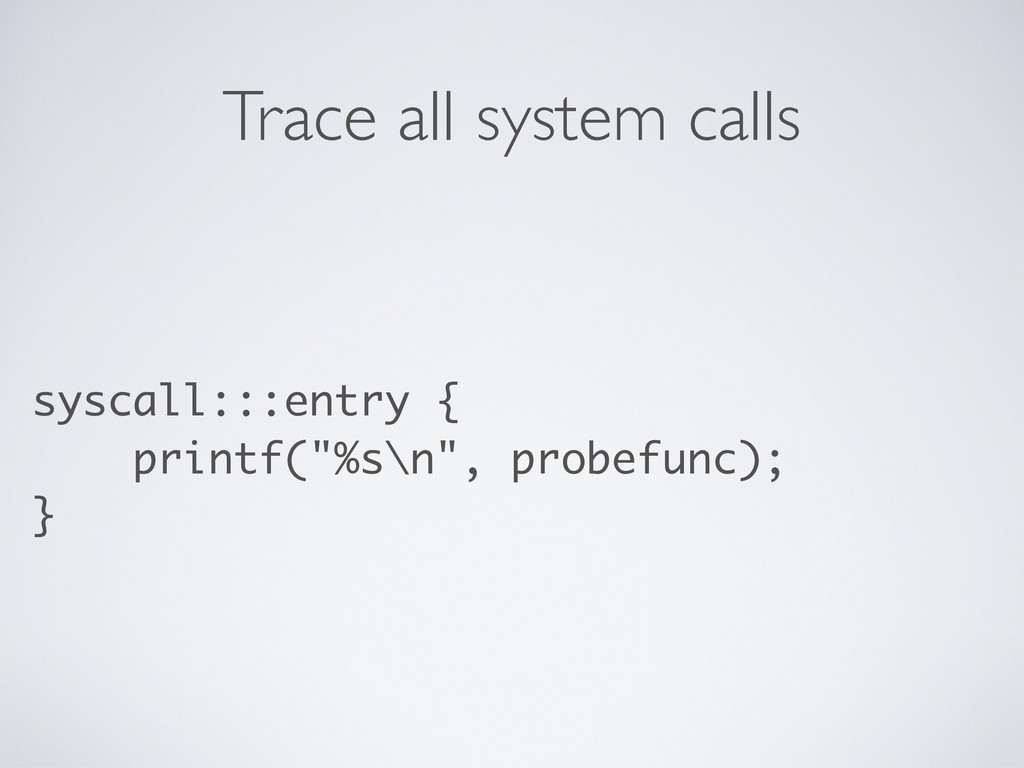
Trace all system calls syscall:::entry { printf("%s\n", probefunc); }
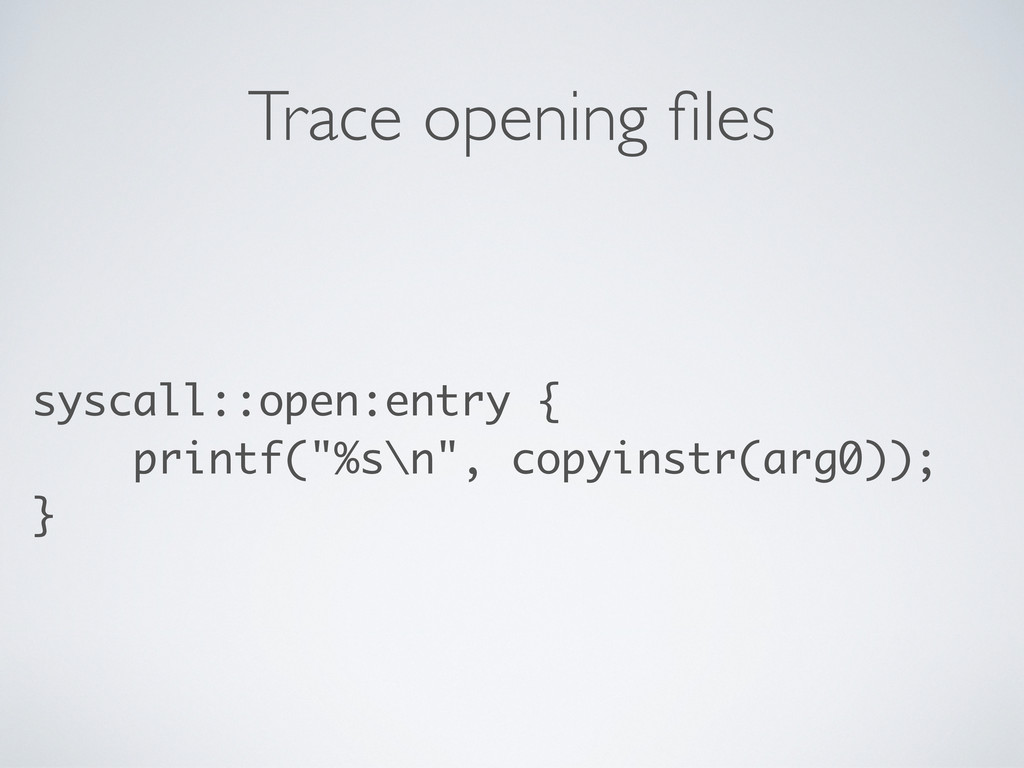
Trace opening files syscall::open:entry { printf("%s\n", copyinstr(arg0)); }
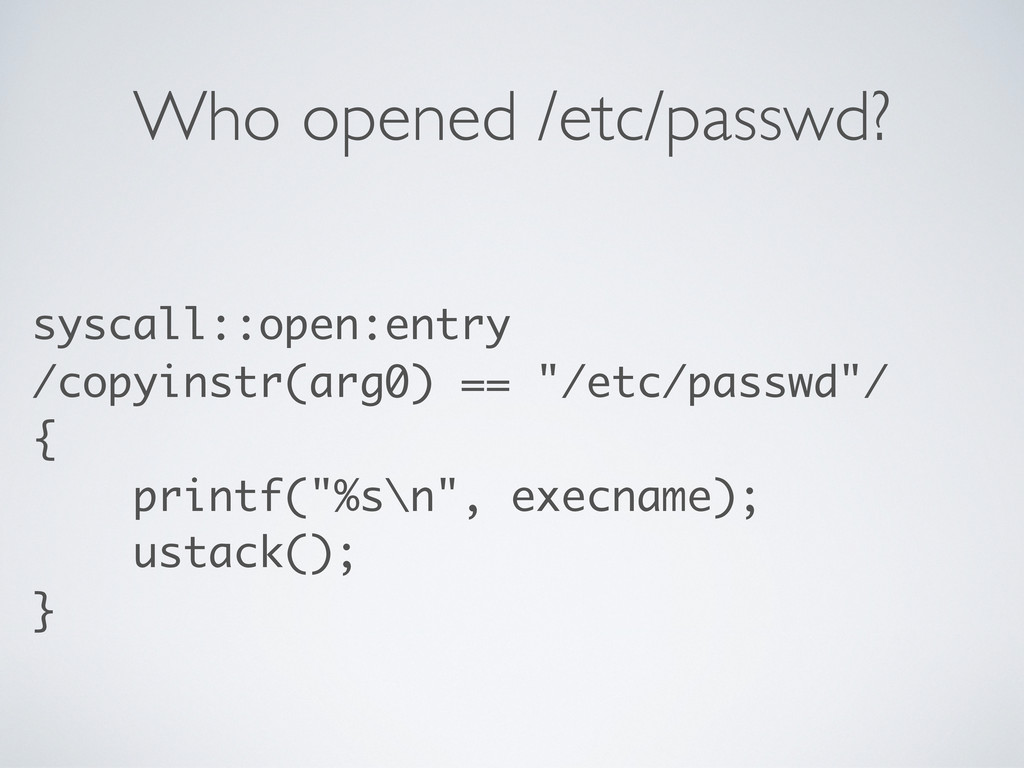
Who opened /etc/passwd? syscall::open:entry /copyinstr(arg0) == "/etc/passwd"/ { printf("%s\n", execname);
ustack(); }
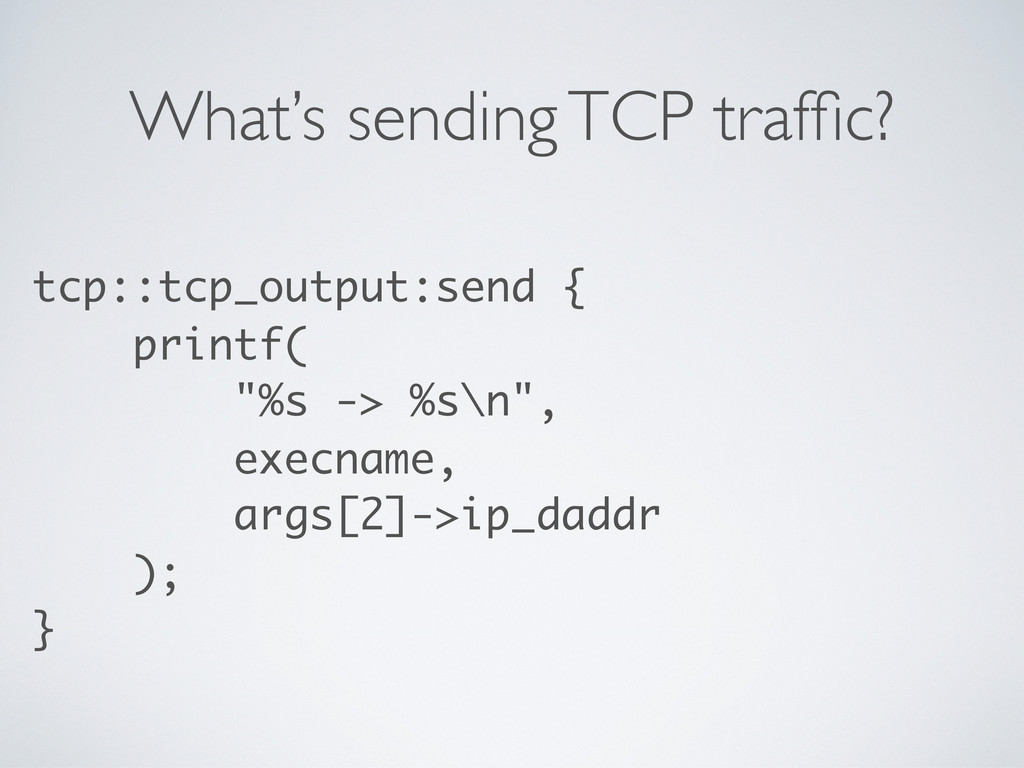
What’s sending TCP traffic? tcp::tcp_output:send { printf( "%s -> %s\n",
execname, args[2]->ip_daddr ); }
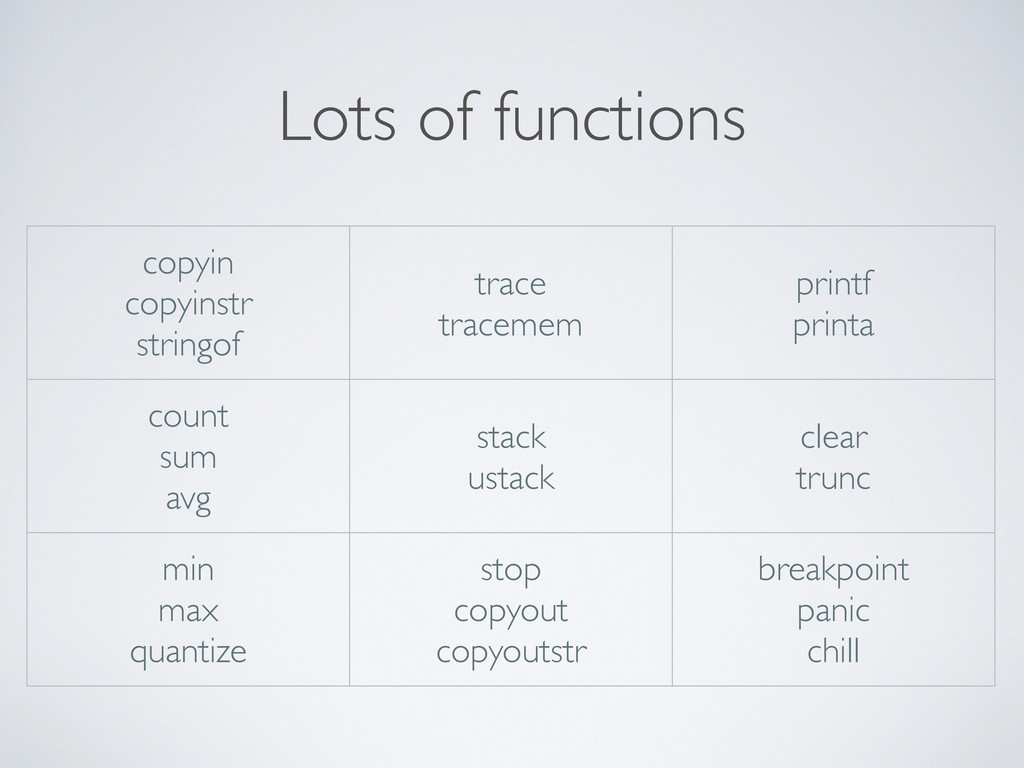
Lots of functions copyin copyinstr stringof trace tracemem printf printa
count sum avg stack ustack clear trunc min max quantize stop copyout copyoutstr breakpoint panic chill
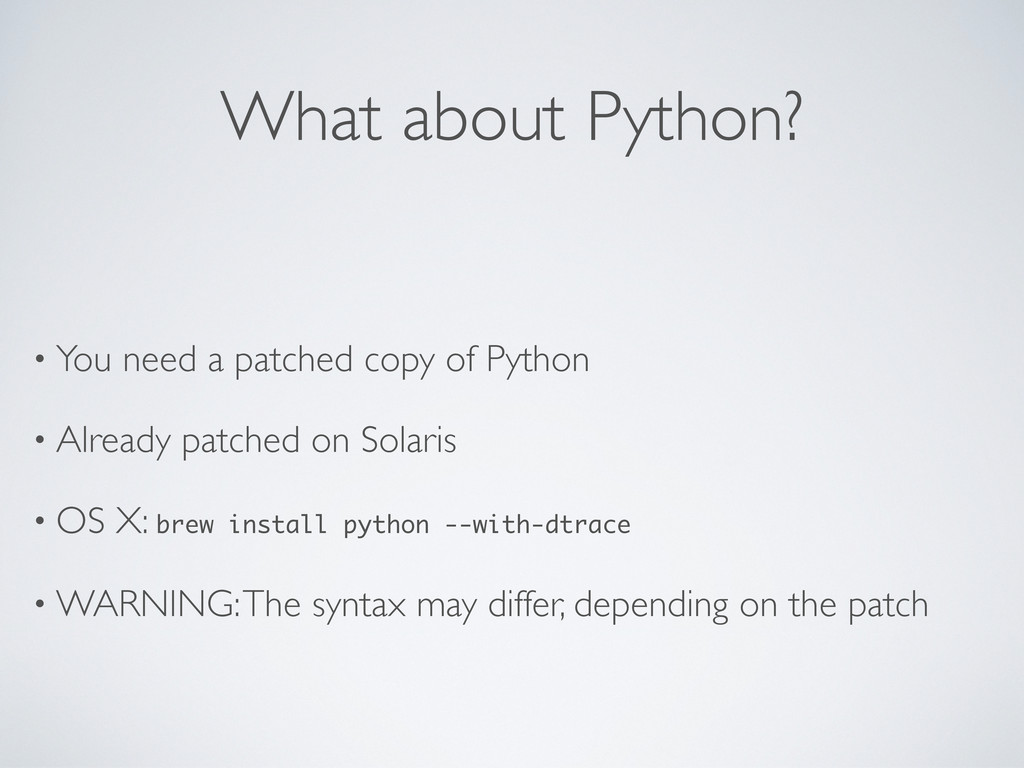
What about Python? • You need a patched copy of
Python • Already patched on Solaris • OS X: brew install python --with-dtrace • WARNING: The syntax may differ, depending on the patch
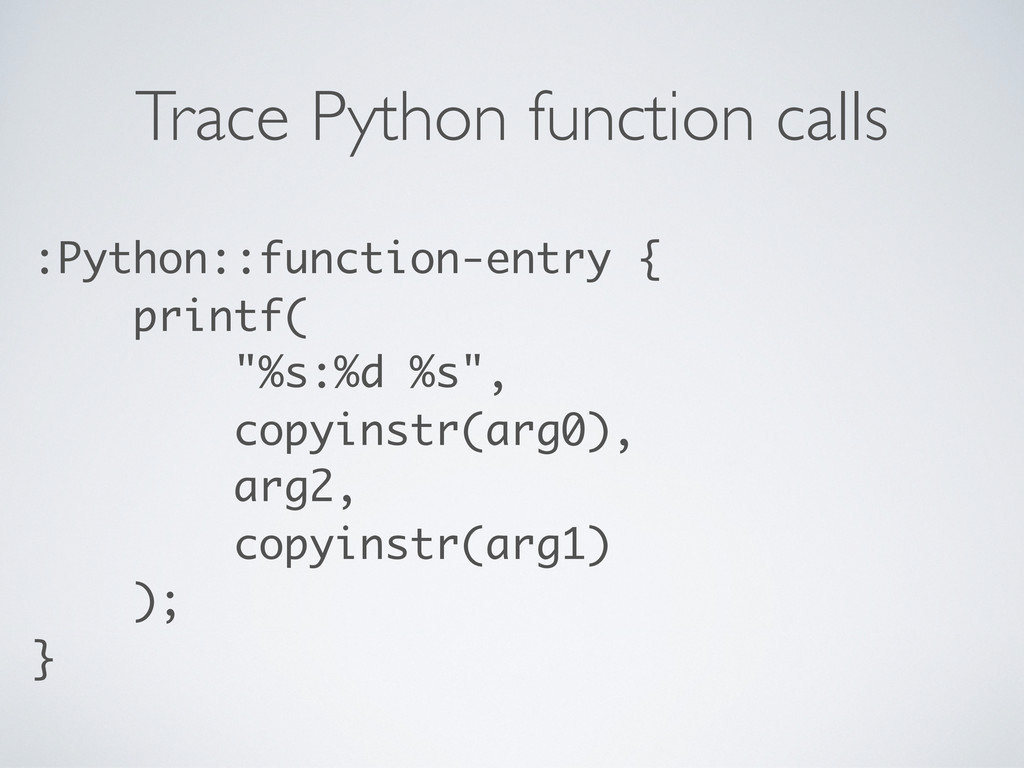
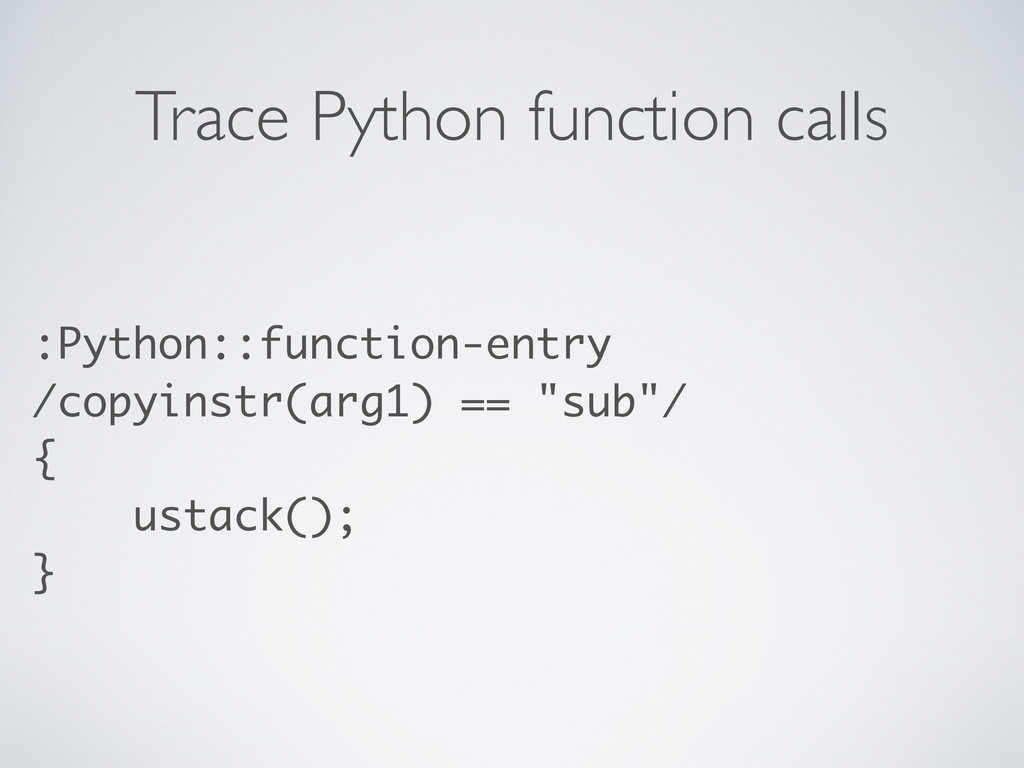
Trace Python function calls :Python::function-entry { printf( "%s:%d %s", copyinstr(arg0),
arg2, copyinstr(arg1) ); }
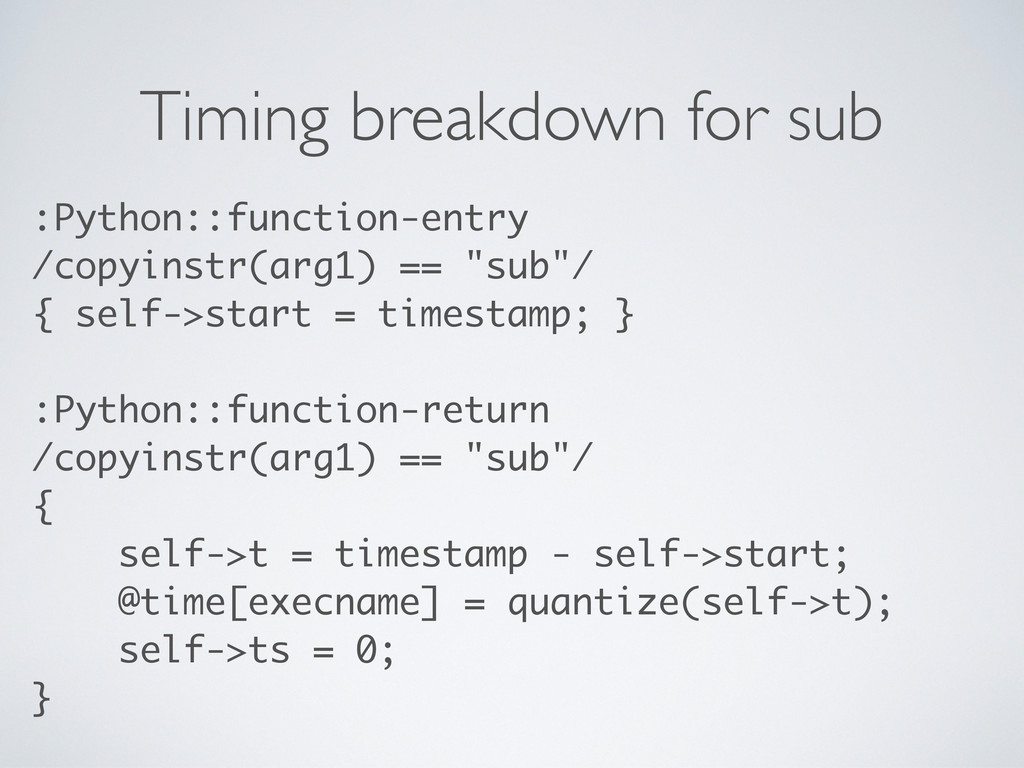
Timing breakdown for sub :Python::function-entry /copyinstr(arg1) == "sub"/ { self->start
= timestamp; } :Python::function-return /copyinstr(arg1) == "sub"/ { self->t = timestamp - self->start; @time[execname] = quantize(self->t); self->ts = 0; }
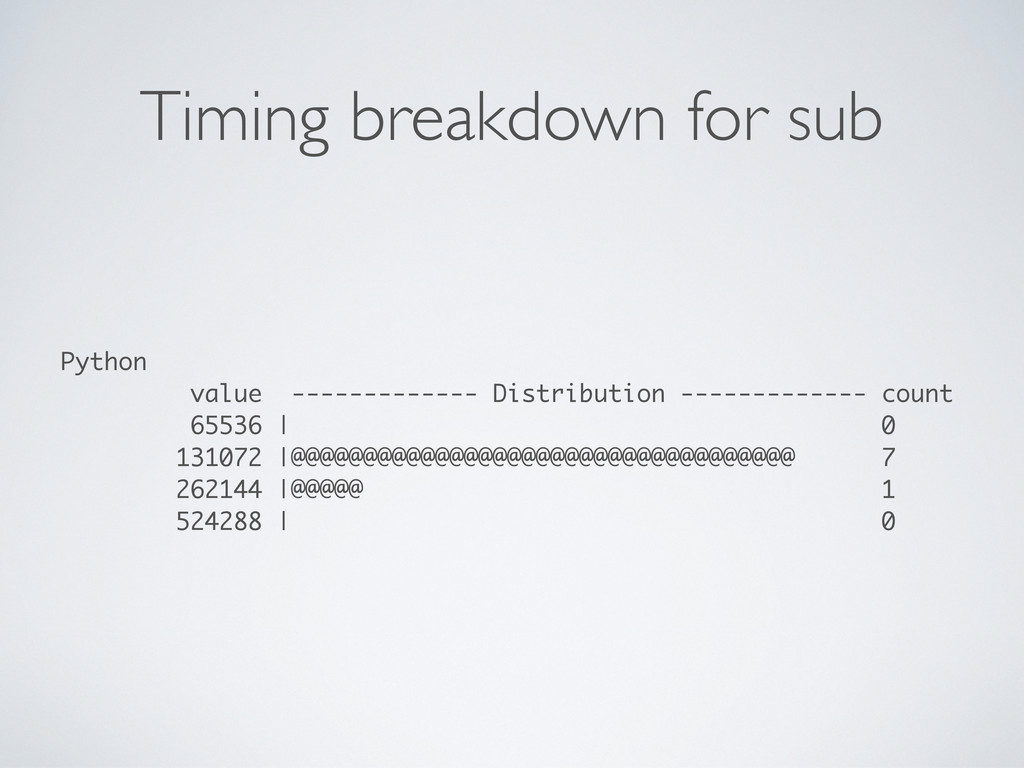
Timing breakdown for sub Python value ------------- Distribution ------------- count
65536 | 0 131072 |@@@@@@@@@@@@@@@@@@@@@@@@@@@@@@@@@@@ 7 262144 |@@@@@ 1 524288 | 0
Trace Python function calls :Python::function-entry /copyinstr(arg1) == "sub"/ { ustack();
}
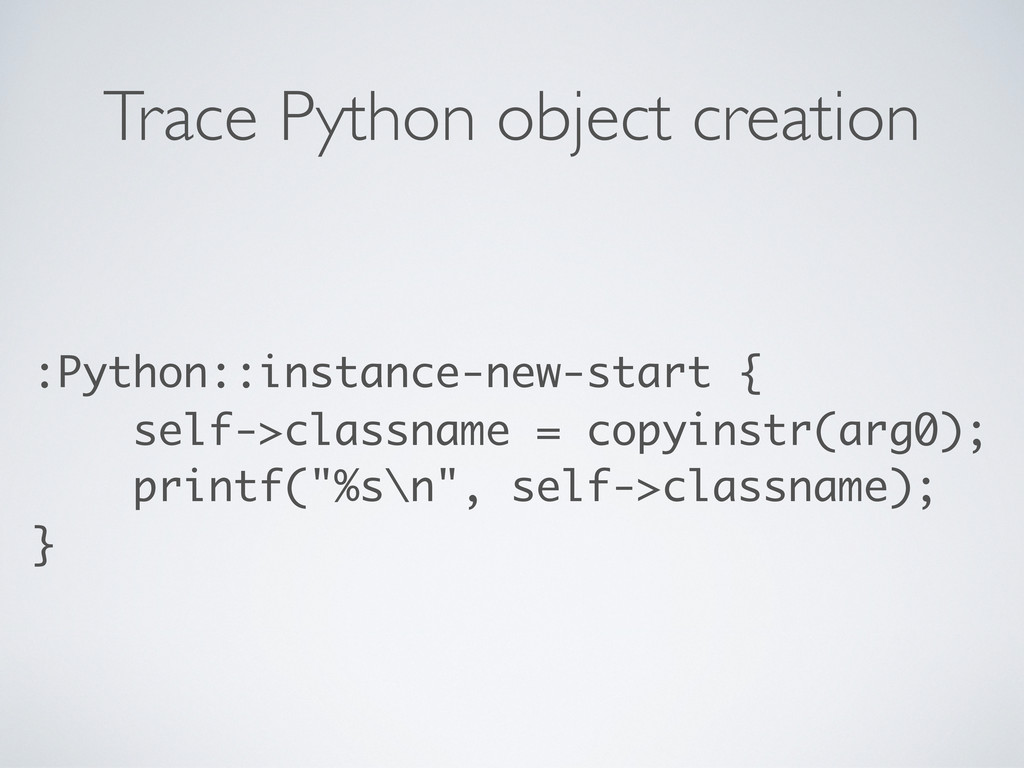
Trace Python object creation :Python::instance-new-start { self->classname = copyinstr(arg0); printf("%s\n",
self->classname); }
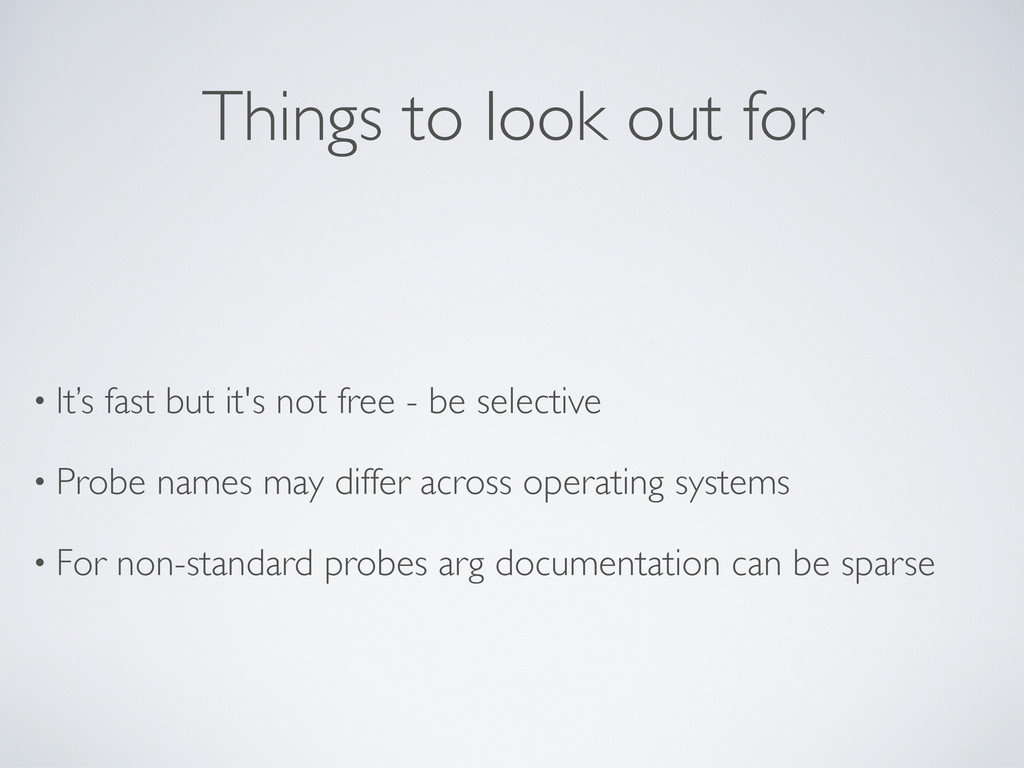
Things to look out for • It’s fast but it's
not free - be selective • Probe names may differ across operating systems • For non-standard probes arg documentation can be sparse
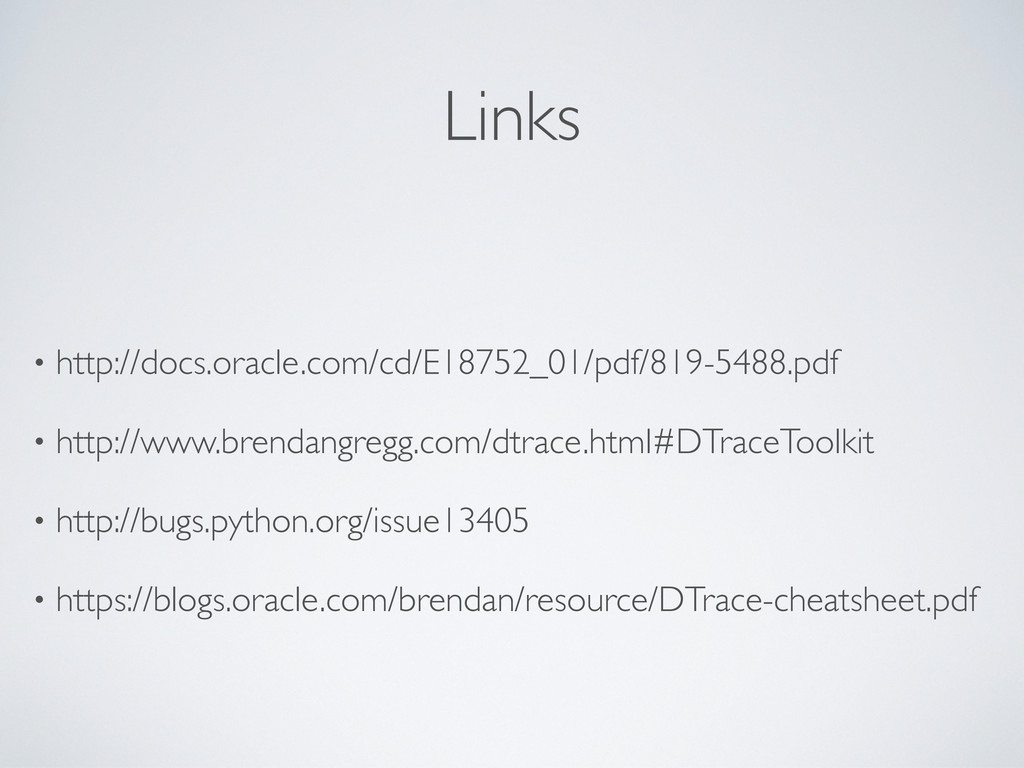
Links • http://docs.oracle.com/cd/E18752_01/pdf/819-5488.pdf • http://www.brendangregg.com/dtrace.html#DTraceToolkit • http://bugs.python.org/issue13405 • https://blogs.oracle.com/brendan/resource/DTrace-cheatsheet.pdf
QUESTIONS