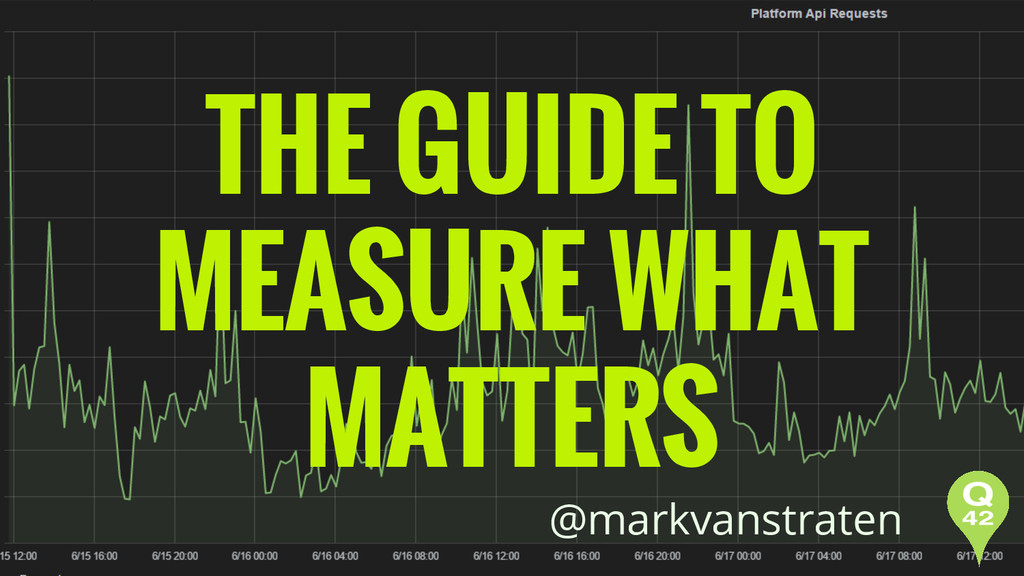
Presented at NDC Oslo 2015
How do you monitor the key performance indicators of your application? Do you know if signups are decreasing versus last week? Have you adopted agile principles but also a hard time to monitor the improvements of your continuous deployments?
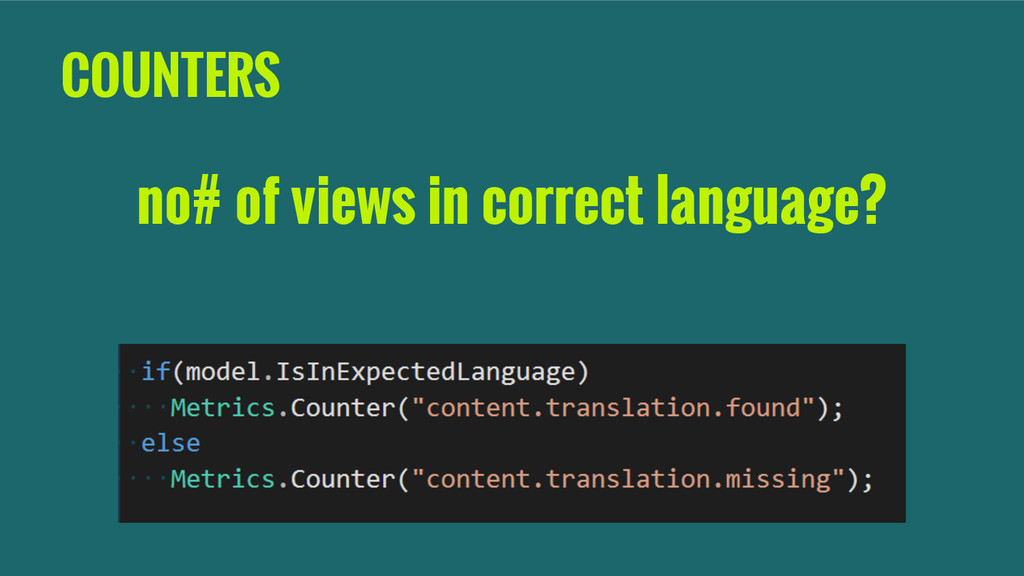
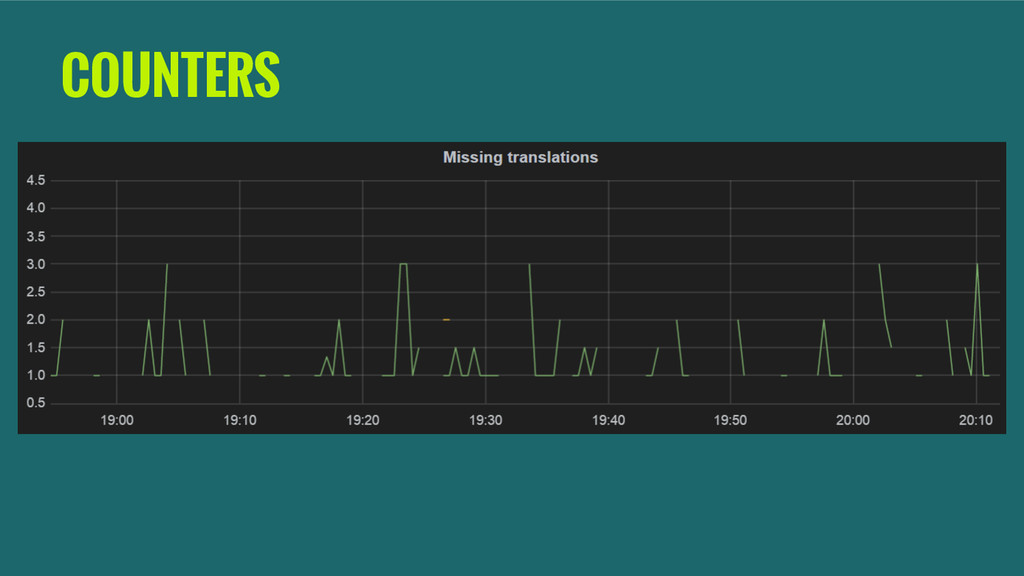
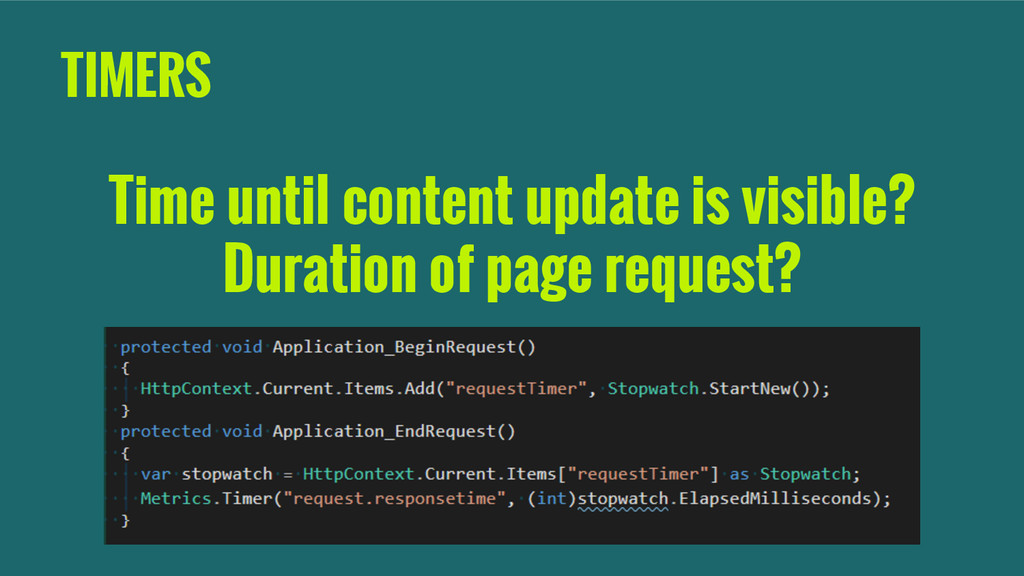
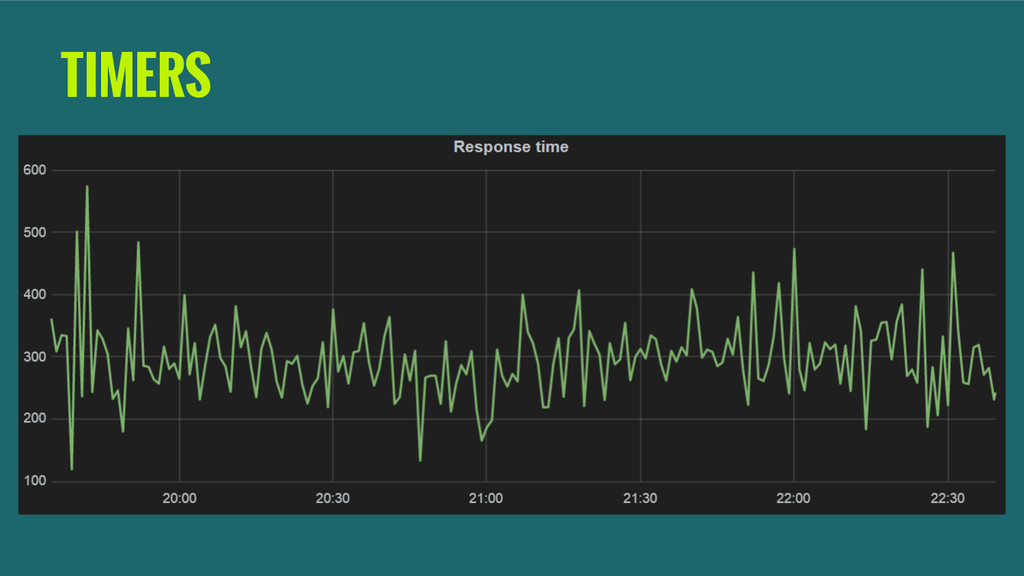
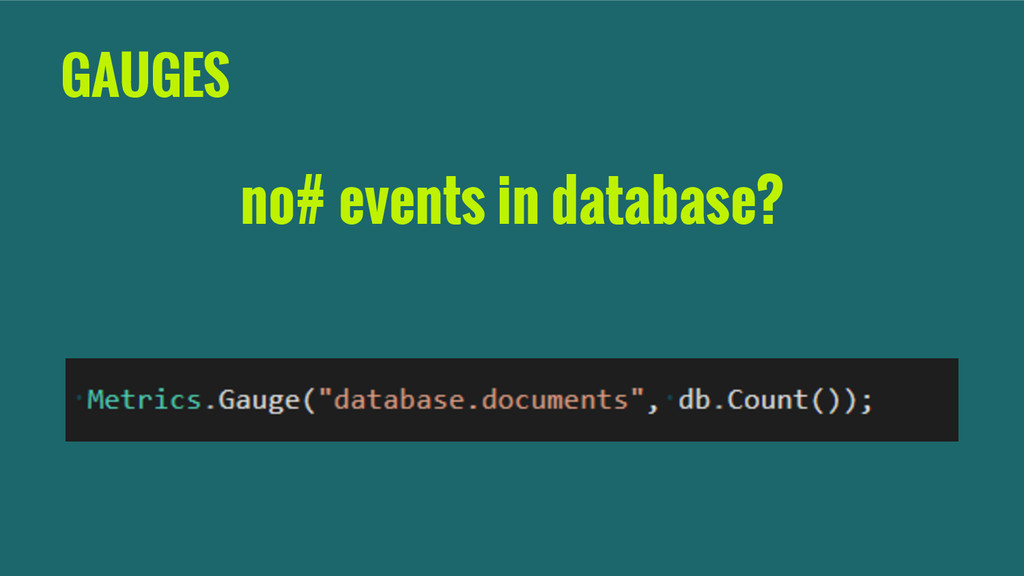
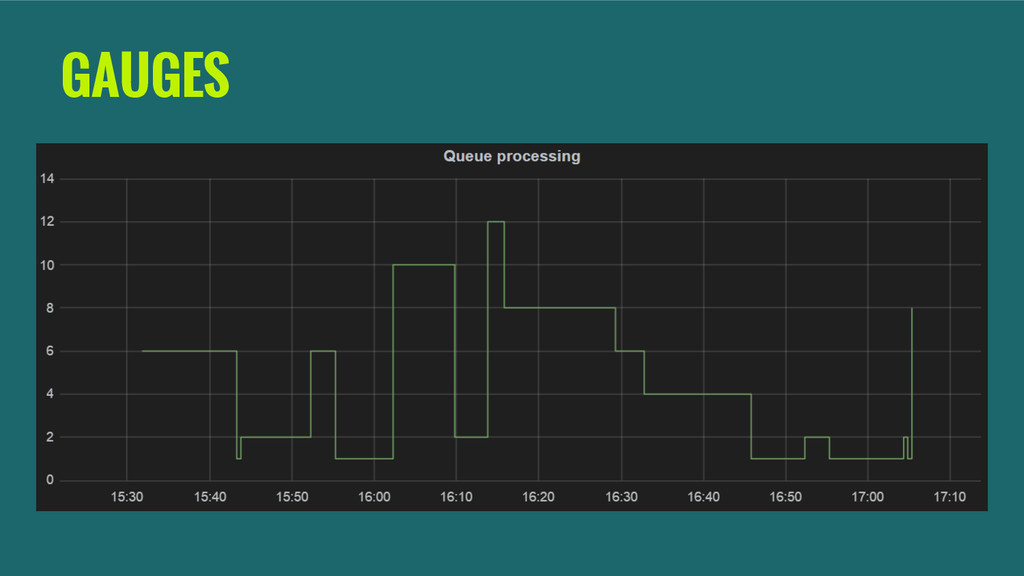
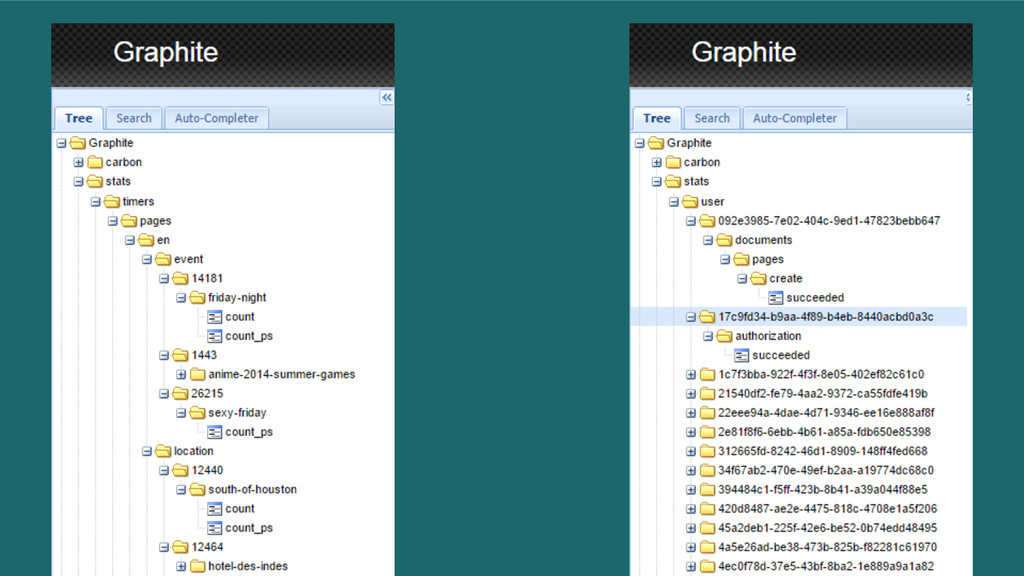
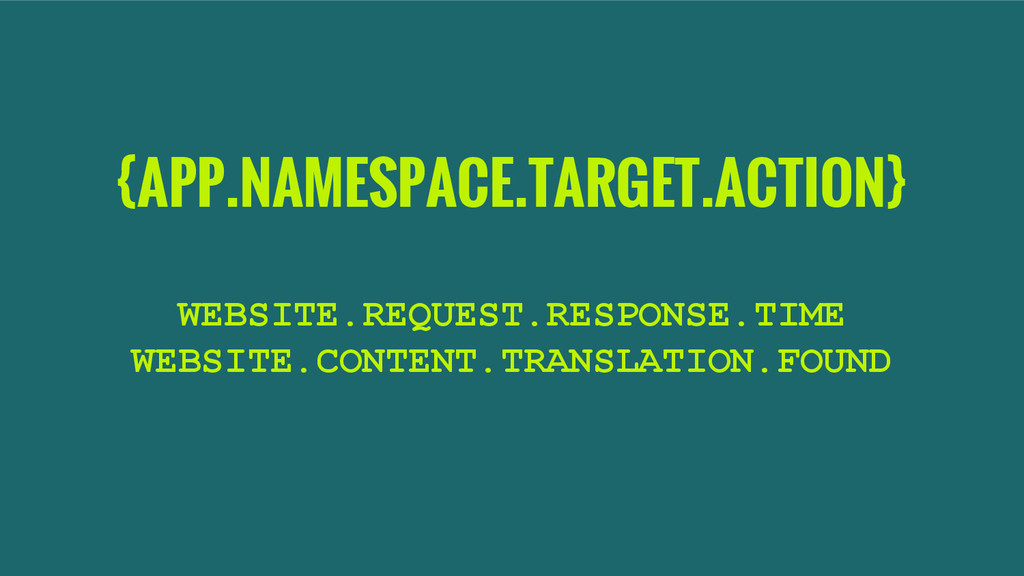
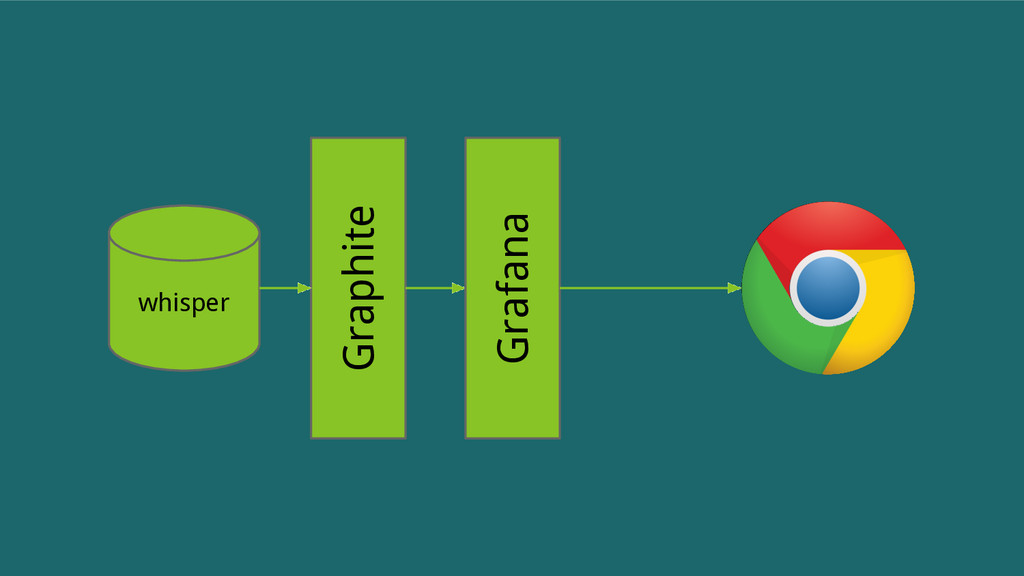
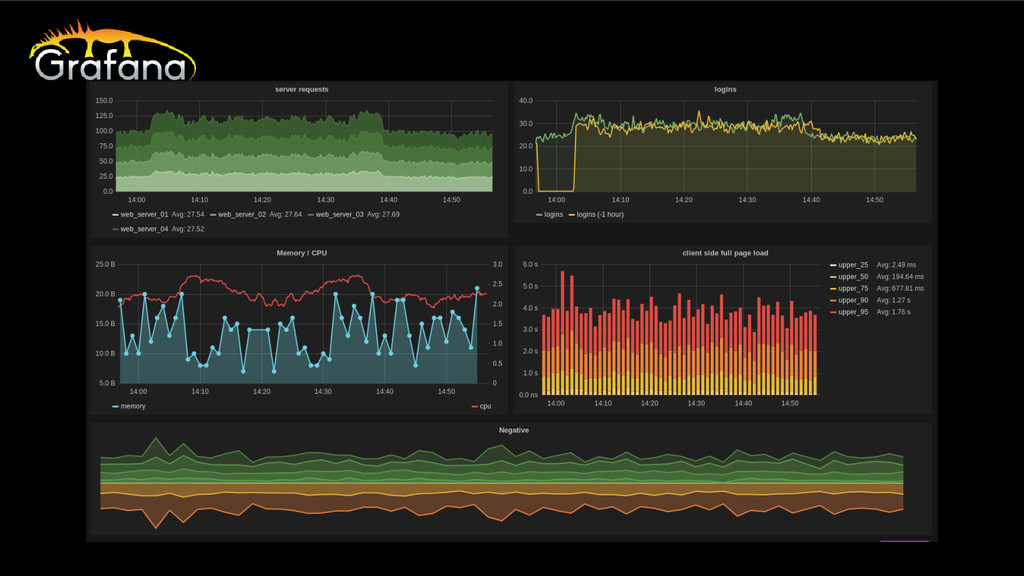
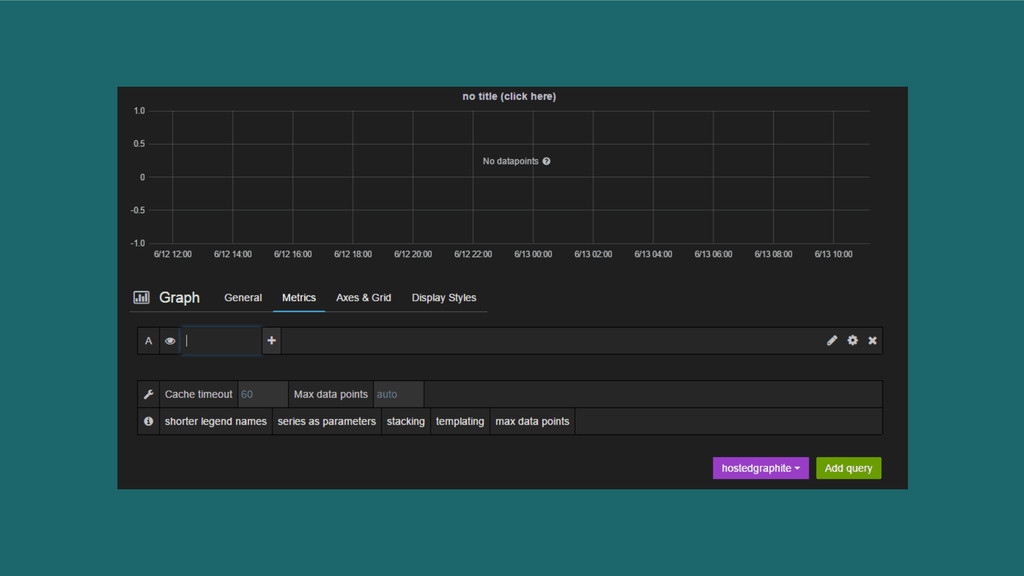
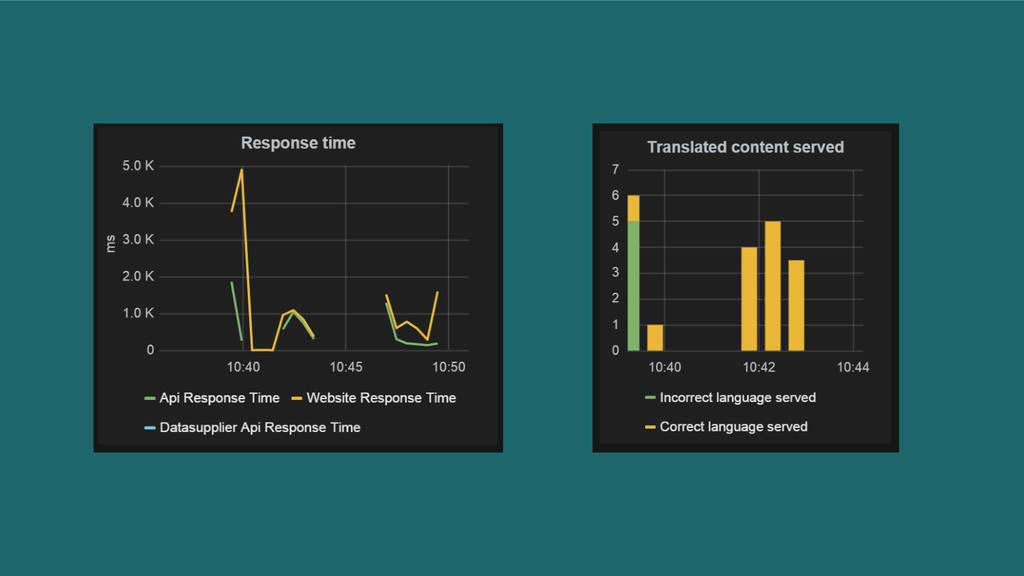
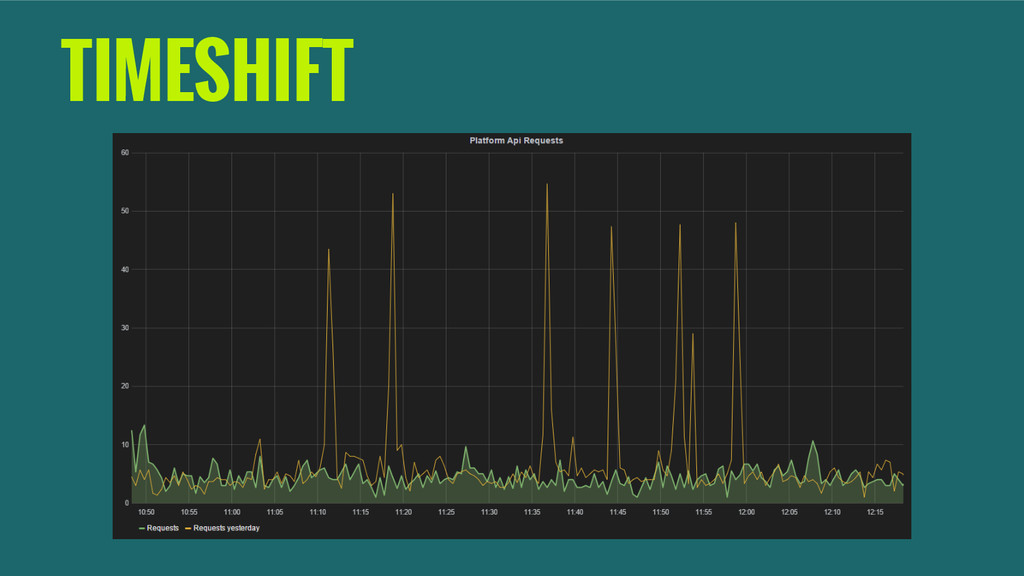
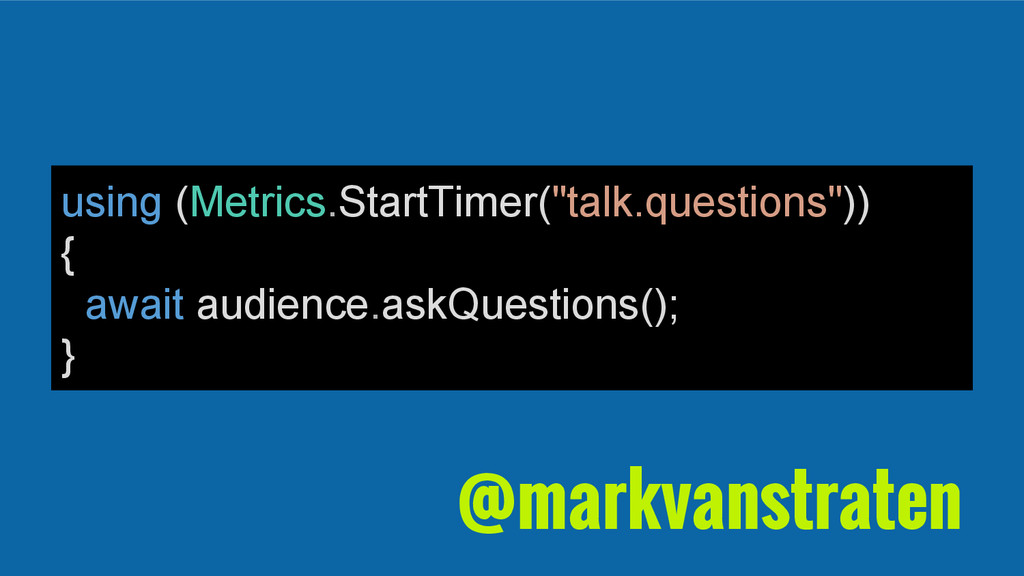
In this talk we will briefly discuss multiple measuring solutions before diving into the nitty-gritty details of measuring with the help of StatsD. We will implement a few counters and timers and graph these so we can start to make sense of the data. Then we will use powerful functions to analyse the data and spot trends before your users do.
After this talk you will be empowered to create your own data metrics with help of StatsD and have basic knowledge how to plot these metrics into meaningfull graphs. Be empowered!
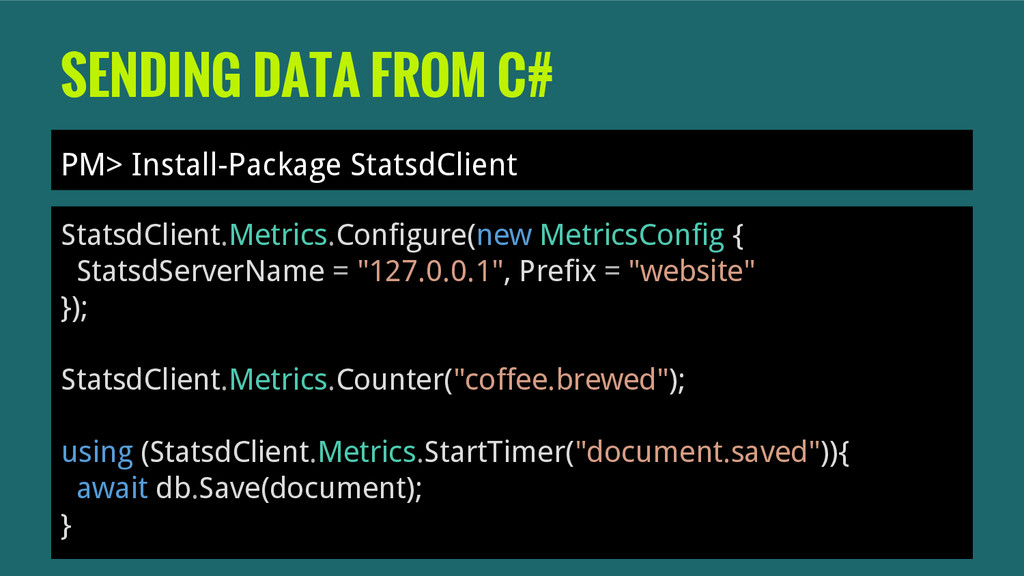
Code examples will be in C# but technology demonstrated is not limited to this.