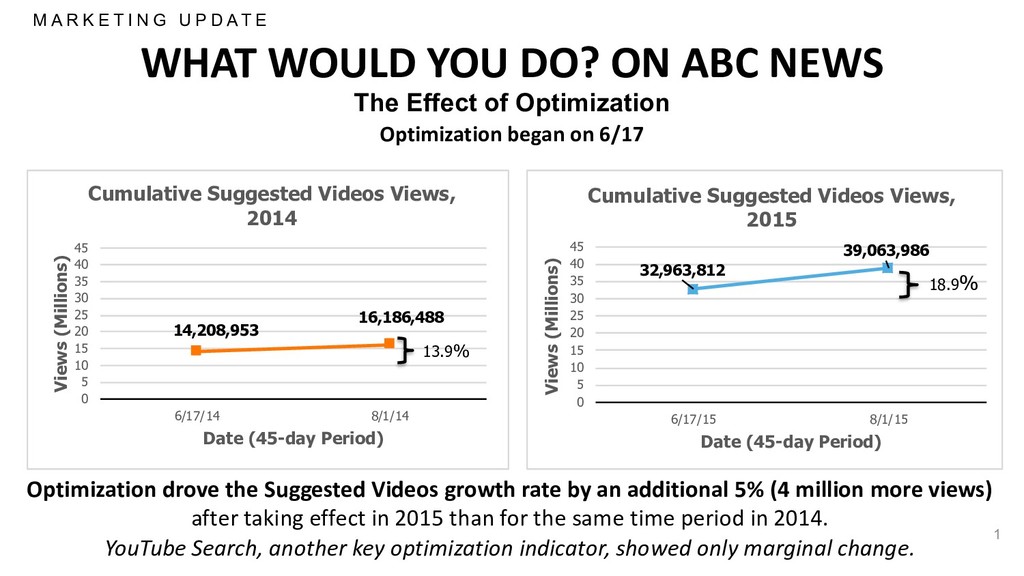
K E T I N G U P D A T E 1 The Effect of Optimization Optimization began on 6/17 Optimization drove the Suggested Videos growth rate by an additional 5% (4 million more views) after taking effect in 2015 than for the same time period in 2014. YouTube Search, another key optimization indicator, showed only marginal change. 14,208,953 16,186,488 0 5 10 15 20 25 30 35 40 45 6/17/14 8/1/14 Views (Millions) Date (45-day Period) Cumulative Suggested Videos Views, 2014 32,963,812 39,063,986 0 5 10 15 20 25 30 35 40 45 6/17/15 8/1/15 Views (Millions) Date (45-day Period) Cumulative Suggested Videos Views, 2015 18.9% 13.9%
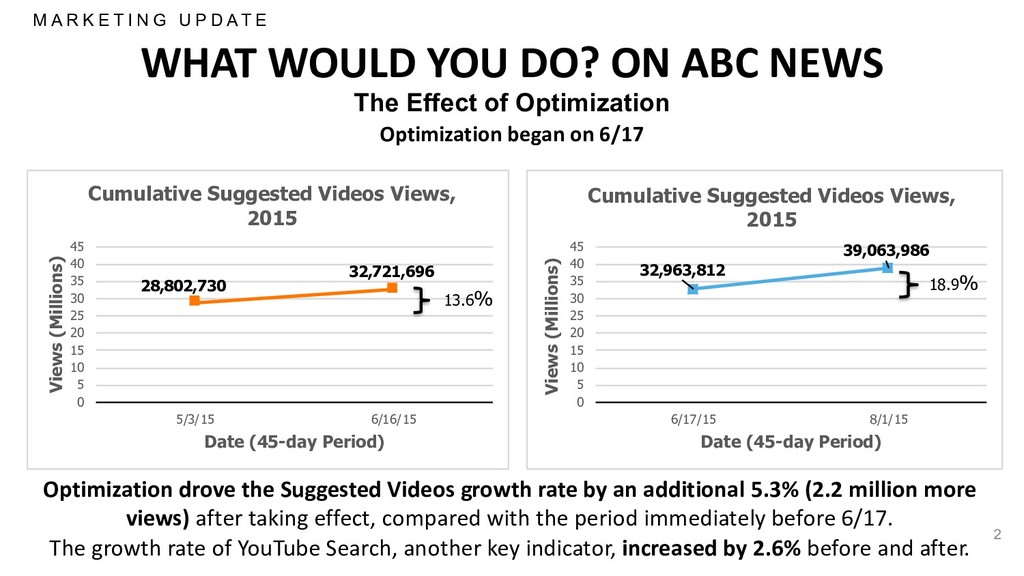
K E T I N G U P D A T E 2 The Effect of Optimization Optimization began on 6/17 Optimization drove the Suggested Videos growth rate by an additional 5.3% (2.2 million more views) after taking effect, compared with the period immediately before 6/17. The growth rate of YouTube Search, another key indicator, increased by 2.6% before and after. 32,963,812 39,063,986 0 5 10 15 20 25 30 35 40 45 6/17/15 8/1/15 Views (Millions) Date (45-day Period) Cumulative Suggested Videos Views, 2015 18.9% 13.9% 28,802,730 32,721,696 0 5 10 15 20 25 30 35 40 45 5/3/15 6/16/15 Views (Millions) Date (45-day Period) Cumulative Suggested Videos Views, 2015 13.6%
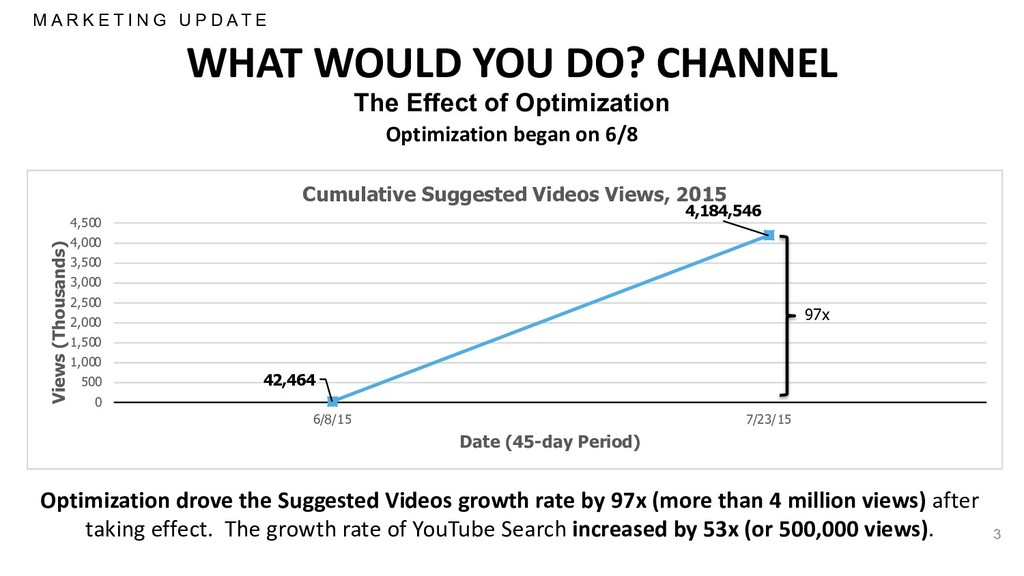
T I N G U P D A T E 3 The Effect of Optimization Optimization began on 6/8 Optimization drove the Suggested Videos growth rate by 97x (more than 4 million views) after taking effect. The growth rate of YouTube Search increased by 53x (or 500,000 views). 13.9% 42,464 4,184,546 0 500 1,000 1,500 2,000 2,500 3,000 3,500 4,000 4,500 6/8/15 7/23/15 Views (Thousands) Date (45-day Period) Cumulative Suggested Videos Views, 2015 97x