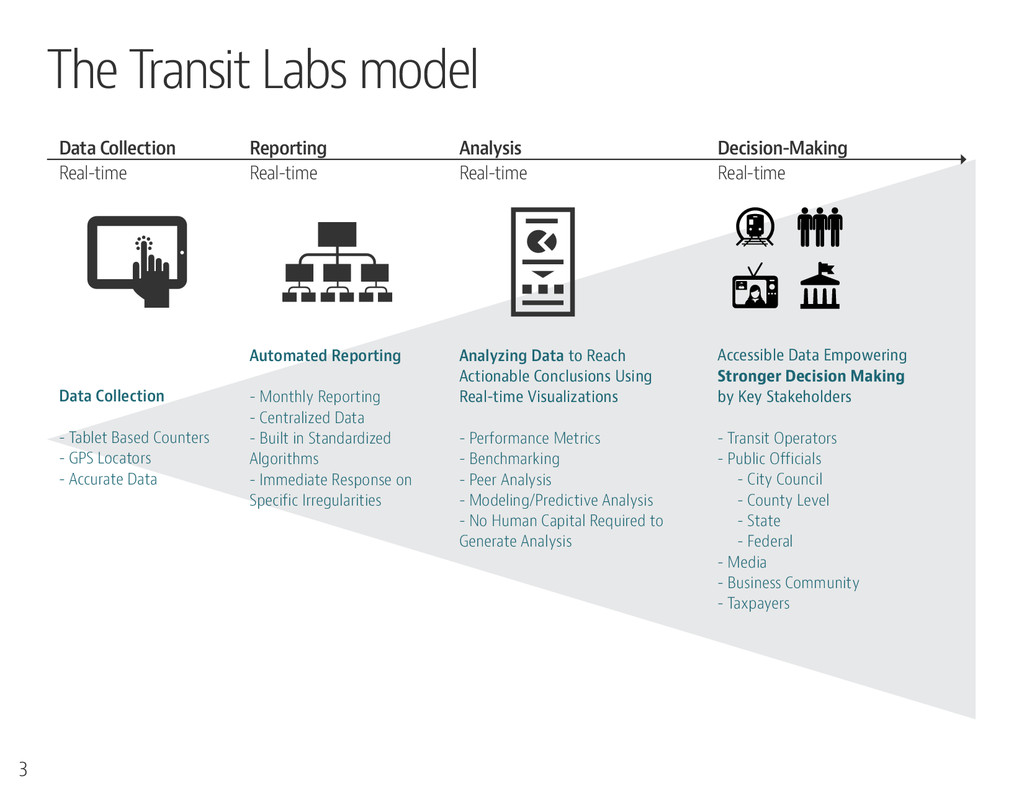
- GPS Locators - Accurate Data Automated Reporting - Monthly Reporting - Centralized Data - Built in Standardized Algorithms - Immediate Response on Specific Irregularities Analyzing Data to Reach Actionable Conclusions Using Real-time Visualizations - Performance Metrics - Benchmarking - Peer Analysis - Modeling/Predictive Analysis - No Human Capital Required to Generate Analysis Accessible Data Empowering Stronger Decision Making by Key Stakeholders - Transit Operators - Public Officials - City Council - County Level - State - Federal - Media - Business Community - Taxpayers Data Collection Real-time Reporting Real-time Analysis Real-time Decision-Making Real-time 3
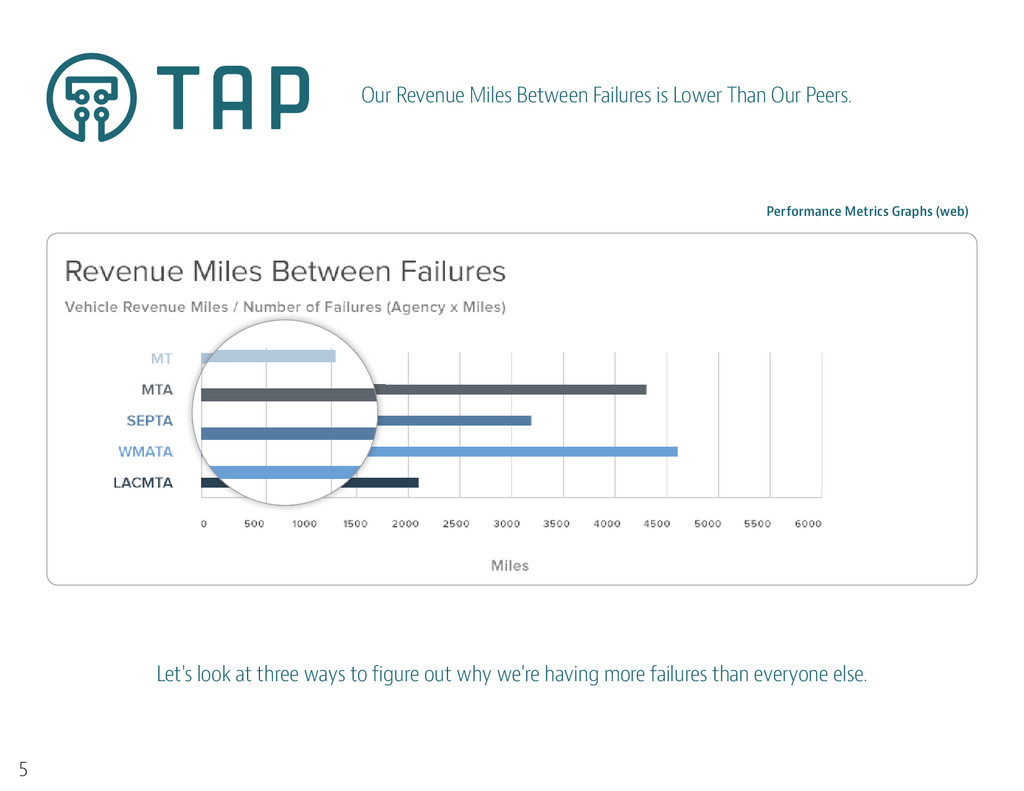
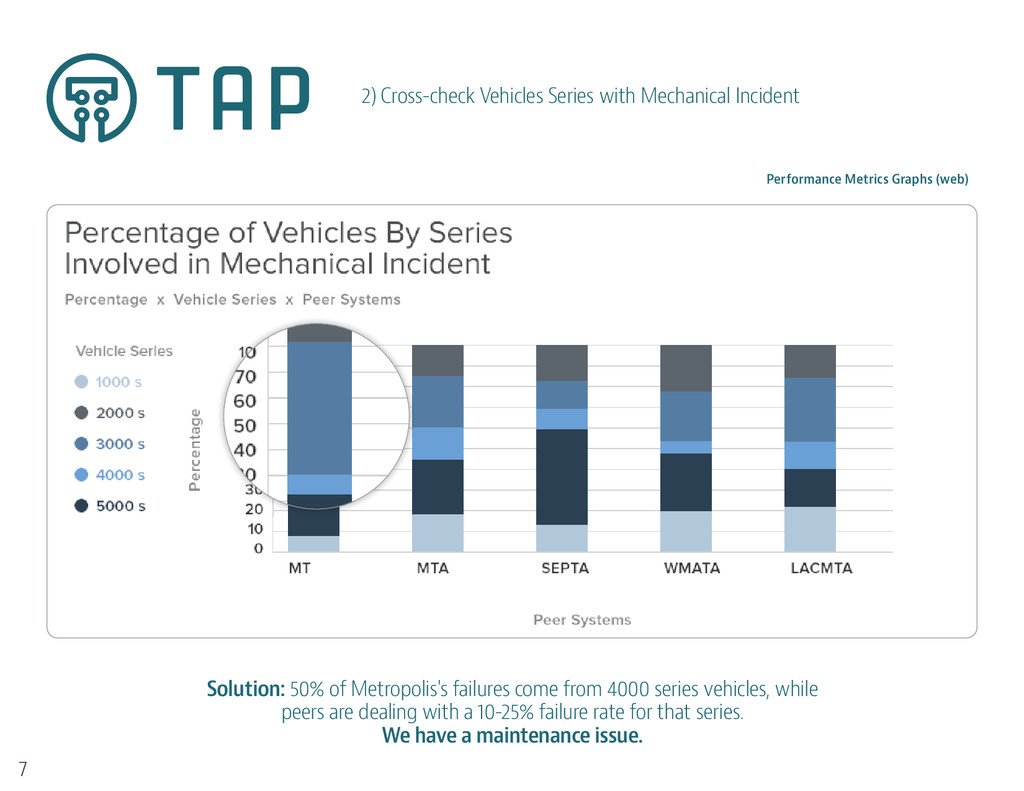
Metropolis's failures come from 4000 series vehicles, while peers are dealing with a 10-25% failure rate for that series. We have a maintenance issue. Performance Metrics Graphs (web) 7
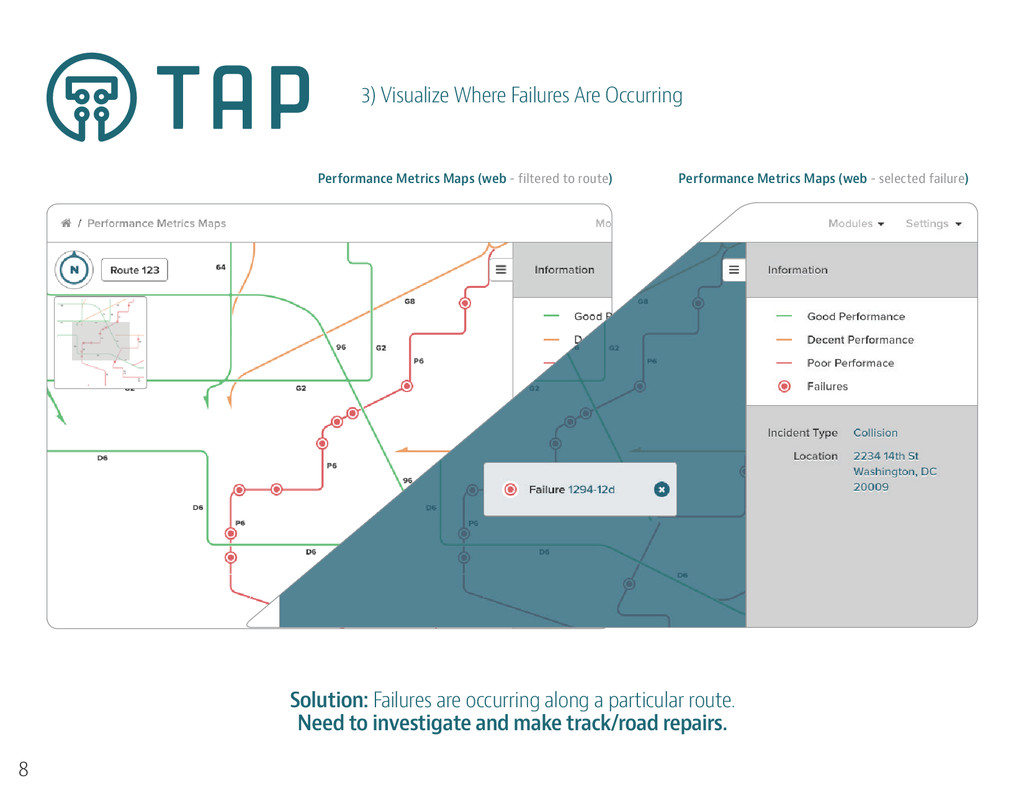
along a particular route. Need to investigate and make track/road repairs. Performance Metrics Maps (web - selected failure) Performance Metrics Maps (web - filtered to route) 8
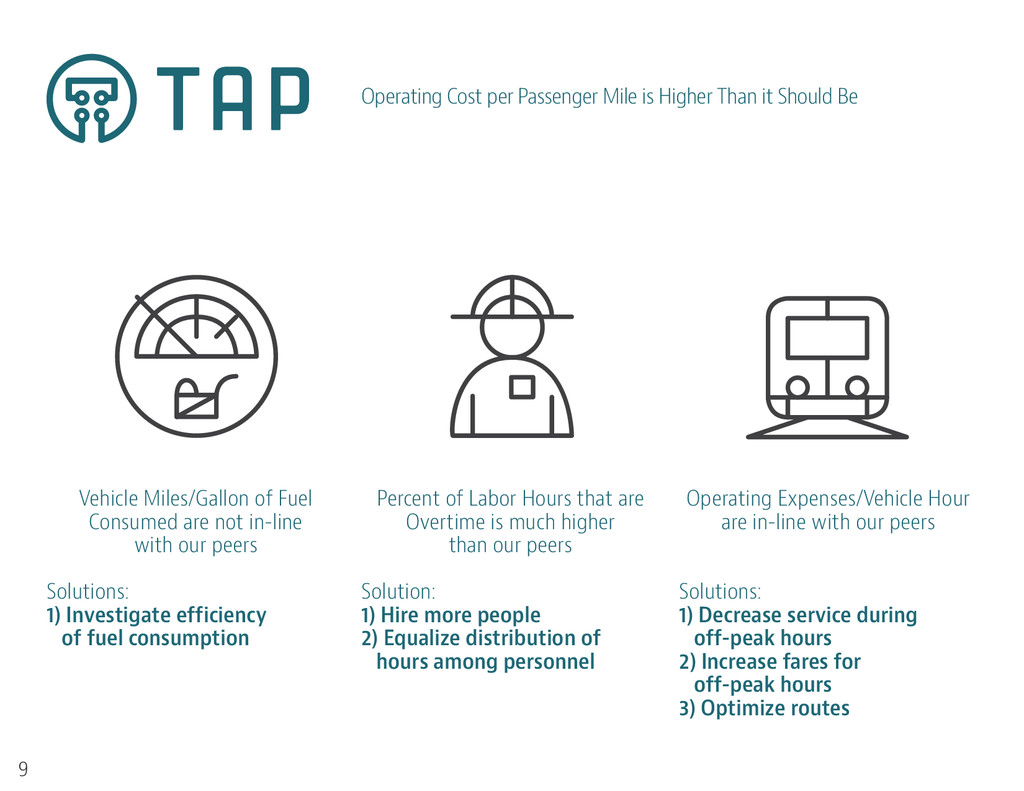
Be Vehicle Miles/Gallon of Fuel Consumed are not in-line with our peers Solutions: 1) Investigate efficiency of fuel consumption Percent of Labor Hours that are Overtime is much higher than our peers Solution: 1) Hire more people 2) Equalize distribution of hours among personnel Operating Expenses/Vehicle Hour are in-line with our peers Solutions: 1) Decrease service during off-peak hours 2) Increase fares for off-peak hours 3) Optimize routes 9