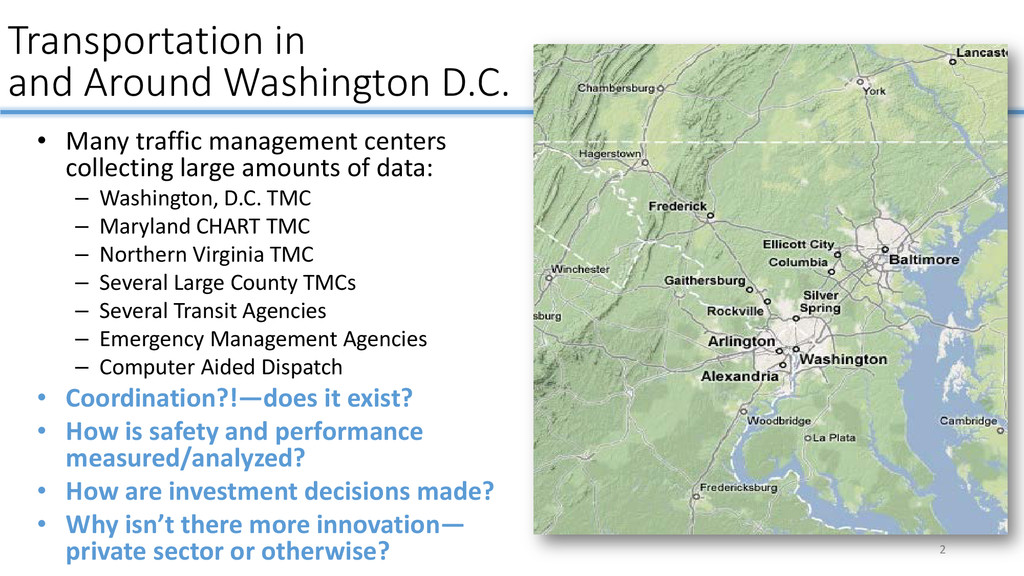
– Washington, D.C. TMC – Maryland CHART TMC – Northern Virginia TMC – Several Large County TMCs – Several Transit Agencies – Emergency Management Agencies – Computer Aided Dispatch • Coordination?!—does it exist? • How is safety and performance measured/analyzed? • How are investment decisions made? • Why isn’t there more innovation— private sector or otherwise? Transportation in and Around Washington D.C. 2
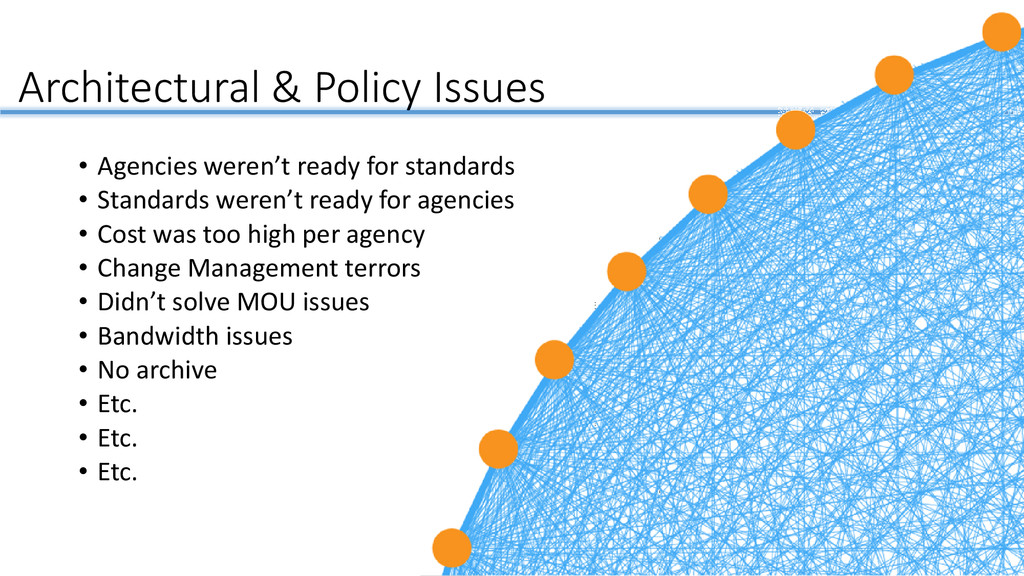
• Standards weren’t ready for agencies • Cost was too high per agency • Change Management terrors • Didn’t solve MOU issues • Bandwidth issues • No archive • Etc. • Etc. • Etc.
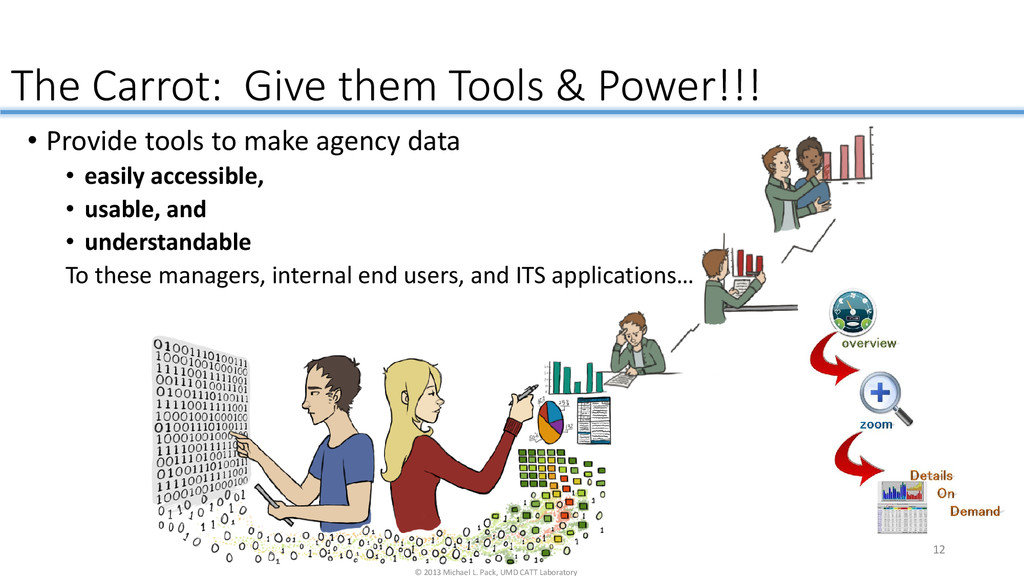
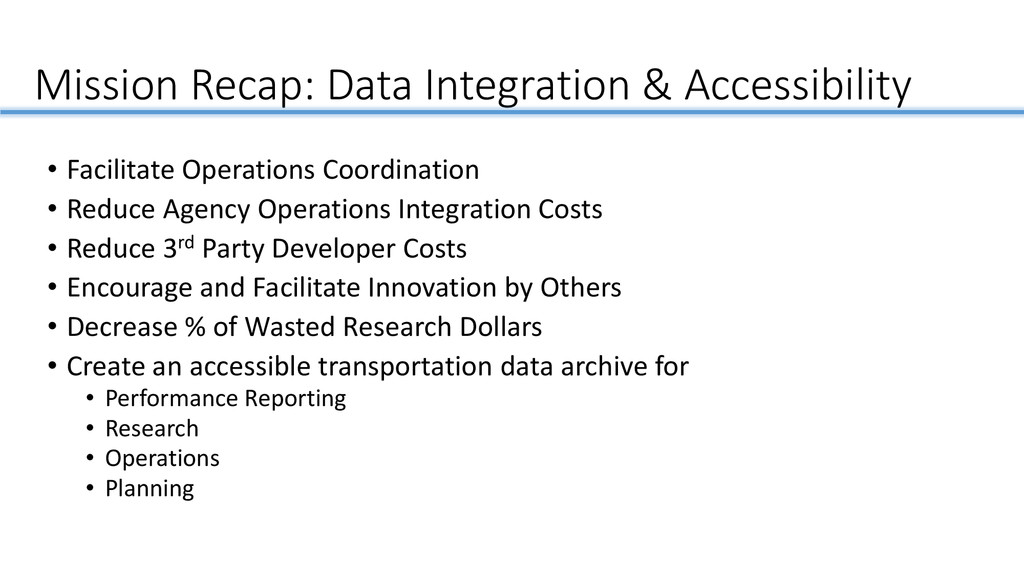
Operations Integration Costs • Reduce 3rd Party Developer Costs • Encourage and Facilitate Innovation by Others • Create an accessible transportation data archive for • Performance Reporting • Research • Operations • Planning • Decrease % of Wasted Research Dollars
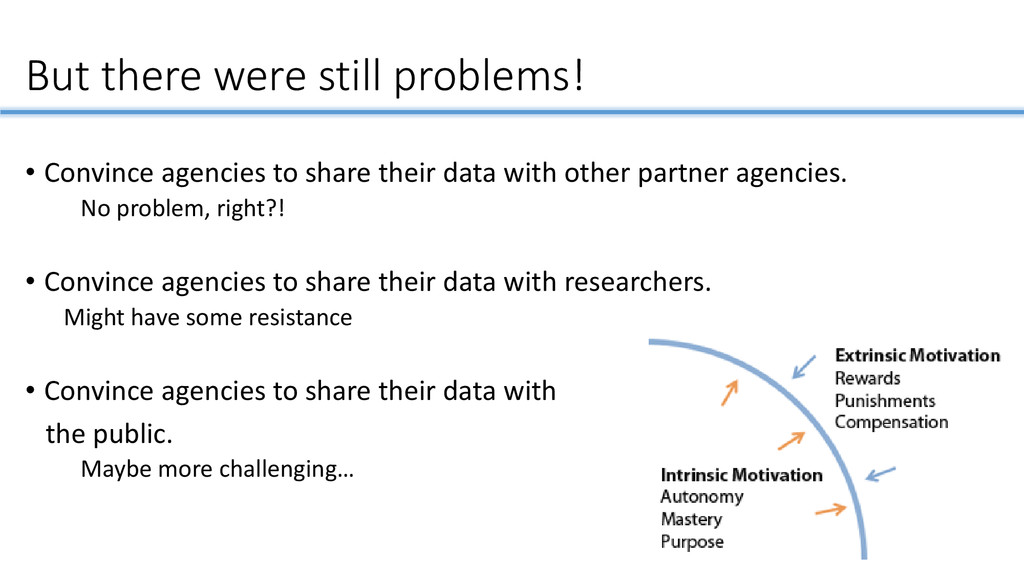
their data with other partner agencies. No problem, right?! • Convince agencies to share their data with researchers. Might have some resistance • Convince agencies to share their data with the public. Maybe more challenging…
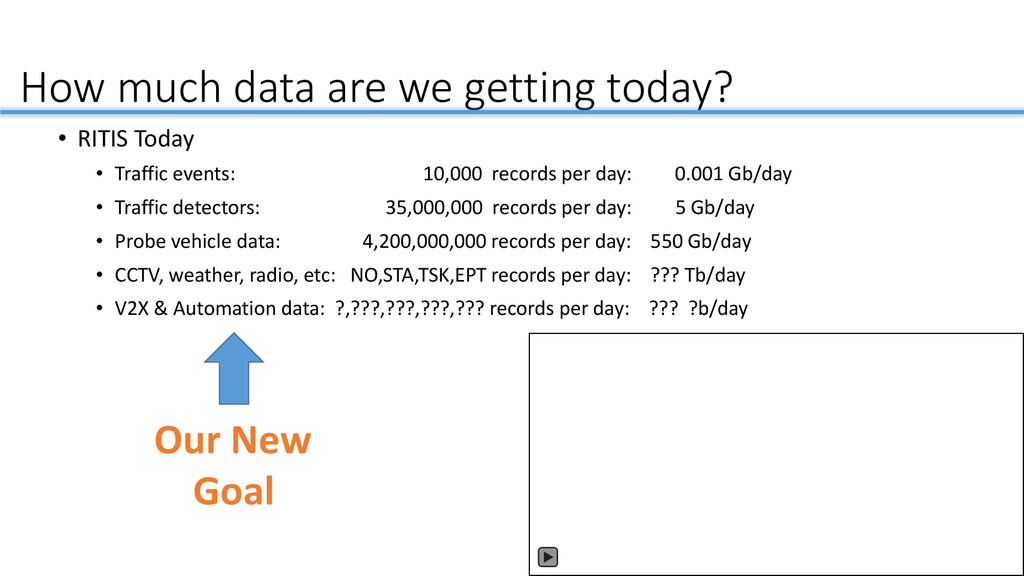
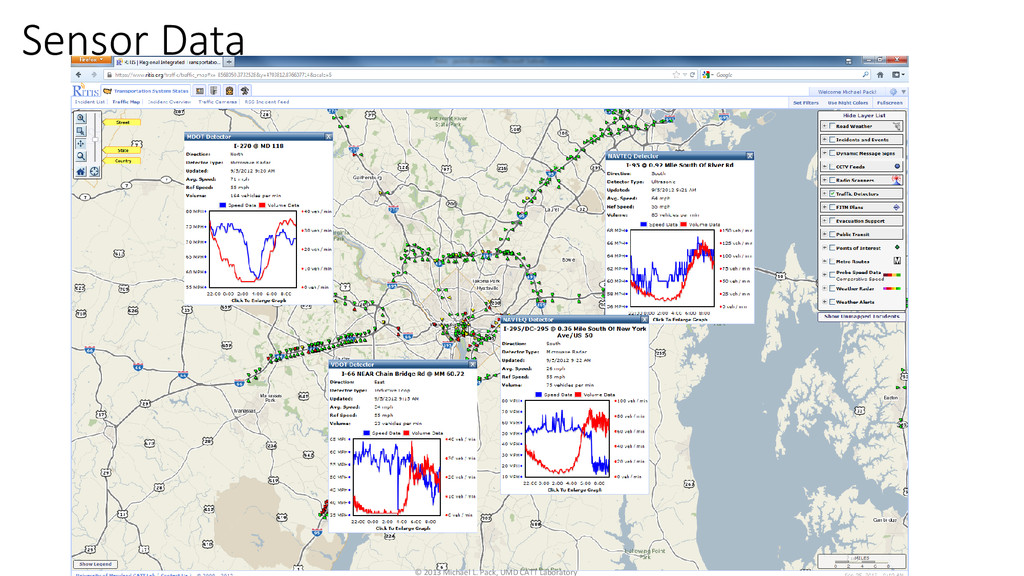
• Traffic events: 10,000 records per day: 0.001 Gb/day • Traffic detectors: 35,000,000 records per day: 5 Gb/day • Probe vehicle data: 4,200,000,000 records per day: 550 Gb/day • CCTV, weather, radio, etc: NO,STA,TSK,EPT records per day: ??? Tb/day • V2X & Automation data: ?,???,???,???,??? records per day: ??? ?b/day Our New Goal
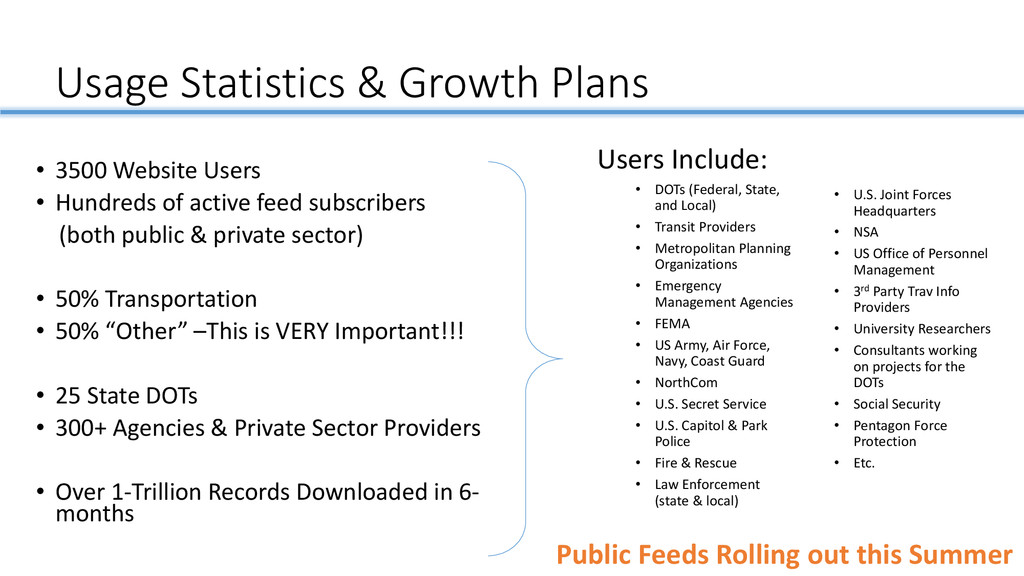
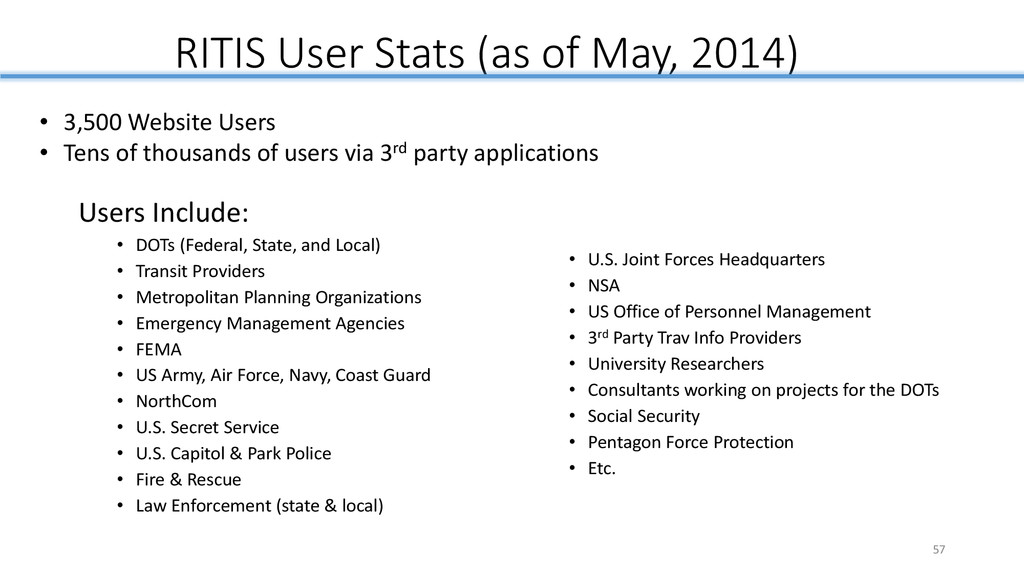
Hundreds of active feed subscribers (both public & private sector) • 50% Transportation • 50% “Other” –This is VERY Important!!! • 25 State DOTs • 300+ Agencies & Private Sector Providers • Over 1-Trillion Records Downloaded in 6- months Public Feeds Rolling out this Summer Users Include: • DOTs (Federal, State, and Local) • Transit Providers • Metropolitan Planning Organizations • Emergency Management Agencies • FEMA • US Army, Air Force, Navy, Coast Guard • NorthCom • U.S. Secret Service • U.S. Capitol & Park Police • Fire & Rescue • Law Enforcement (state & local) • U.S. Joint Forces Headquarters • NSA • US Office of Personnel Management • 3rd Party Trav Info Providers • University Researchers • Consultants working on projects for the DOTs • Social Security • Pentagon Force Protection • Etc.
• Reduce Agency Operations Integration Costs • Reduce 3rd Party Developer Costs • Encourage and Facilitate Innovation by Others • Decrease % of Wasted Research Dollars • Create an accessible transportation data archive for • Performance Reporting • Research • Operations • Planning
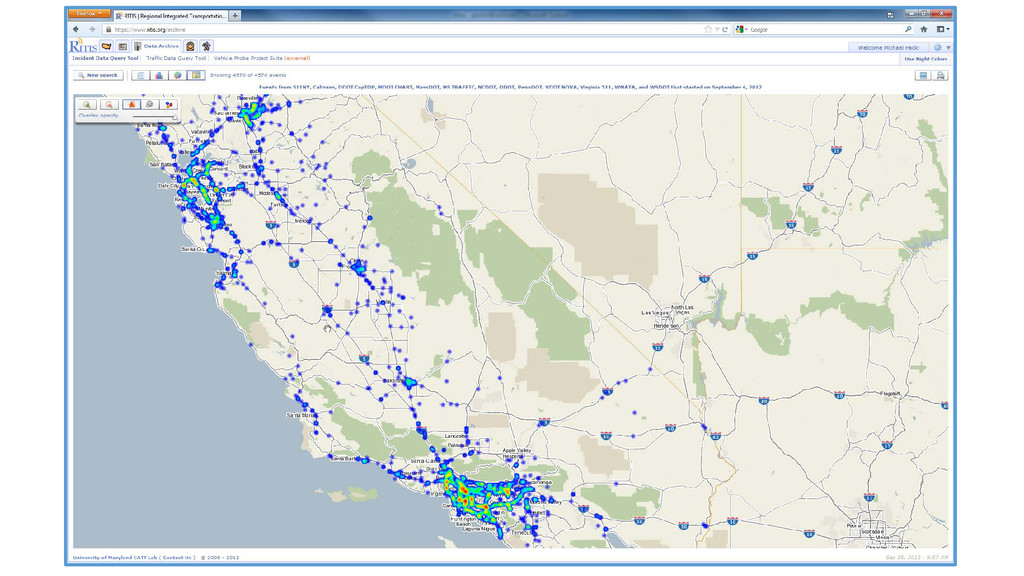
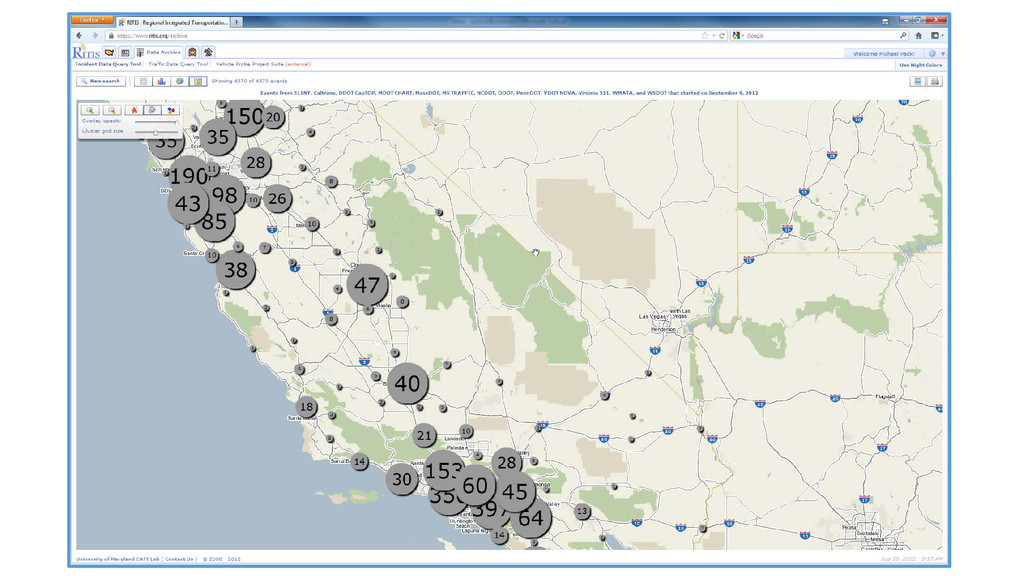
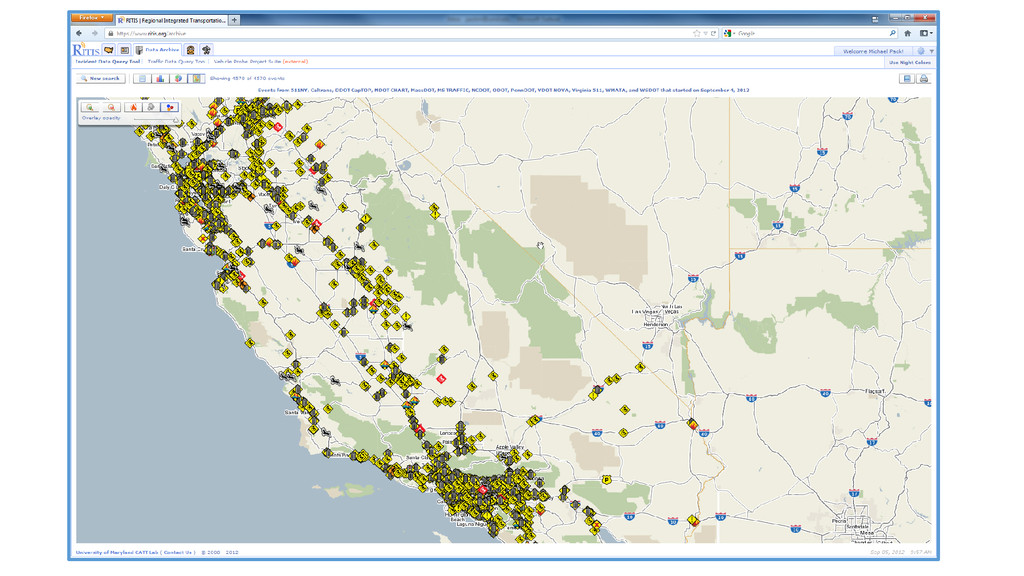
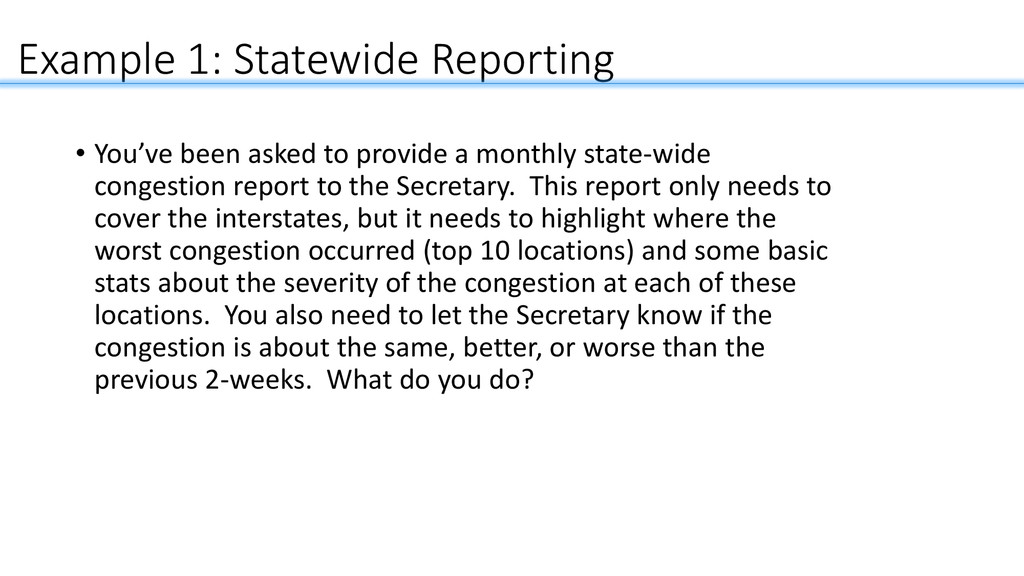
a monthly state-wide congestion report to the Secretary. This report only needs to cover the interstates, but it needs to highlight where the worst congestion occurred (top 10 locations) and some basic stats about the severity of the congestion at each of these locations. You also need to let the Secretary know if the congestion is about the same, better, or worse than the previous 2-weeks. What do you do?
DOTs (Federal, State, and Local) • Transit Providers • Metropolitan Planning Organizations • Emergency Management Agencies • FEMA • US Army, Air Force, Navy, Coast Guard • NorthCom • U.S. Secret Service • U.S. Capitol & Park Police • Fire & Rescue • Law Enforcement (state & local) • U.S. Joint Forces Headquarters • NSA • US Office of Personnel Management • 3rd Party Trav Info Providers • University Researchers • Consultants working on projects for the DOTs • Social Security • Pentagon Force Protection • Etc. • 3,500 Website Users • Tens of thousands of users via 3rd party applications 57
![Questions & Discussion Michael L. Pack [email protected] 301.405.0722 Come see](https://files.speakerdeck.com/presentations/a2bccc00e04701317c6c120db79bfc5a/slide_18.jpg)