Upgrade to Pro — share decks privately, control downloads, hide ads and more …

Charting Best Practices

Charting Best Practices

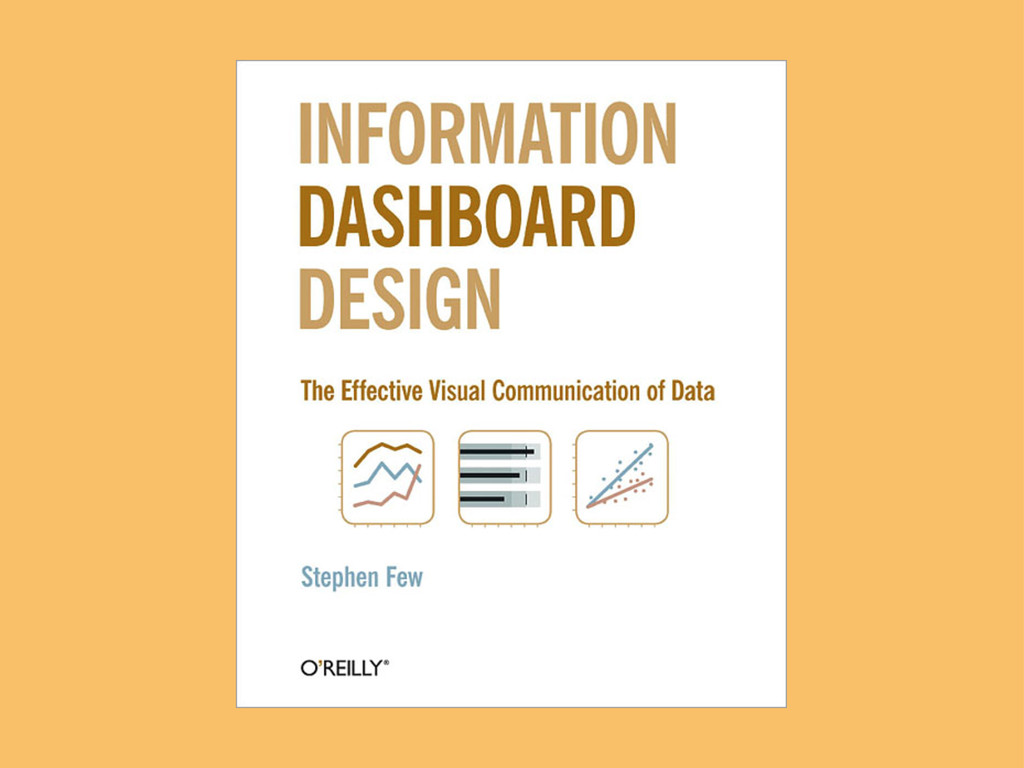
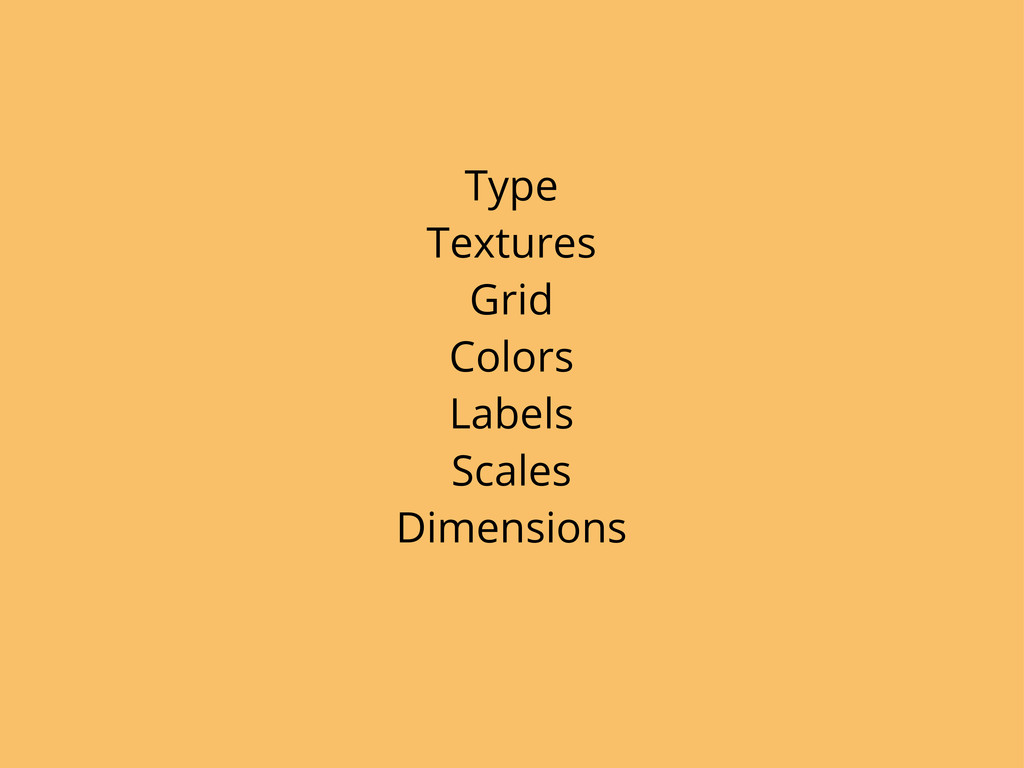
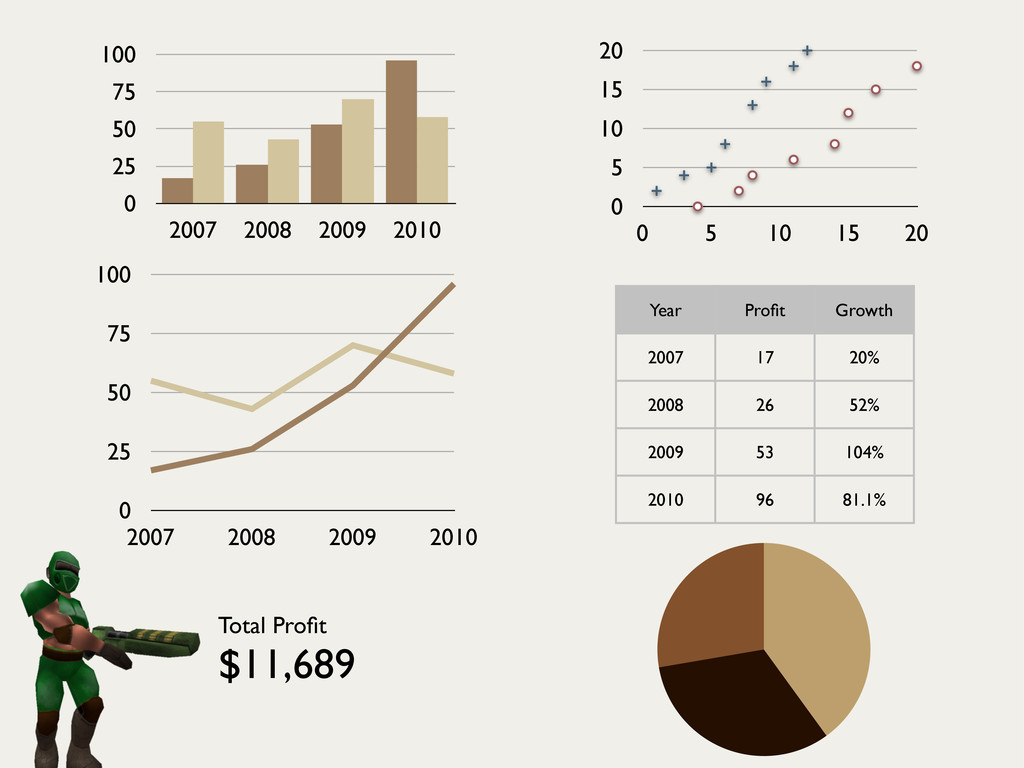
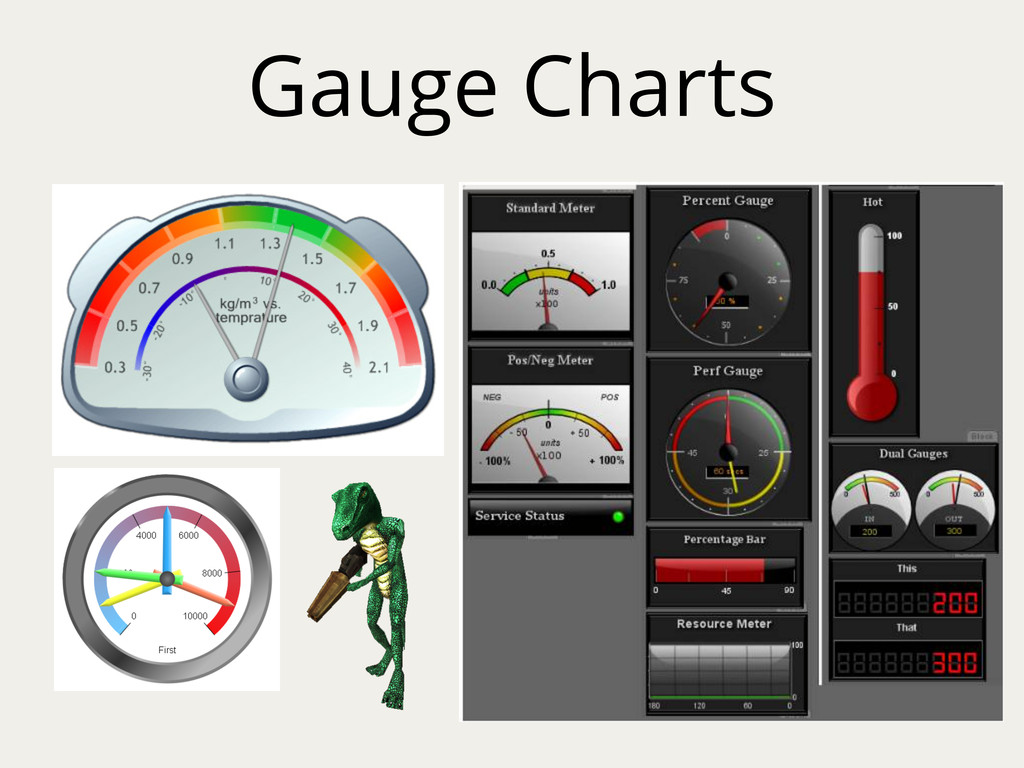
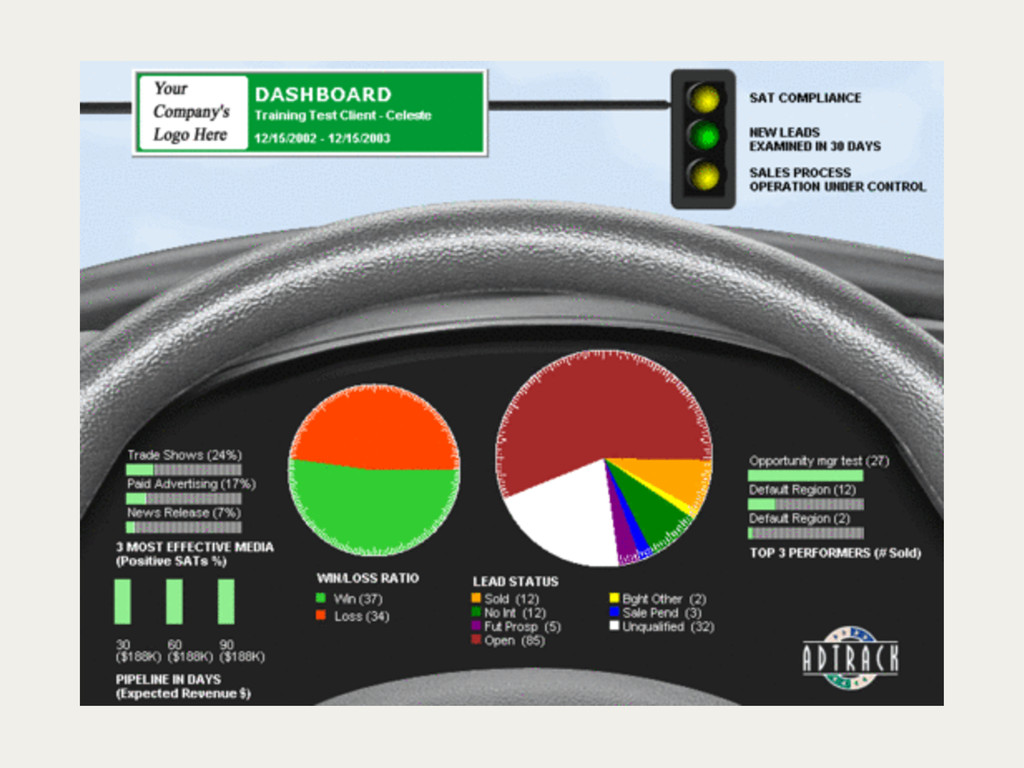
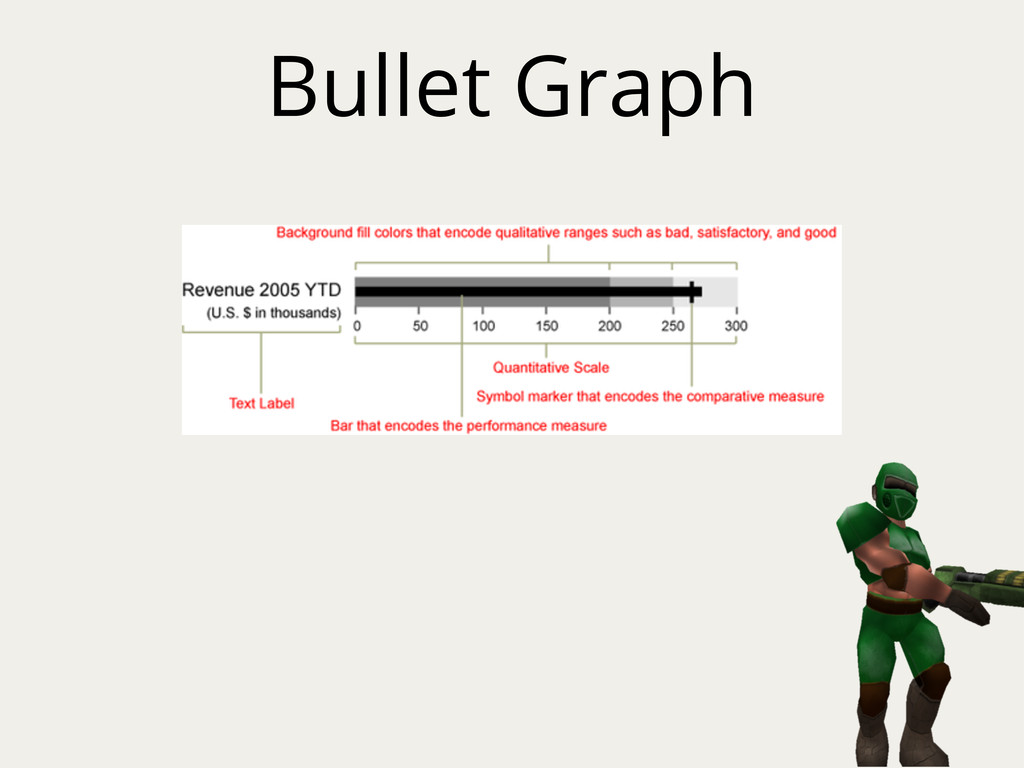
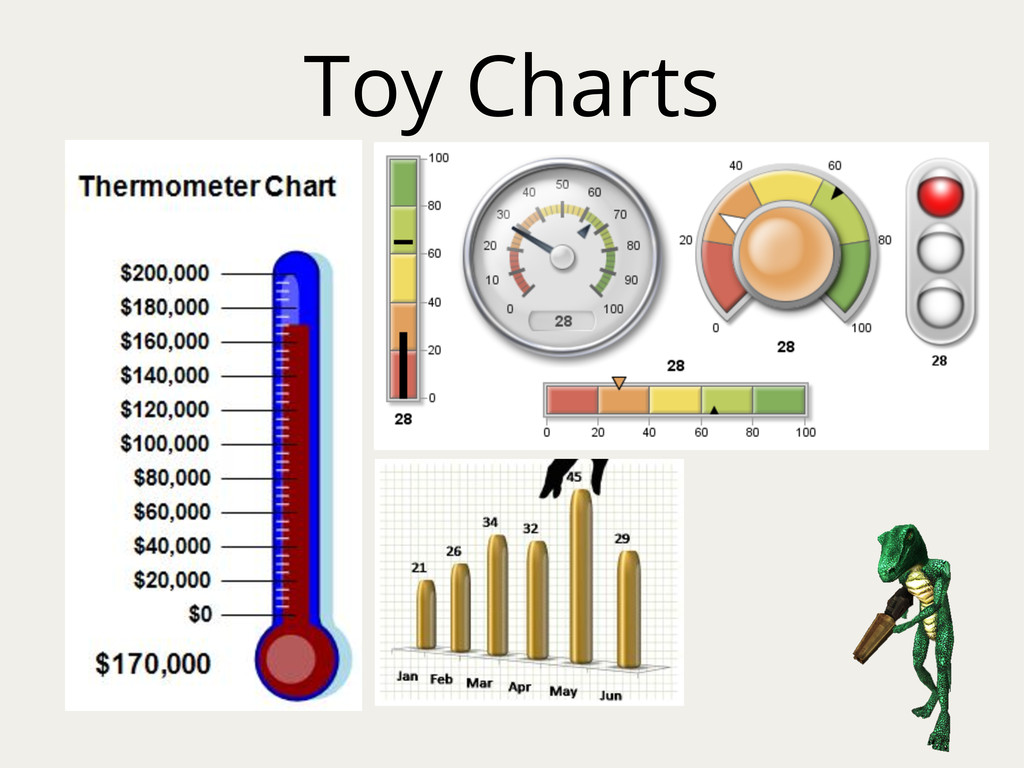
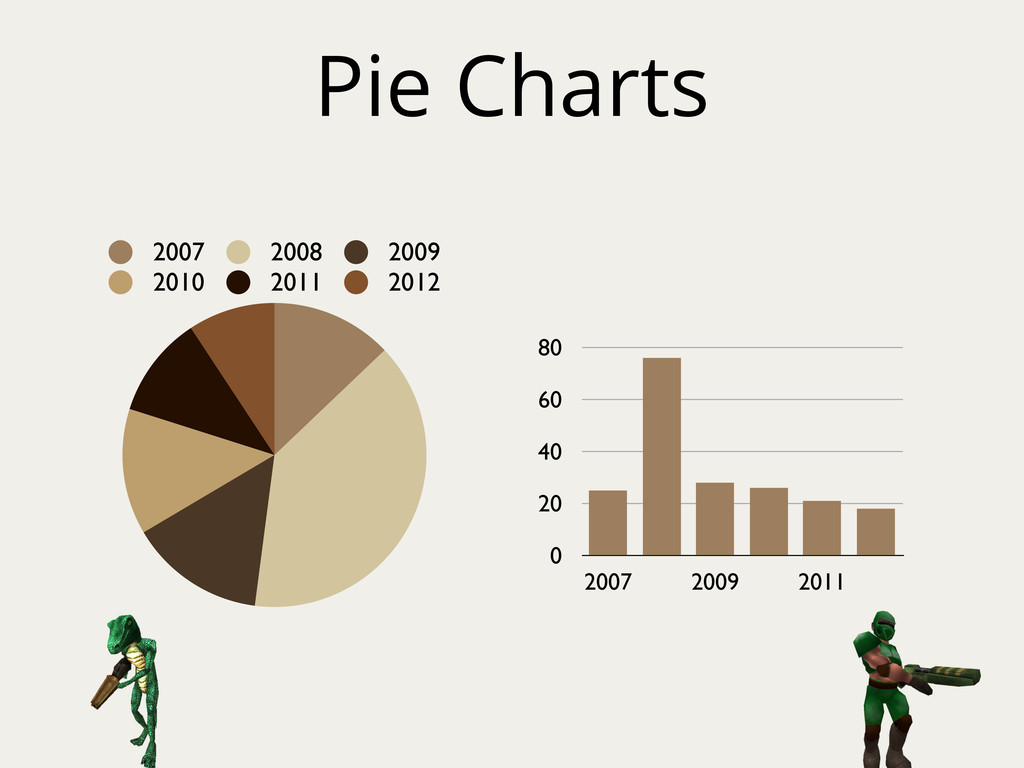
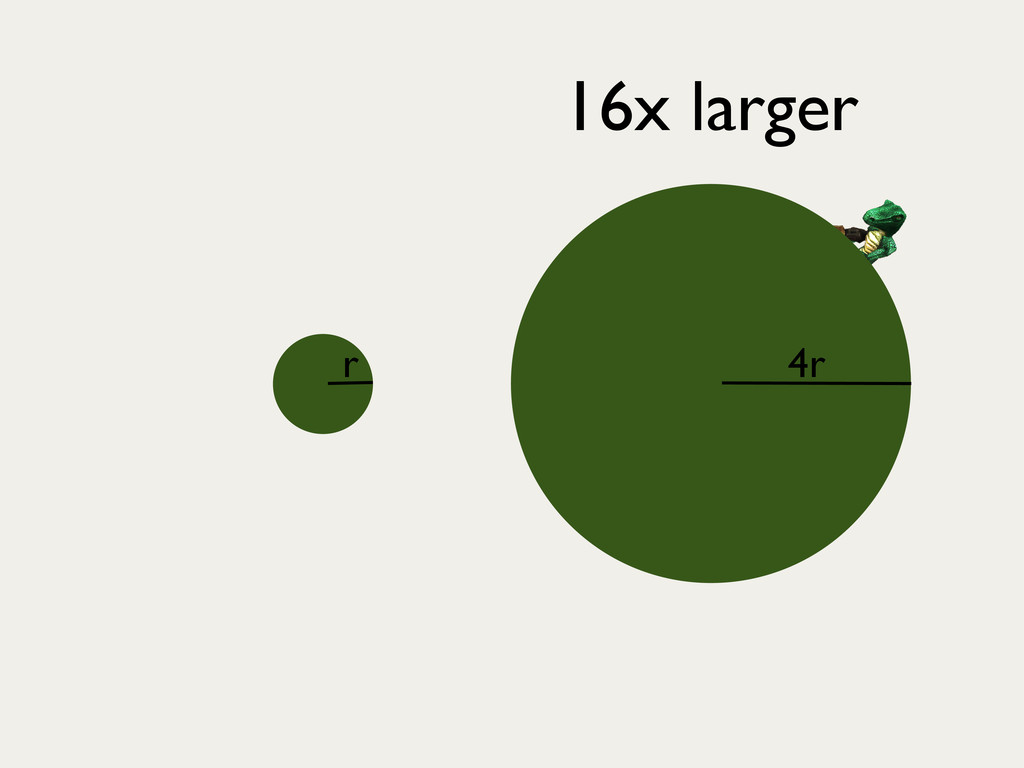
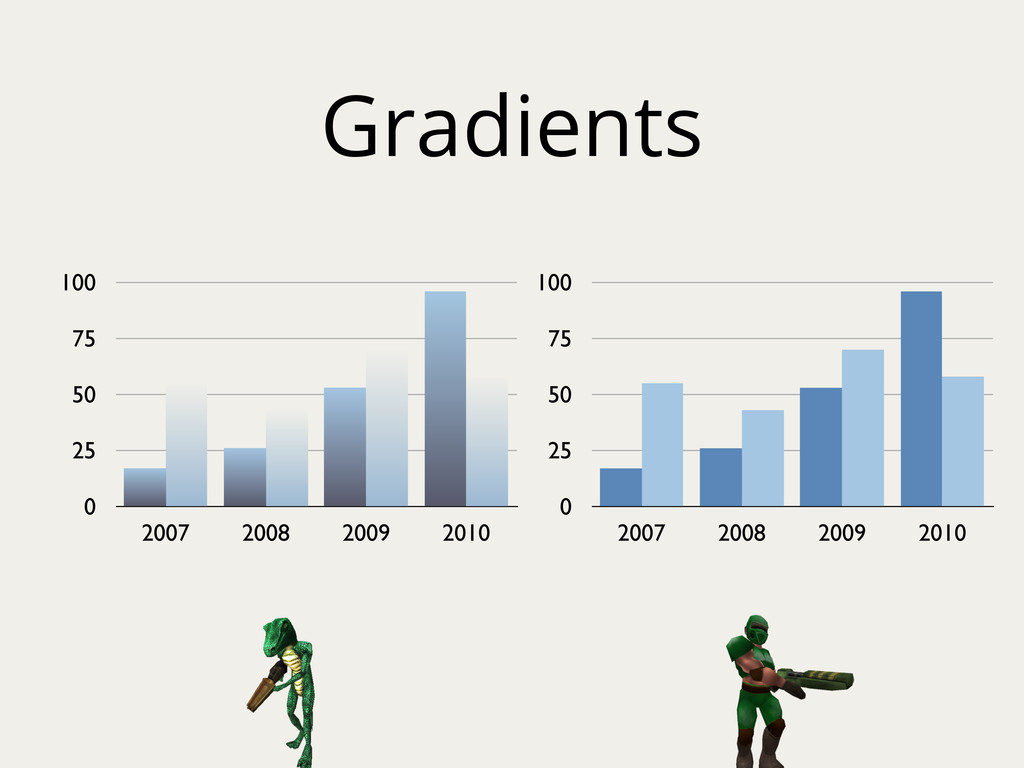
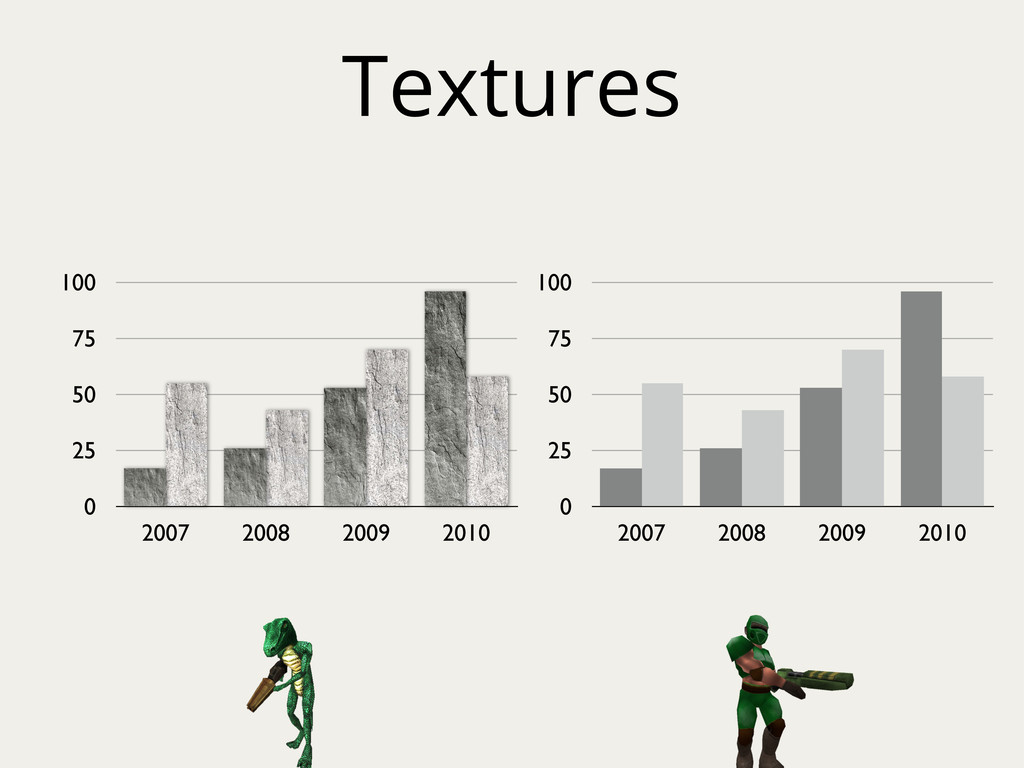
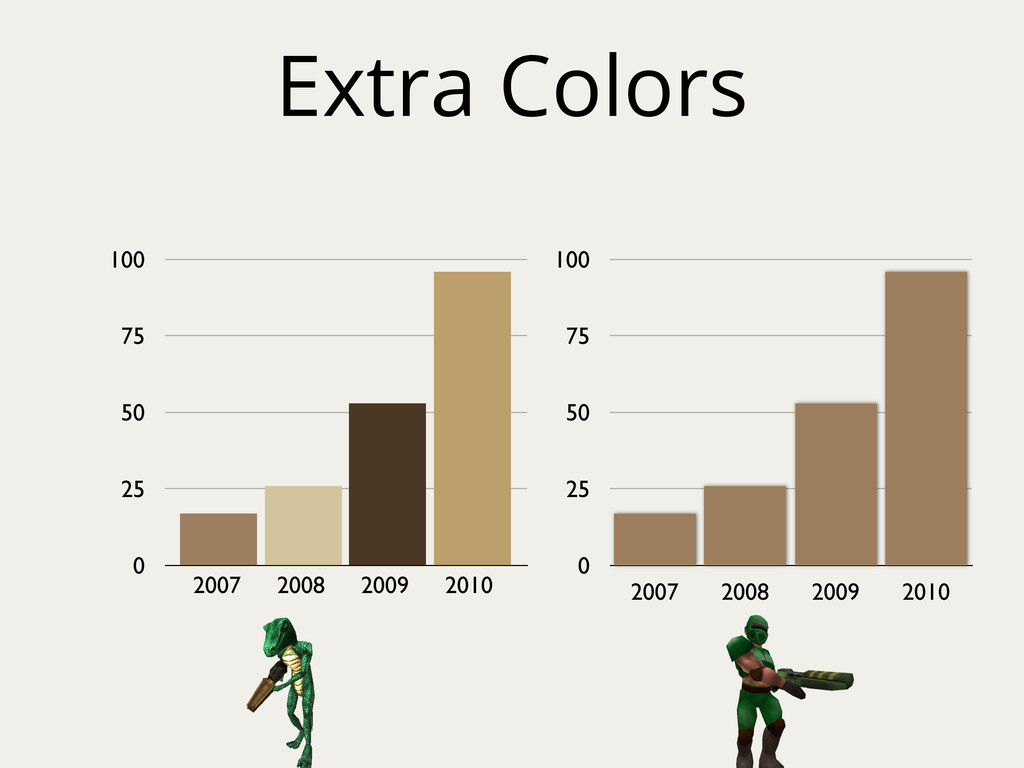
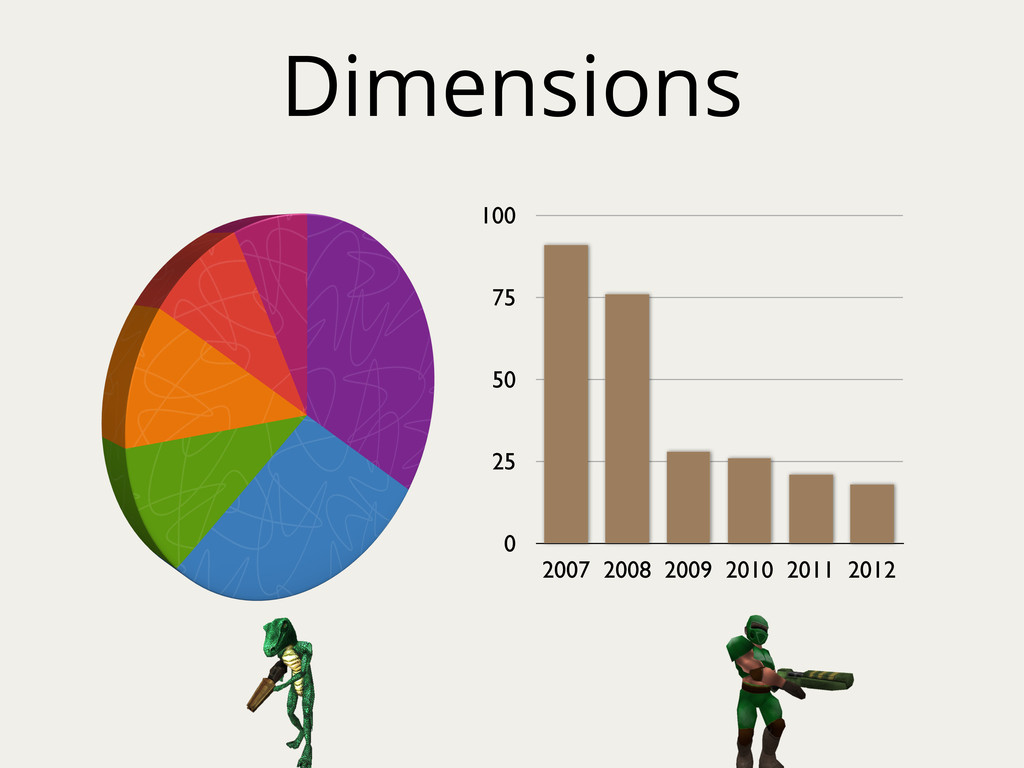
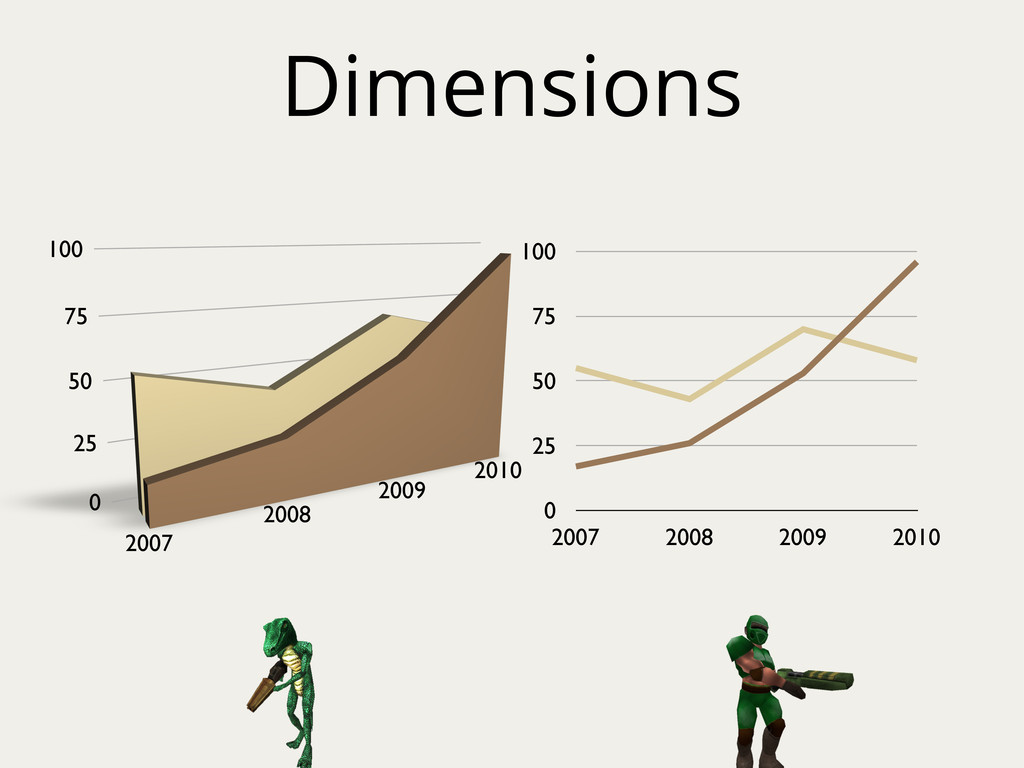
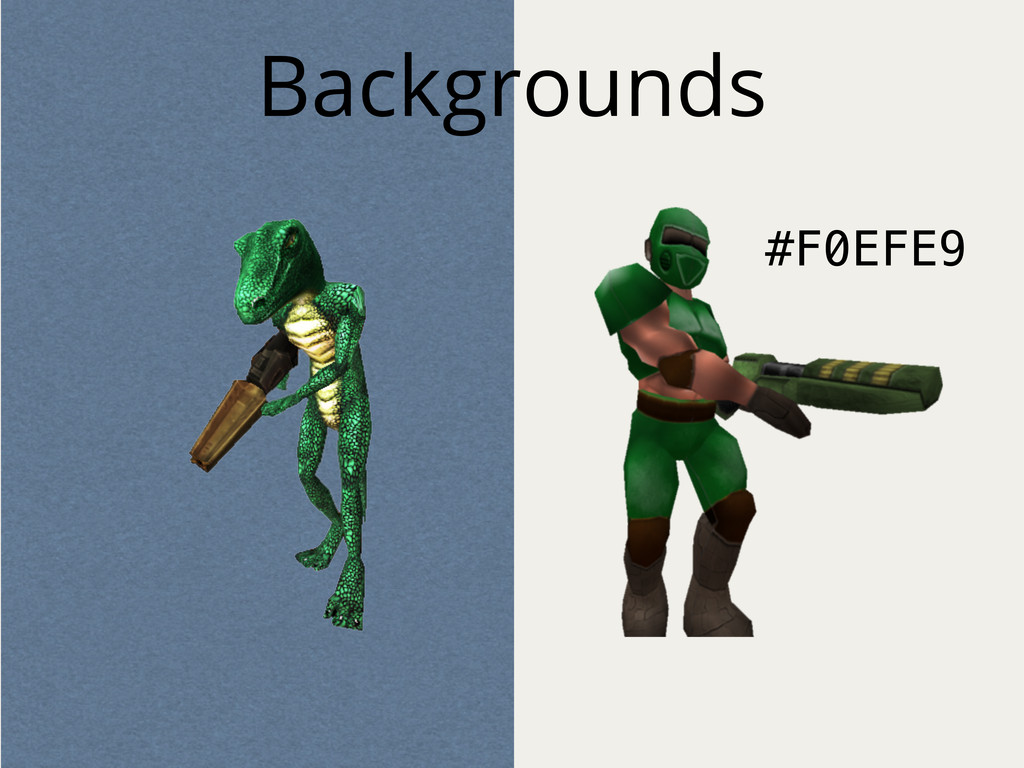
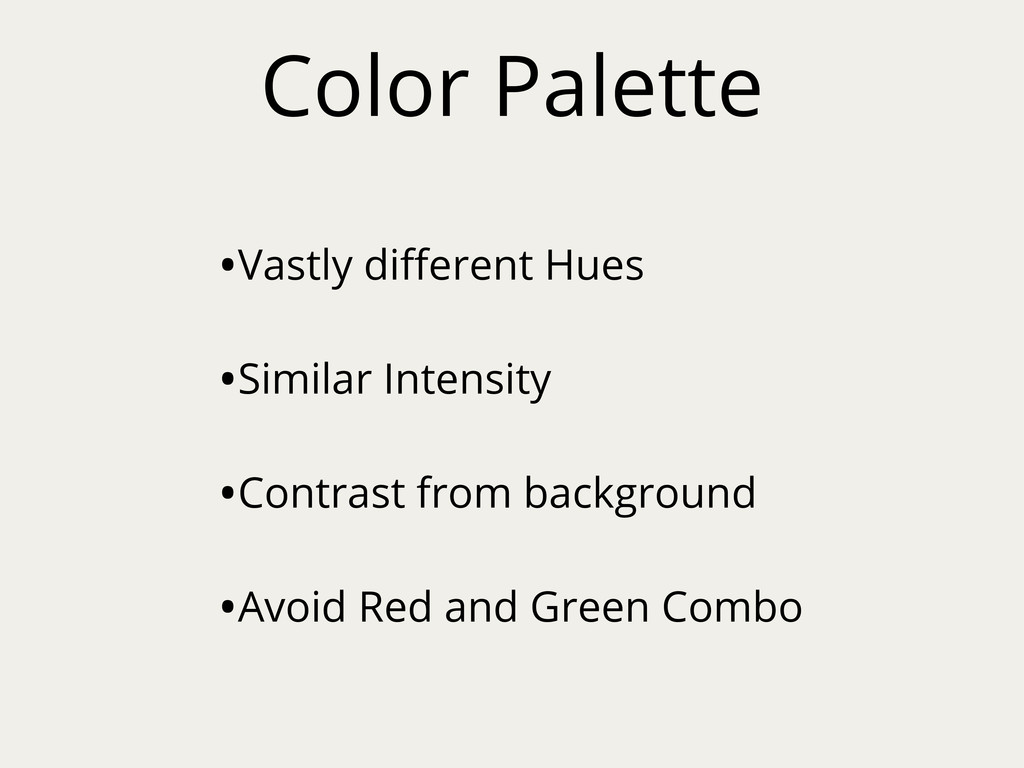
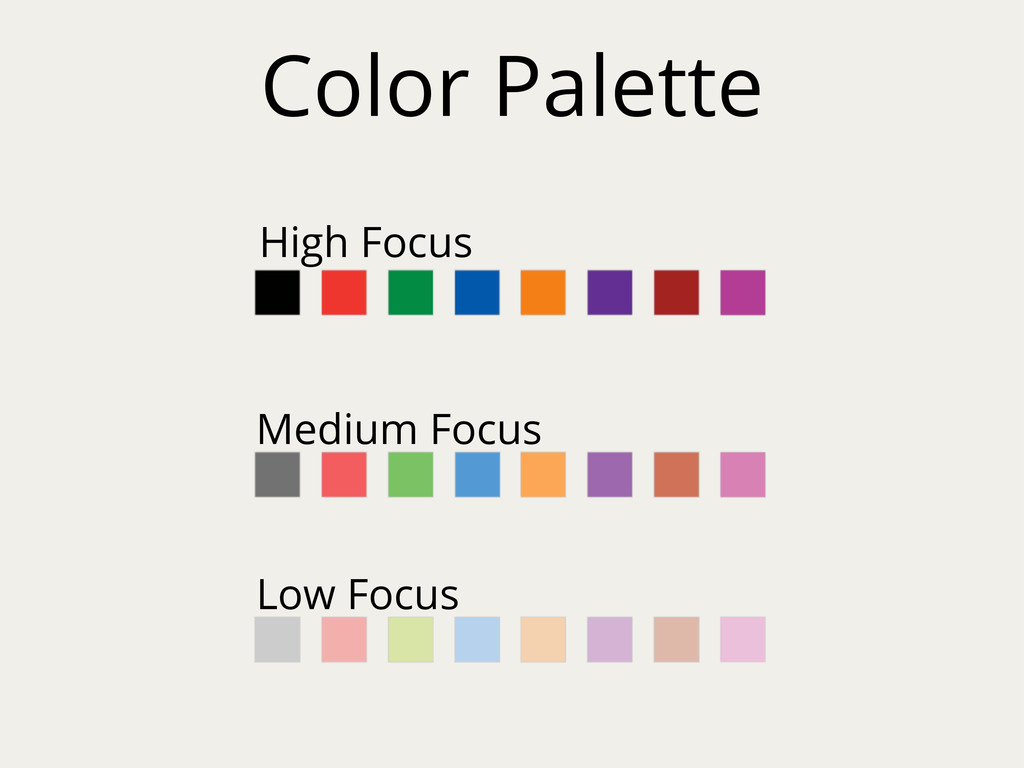
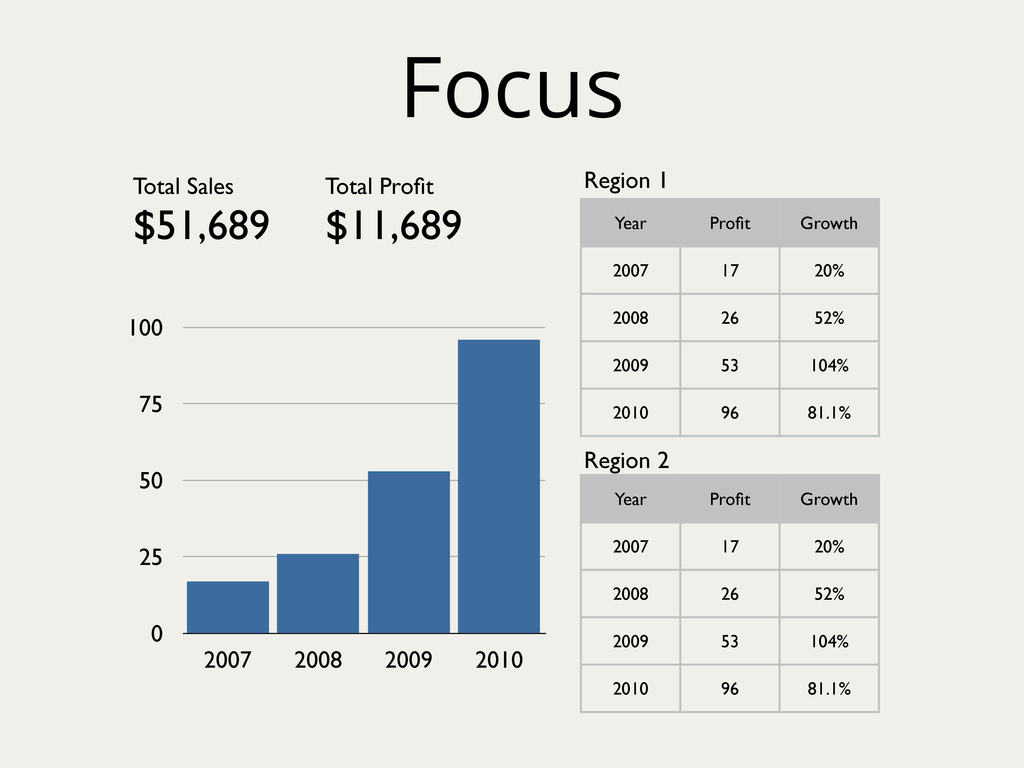
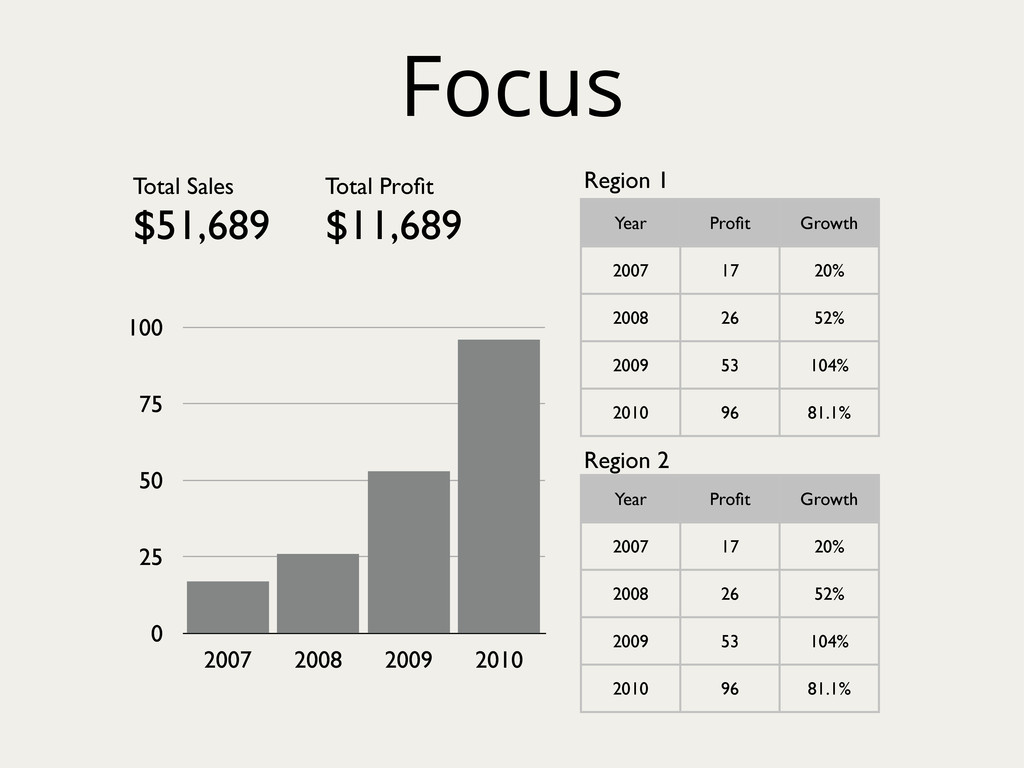
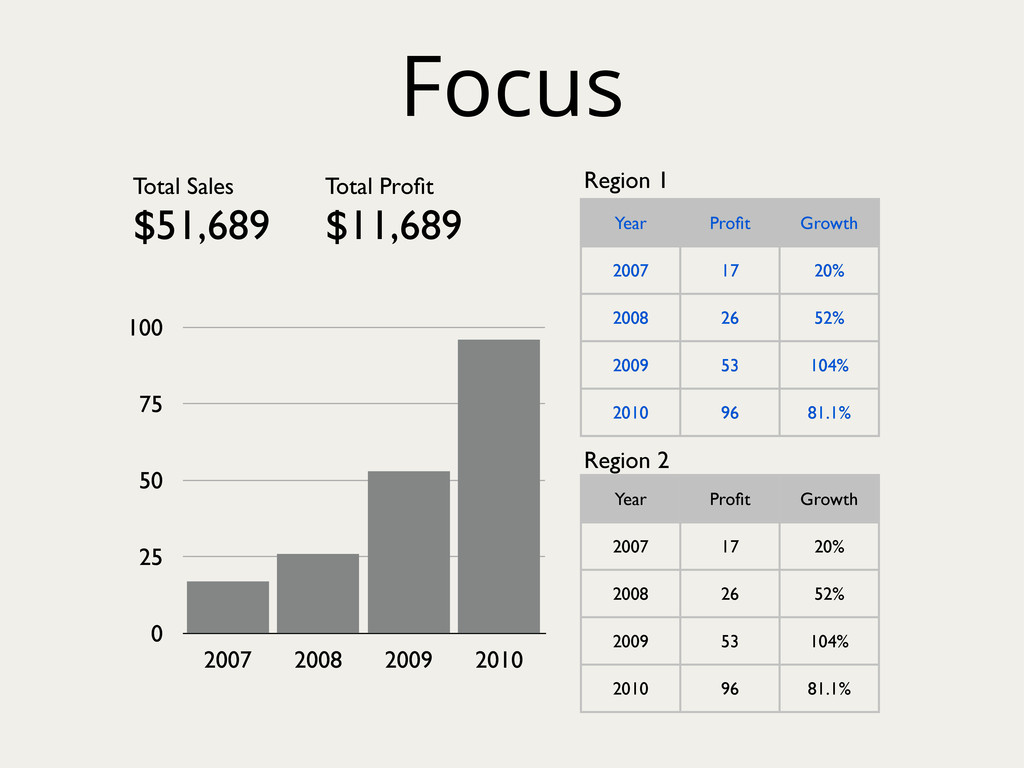
I do an overview of the basics of charting best practices: when to use color, where to use it, what attributes not to use, what charts are appropriate for which occasions, and why you shouldn't use pie charts.

Avatar for Dave Fowler

Dave Fowler

January 15, 2013
Tweet

Other Decks in Technology

Transcript

  1. Physics at Gustavus MS EE at U of MN IBM

    Rochester Y Combinator Chartio
  2. 0 25 50 75 100 2007 2008 2009 2010 0

    25 50 75 100 2007 2008 2009 2010 Year Profit Growth 2007 17 20% 2008 26 52% 2009 53 104% 2010 96 81.1% 0 5 10 15 20 0 5 10 15 20 Total Profit $11,689
  3. Pie Charts 0 20 40 60 80 2007 2009 2011

    2007 2008 2009 2010 2011 2012
  4. Gradients 0 25 50 75 100 2007 2008 2009 2010

    0 25 50 75 100 2007 2008 2009 2010
  5. Textures 0 25 50 75 100 2007 2008 2009 2010

    0 25 50 75 100 2007 2008 2009 2010
  6. Extra Colors 0 25 50 75 100 0 25 50

    75 100 2007 2008 2009 2010 2007 2008 2009 2010
  7. Dimensions 0 25 50 75 100 2007 2008 2009 2010

    0 25 50 75 100 2007 2008 2009 2010
  8. Focus 0 25 50 75 100 2007 2008 2009 2010

    Year Profit Growth 2007 17 20% 2008 26 52% 2009 53 104% 2010 96 81.1% Year Profit Growth 2007 17 20% 2008 26 52% 2009 53 104% 2010 96 81.1% Total Sales $51,689 Total Profit $11,689 Region 1 Region 2
  9. Focus 0 25 50 75 100 2007 2008 2009 2010

    Year Profit Growth 2007 17 20% 2008 26 52% 2009 53 104% 2010 96 81.1% Year Profit Growth 2007 17 20% 2008 26 52% 2009 53 104% 2010 96 81.1% Total Sales $51,689 Total Profit $11,689 Region 1 Region 2 Year Profit Growth 2007 17 20% 2008 26 52% 2009 53 104% 2010 96 81.1%
  10. Focus 0 25 50 75 100 2007 2008 2009 2010

    Year Profit Growth 2007 17 20% 2008 26 52% 2009 53 104% 2010 96 81.1% Year Profit Growth 2007 17 20% 2008 26 52% 2009 53 104% 2010 96 81.1% Total Sales $51,689 Total Profit $11,689 Region 1 Region 2 0 25 50 75 100 2007 2008 2009 2010
  11. Focus 0 25 50 75 100 2007 2008 2009 2010

    Year Profit Growth 2007 17 20% 2008 26 52% 2009 53 104% 2010 96 81.1% Year Profit Growth 2007 17 20% 2008 26 52% 2009 53 104% 2010 96 81.1% Total Sales $51,689 Total Profit $11,689 Region 1 Region 2 0 25 50 75 100 2007 2008 2009 2010 Year Profit Growth 2007 17 20% 2008 26 52% 2009 53 104% 2010 96 81.1%