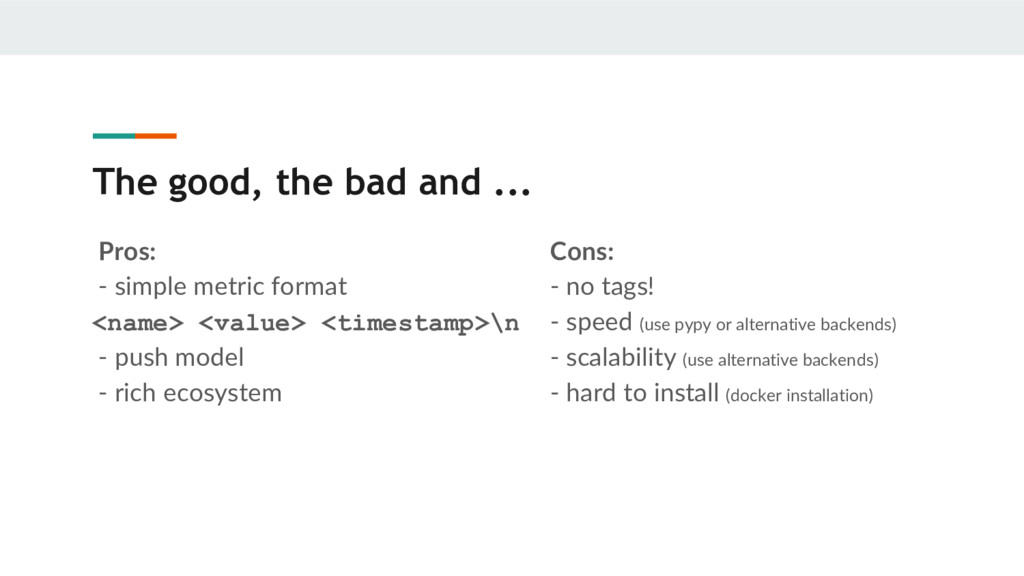
format <name> <value> <timestamp>\n - push model - rich ecosystem Cons: - no tags! - speed (use pypy or alternative backends) - scalability (use alternative backends) - hard to install (docker installation)
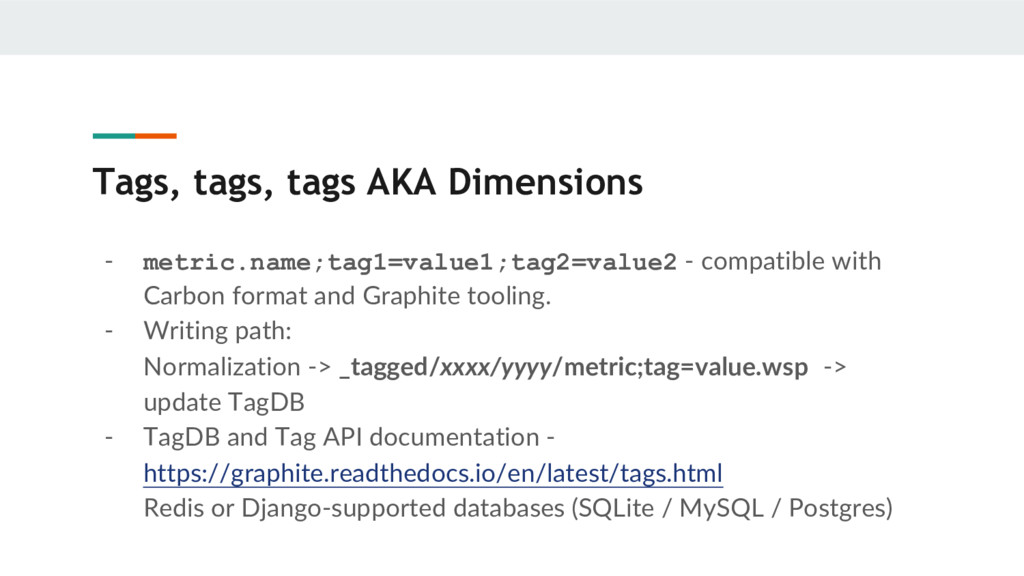
Carbon format and Graphite tooling. - Writing path: Normalization -> _tagged/xxxx/yyyy/metric;tag=value.wsp -> update TagDB - TagDB and Tag API documentation - https://graphite.readthedocs.io/en/latest/tags.html Redis or Django-supported databases (SQLite / MySQL / Postgres)
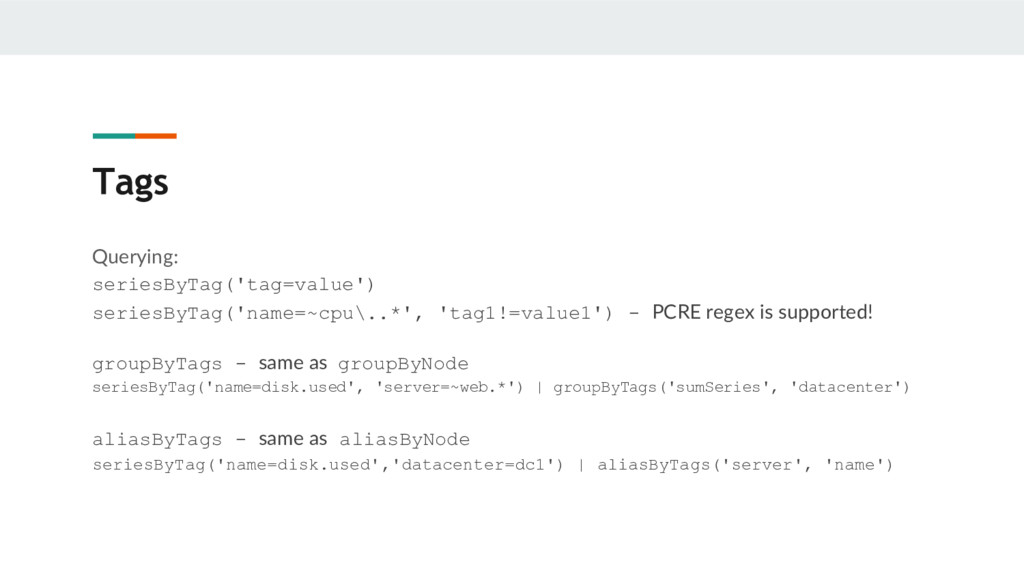
groupByTags - same as groupByNode seriesByTag('name=disk.used', 'server=~web.*') | groupByTags('sumSeries', 'datacenter') aliasByTags - same as aliasByNode seriesByTag('name=disk.used','datacenter=dc1') | aliasByTags('server', 'name')
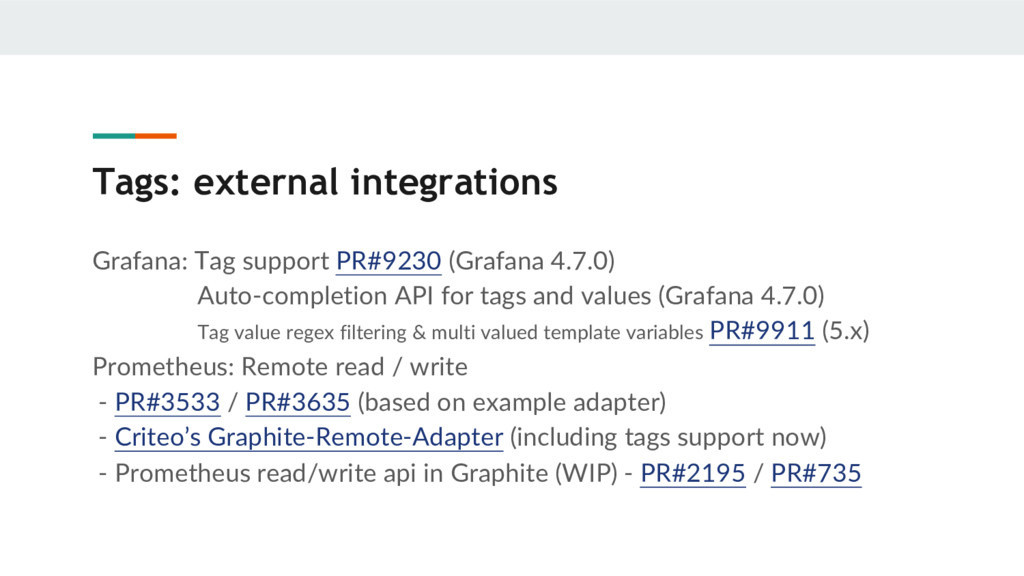
API for tags and values (Grafana 4.7.0) Tag value regex filtering & multi valued template variables PR#9911 (5.x) Prometheus: Remote read / write - PR#3533 / PR#3635 (based on example adapter) - Criteo’s Graphite-Remote-Adapter (including tags support now) - Prometheus read/write api in Graphite (WIP) - PR#2195 / PR#735
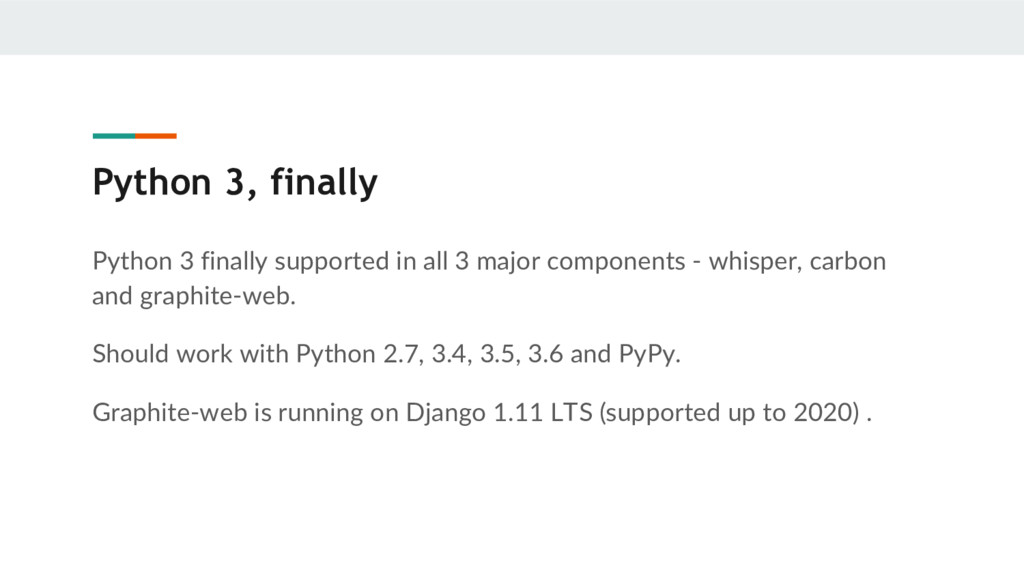
major components - whisper, carbon and graphite-web. Should work with Python 2.7, 3.4, 3.5, 3.6 and PyPy. Graphite-web is running on Django 1.11 LTS (supported up to 2020) .
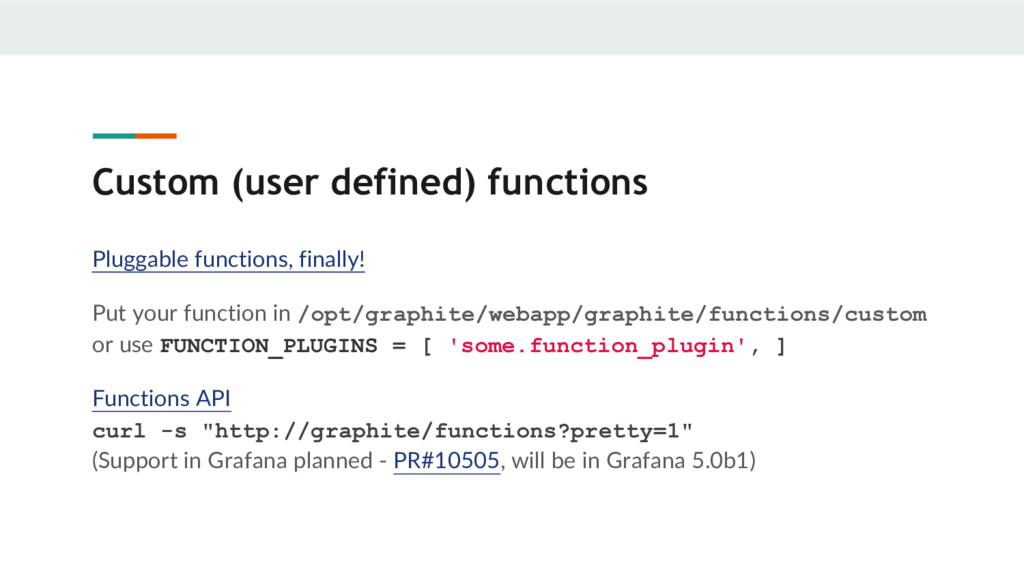
in /opt/graphite/webapp/graphite/functions/custom or use FUNCTION_PLUGINS = [ 'some.function_plugin', ] Functions API curl -s "http://graphite/functions?pretty=1" (Support in Grafana planned - PR#10505, will be in Grafana 5.0b1)
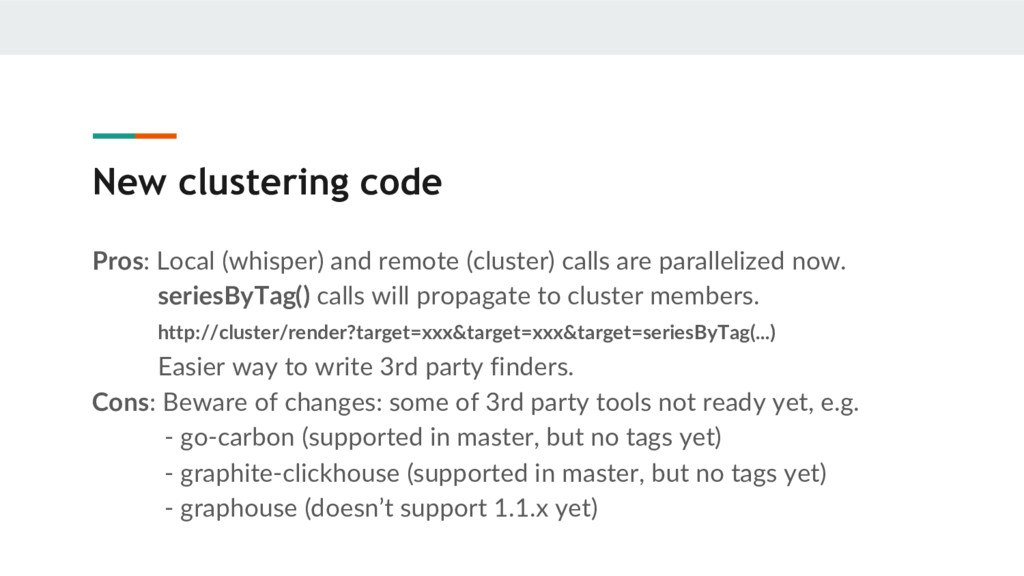
are parallelized now. seriesByTag() calls will propagate to cluster members. http://cluster/render?target=xxx&target=xxx&target=seriesByTag(...) Easier way to write 3rd party finders. Cons: Beware of changes: some of 3rd party tools not ready yet, e.g. - go-carbon (supported in master, but no tags yet) - graphite-clickhouse (supported in master, but no tags yet) - graphouse (doesn’t support 1.1.x yet)
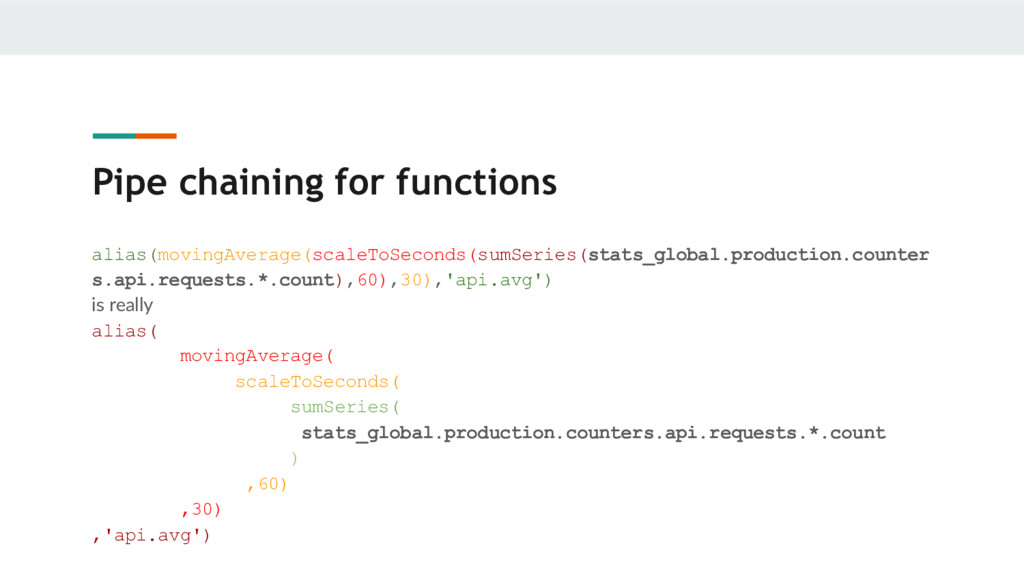
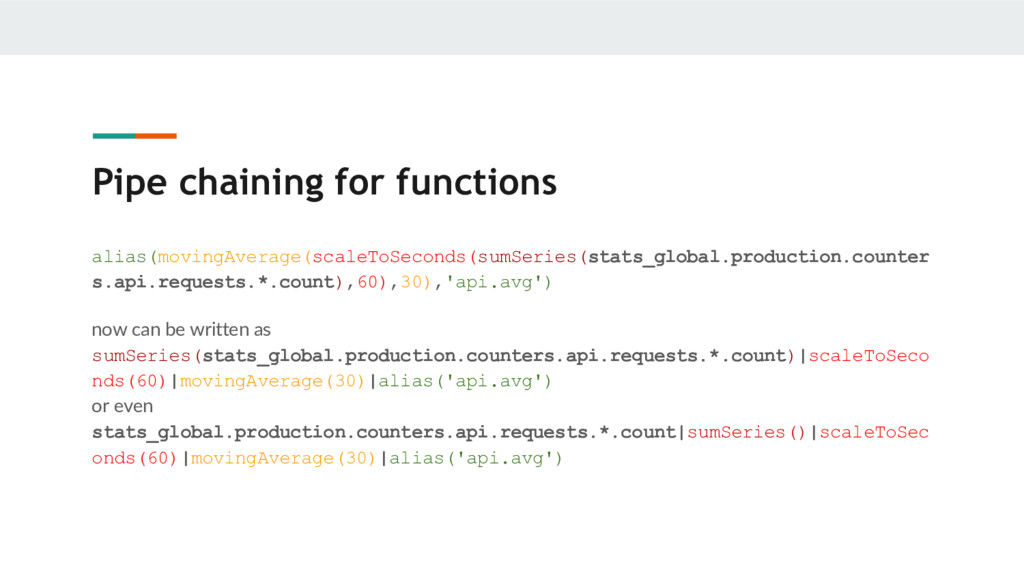
as sumSeries(stats_global.production.counters.api.requests.*.count)|scaleToSeco nds(60)|movingAverage(30)|alias('api.avg') or even stats_global.production.counters.api.requests.*.count|sumSeries()|scaleToSec onds(60)|movingAverage(30)|alias('api.avg')
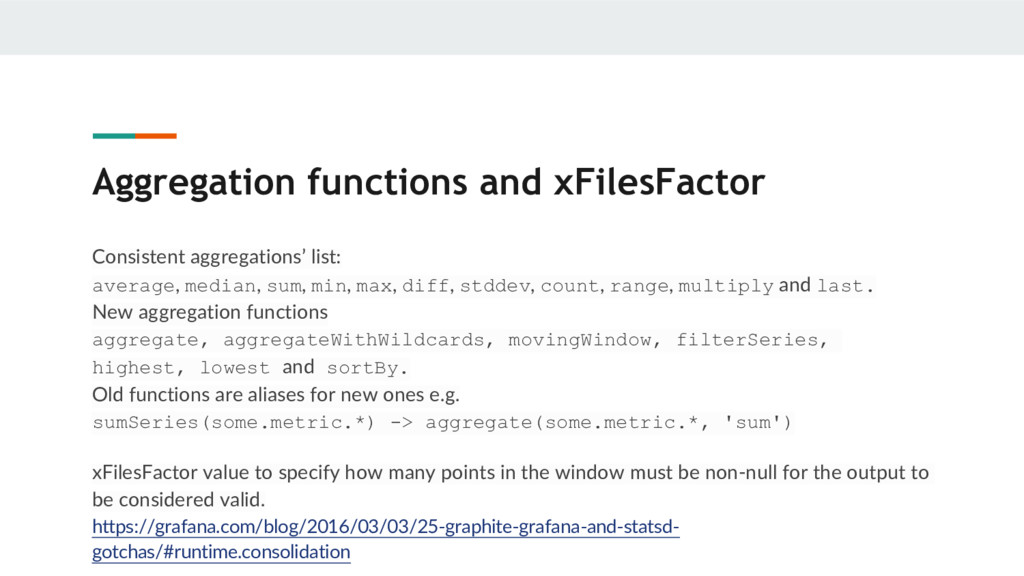
min, max, diff, stddev, count, range, multiply and last. New aggregation functions aggregate, aggregateWithWildcards, movingWindow, filterSeries, highest, lowest and sortBy. Old functions are aliases for new ones e.g. sumSeries(some.metric.*) -> aggregate(some.metric.*, 'sum') xFilesFactor value to specify how many points in the window must be non-null for the output to be considered valid. https://grafana.com/blog/2016/03/03/25-graphite-grafana-and-statsd- gotchas/#runtime.consolidation
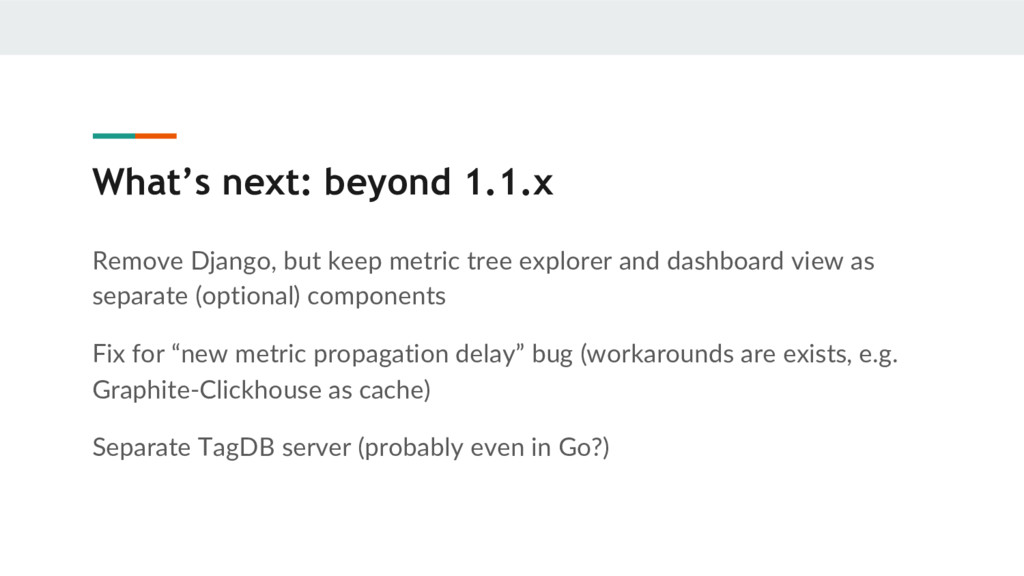
explorer and dashboard view as separate (optional) components Fix for “new metric propagation delay” bug (workarounds are exists, e.g. Graphite-Clickhouse as cache) Separate TagDB server (probably even in Go?)


 deniszh
 optim
 takai
 clockmaker
 hschwentner
 guaca
 findyinc
 chobishiba
 jame2408
 tosite
 har1101
 satoshi256kbyte
 skydoves
 baasie
 kimpetersen
 madoxten
 honnibal
 charlesmeaden
 jeffersonlam
 akosma
 mraible
 eitanlees
 tammyeverts
 dugsong
 aleyda