Upgrade to Pro — share decks privately, control downloads, hide ads and more …

Airbnb+ - Harvard International Consulting Competition (2015)

djirdehh
August 22, 2015

Airbnb+ - Harvard International Consulting Competition (2015)

A 5 year strategy plan on how Airbnb can influence the business travel market. Presented at the Harvard International Consulting Competition (2015)

djirdehh

August 22, 2015
Tweet

More Decks by djirdehh

Other Decks in Business

Transcript

  1. Year Spending/ USD Trillion Global business travel spending to reach

    record in 2014 forecast – Reuters (2014) Market Scope Growth Opportunity Benefits Strategy Financials Summary Airbnb+ BUSINESS TRAVEL MARKET 0 0.2 0.4 0.6 0.8 1 1.2 1.4 1.6 1.8 2012 2013 2014 2015 2016 2017 2018 2019
  2. BUSINESS TRAVEL MARKET 38% 24% 21% 17% $0 $200,000,000,000 $400,000,000,000

    $600,000,000,000 $800,000,000,000 $1,000,000,000,000 $1,200,000,000,000 $1,400,000,000,000 Global Business Travel Asia Pacific (China) W. Europe N. America Other 0.5% $1.35 Billion Market Scope Growth Opportunity Benefits Strategy Financials Summary Airbnb+ Market Share Global business travel spending to reach record in 2014 forecast - Reuters (2014)
  3. “I’m interested in being able to book things with ease,

    to have the convenience of location and key hotel services” Wayne Lin, Consultant - BCG “With Airbnb, I won’t be able to accrue hotel rewards” Nicolas Dinh, Vice President Payments - MasterCard Canada “Airbnb doesn’t always provide amenities such as free Wifi and breakfast” Jake Levinson, Consultant - Deloitte “We need a detailed invoice including any relevant country tax information. Airbnb receipts are usually pretty simple” Layan Kutob, Business Analyst - McKinsey “Honestly, I just want a king-sized bed” David Cheung, Supply Chain Manager – Procter & Gamble INTERVIEWS Market Scope Growth Opportunity Benefits Strategy Financials Summary Airbnb+
  4. Market Scope Growth Opportunity Benefits Strategy Financials Summary Airbnb+ “[Airbnb

    would be] too much hassle. I need something that is standard and works smoothly, and I know the location” SCOTT MCDONALD President and CEO, Oliver Wyman Group
  5. Cleaning Services Wi-Fi Network AMENITIES Market Scope Growth Opportunity Benefits

    Strategy Financials Summary Airbnb+ Rewards Program Cable Service
  6. 4 out of 5 stars 20 stays and 10 unique

    reviews HOSTING STANDARDS Offer all services Market Scope Growth Opportunity Benefits Strategy Financials Summary Airbnb+
  7. Partnership with Manages rentals for Hosts Provides hotel grade services

    for Guests AMENITIES Market Scope Growth Opportunity Benefits Strategy Financials Summary Airbnb+
  8. AMENITIES Check-In and Concierge Service Market Scope Growth Opportunity Benefits

    Strategy Financials Summary Airbnb+ Key Management Cleaning and Turn-Over Service 20% of Total Rental Income Fee
  9. Travellers Hosts A three dimensional approach to cater to the

    business traveler market BENEFITS Corporations Travellers Hosts Market Scope Growth Opportunity Benefits Strategy Financials Summary Airbnb+
  10. Travellers Hosts Corporations Travellers Hosts • 33% OPEX Savings •

    Automated Expense Reports • On the Go Itinerary Market Scope Growth Opportunity Benefits Strategy Financials Summary Airbnb+ BENEFITS
  11. Travellers Hosts Corporations Travellers Hosts • PlusPoints™ Loyalty system •

    Diverse Selection • Extra amenities (e.g. Kitchen, laundry) Market Scope Growth Opportunity Benefits Strategy Financials Summary Airbnb+ BENEFITS
  12. Travellers Hosts Corporations Travellers Hosts • 2 - 4% Interchange

    Fee (2 Years) • Housekeeping Market Scope Growth Opportunity Benefits Strategy Financials Summary Airbnb+ BENEFITS
  13. James Yeo, Manager - Mobile Application Development Market Scope Growth

    Opportunity Benefits Strategy Financials Summary Airbnb+ Singapore United States BENEFITS
  14. 2015 2016 2017 2018 2019 2020 1. Grow Airbnb’s reputation

    in the Asian-Pacific Market Project Timeline Set Stage 1. TIMELINE Market Scope Growth Opportunity Benefits Strategy Financials Summary Airbnb+
  15. 2015 2016 2017 2018 2019 2020 1. Grow Airbnb’s reputation

    in the Asian-Pacific Market 2. Partner with ConcurTM 3. Target small companies headquartered in N.A 1. 2. Project Timeline Short Term Set Stage TIMELINE Market Scope Growth Opportunity Benefits Strategy Financials Summary Airbnb+
  16. Long Term 2015 2016 2017 2018 2019 2020 1. Grow

    Airbnb’s reputation in the Asian-Pacific Market 2. Partner with ConcurTM 3. Target small companies headquartered in N.A 4. Shift horizon to multinational corporations 1. 2. Project Timeline Short Term Set Stage TIMELINE 3. 4. Market Scope Growth Opportunity Benefits Strategy Financials Summary Airbnb+
  17. Long Term 2015 2016 2017 2018 2019 2020 1. Grow

    Airbnb’s reputation in the Asian-Pacific Market 2. Partner with ConcurTM 3. Target small companies headquartered in N.A 4. Shift horizon to multinational corporations 5. Partner with credit card provider MasterCard 1. 2. Project Timeline Short Term Set Stage TIMELINE 3. 4. Market Scope Growth Opportunity Benefits Strategy Financials Summary Airbnb+
  18. “ I believe a partnership with Airbnb+ has significant potential”

    NICOLAS DINH Vice President [Emerging Payments], MasterCard Market Scope Growth Opportunity Benefits Strategy Financials Summary Airbnb+
  19. 1. Grow Airbnb’s reputation in the Asian-Pacific Market 2. Partner

    with ConcurTM 3. Target small companies headquartered in N.A 4. Shift horizon to multinational corporations 5. Partner with credit card provider MasterCard 6. Work with Travel agencies Egencia, Merit Business 2015 2016 2017 2018 2019 2020 1. 2. Project Timeline Short Term Set Stage TIMELINE 3. 4. Long Term Market Scope Growth Opportunity Benefits Strategy Financials Summary Airbnb+
  20. FINANCIALS 2016 2017 2018 2019 2020 Growth Of Companies 20%

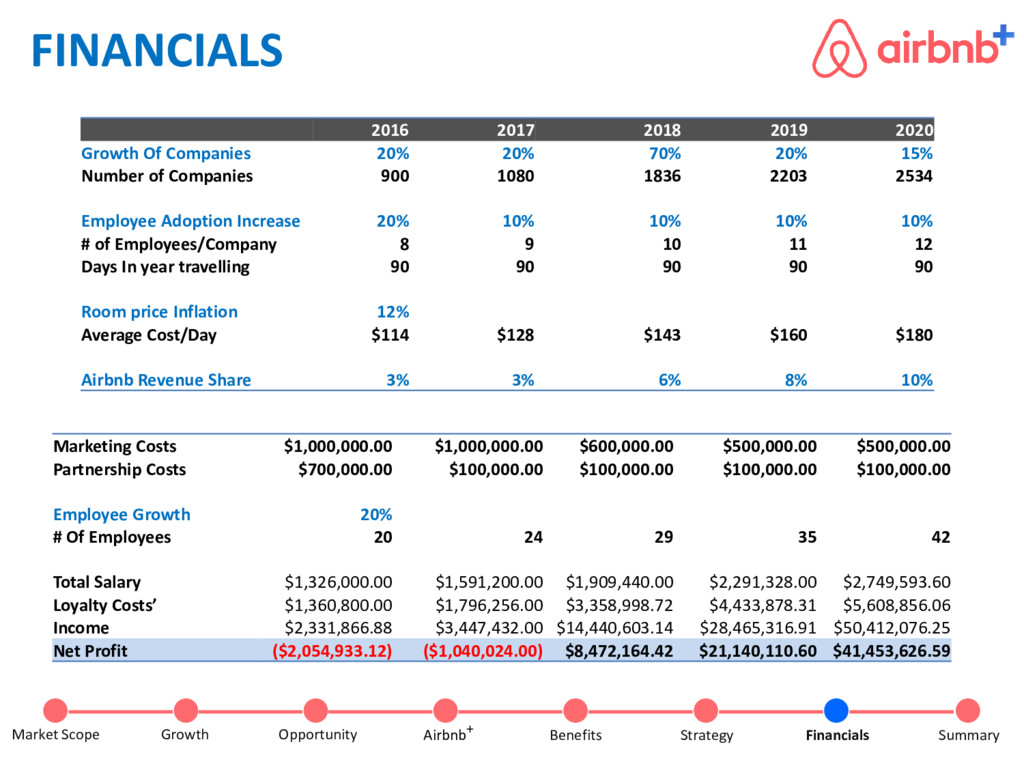
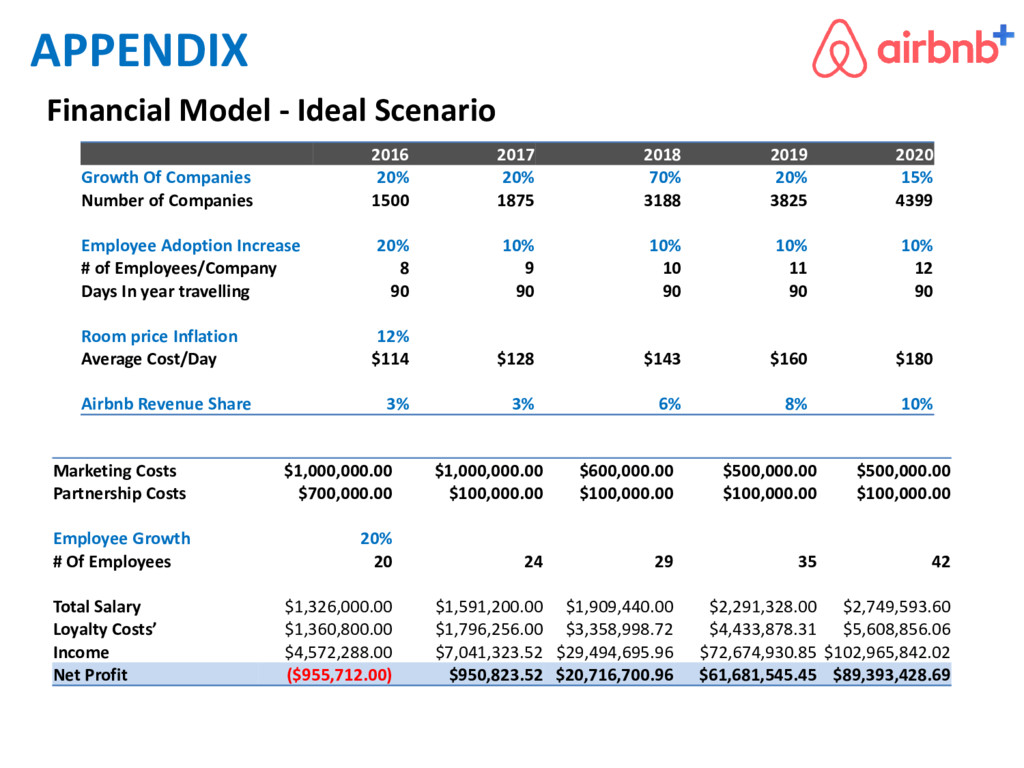
    20% 70% 20% 15% Number of Companies 900 1080 1836 2203 2534 Employee Adoption Increase 20% 10% 10% 10% 10% # of Employees/Company 8 9 10 11 12 Days In year travelling 90 90 90 90 90 Room price Inflation 12% Average Cost/Day $114 $128 $143 $160 $180 Airbnb Revenue Share 3% 3% 6% 8% 10% Marketing Costs $1,000,000.00 $1,000,000.00 $600,000.00 $500,000.00 $500,000.00 Partnership Costs $700,000.00 $100,000.00 $100,000.00 $100,000.00 $100,000.00 Employee Growth 20% # Of Employees 20 24 29 35 42 Total Salary $1,326,000.00 $1,591,200.00 $1,909,440.00 $2,291,328.00 $2,749,593.60 Loyalty Costs’ $1,360,800.00 $1,796,256.00 $3,358,998.72 $4,433,878.31 $5,608,856.06 Income $2,331,866.88 $3,447,432.00 $14,440,603.14 $28,465,316.91 $50,412,076.25 Net Profit ($2,054,933.12) ($1,040,024.00) $8,472,164.42 $21,140,110.60 $41,453,626.59 Market Scope Growth Opportunity Benefits Strategy Financials Summary Airbnb+
  21. FINANCIALS Sensitivity Analysis Discount Rate 10.0% 11.0% 11.5% 12.0% 12.5%

    13.0% 13.5% NPV $43,816,038 $42,025,731 $41,163,849 $40,323,280 $39,503,402 $38,703,612 $37,923,329 Ideal Case $106 Million Realistic Case Payback: 2 Years Payback: 2.4 Years $42 Million Market Scope Growth Opportunity Benefits Strategy Financials Summary Airbnb+
  22. SUMMARY Asia Pacific Market Business Travel Needs Small Businesses Global

    Expansion Partnerships Market Scope Growth Opportunity Benefits Strategy Financials Summary Airbnb+
  23. PlusPoints™ Tier 1 Tier 2 Tier 3 Platinum Gold Silver

    APPENDIX PlusPoints Loyalty Program
  24. APPENDIX 2016 2017 2018 2019 2020 Growth Of Companies 20%

    20% 70% 20% 15% Number of Companies 1500 1875 3188 3825 4399 Employee Adoption Increase 20% 10% 10% 10% 10% # of Employees/Company 8 9 10 11 12 Days In year travelling 90 90 90 90 90 Room price Inflation 12% Average Cost/Day $114 $128 $143 $160 $180 Airbnb Revenue Share 3% 3% 6% 8% 10% Marketing Costs $1,000,000.00 $1,000,000.00 $600,000.00 $500,000.00 $500,000.00 Partnership Costs $700,000.00 $100,000.00 $100,000.00 $100,000.00 $100,000.00 Employee Growth 20% # Of Employees 20 24 29 35 42 Total Salary $1,326,000.00 $1,591,200.00 $1,909,440.00 $2,291,328.00 $2,749,593.60 Loyalty Costs’ $1,360,800.00 $1,796,256.00 $3,358,998.72 $4,433,878.31 $5,608,856.06 Income $4,572,288.00 $7,041,323.52 $29,494,695.96 $72,674,930.85 $102,965,842.02 Net Profit ($955,712.00) $950,823.52 $20,716,700.96 $61,681,545.45 $89,393,428.69 Financial Model - Ideal Scenario