Upgrade to Pro — share decks privately, control downloads, hide ads and more …

Conflicting Priorities: How to Visualize their impacts & Influence Change

Conflicting Priorities: How to Visualize their impacts & Influence Change

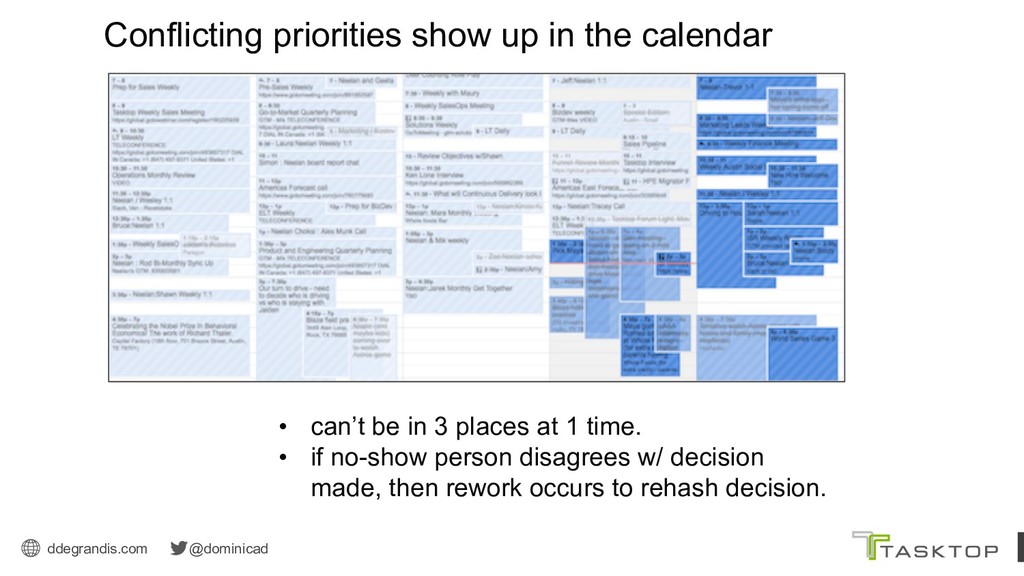
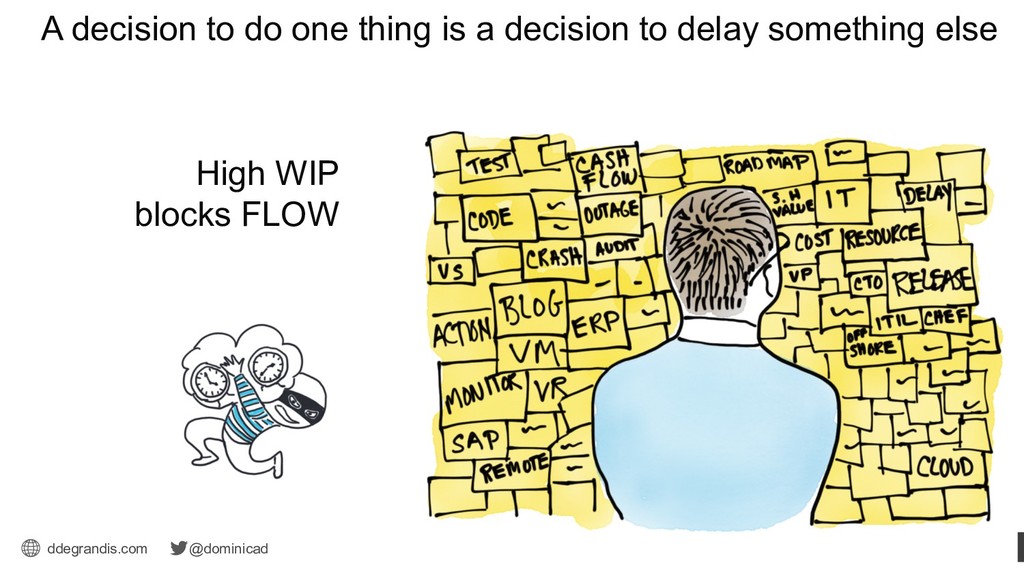
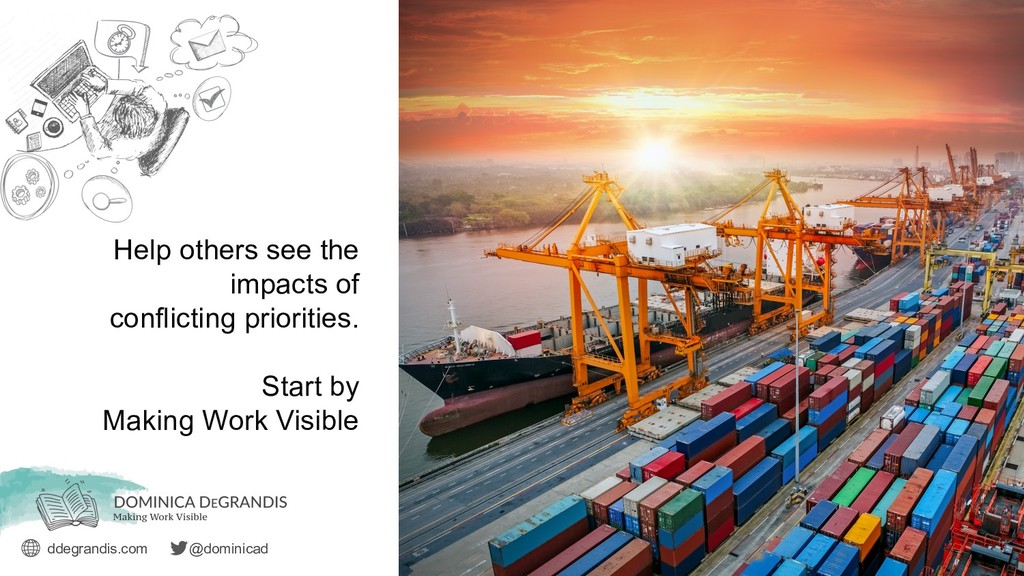
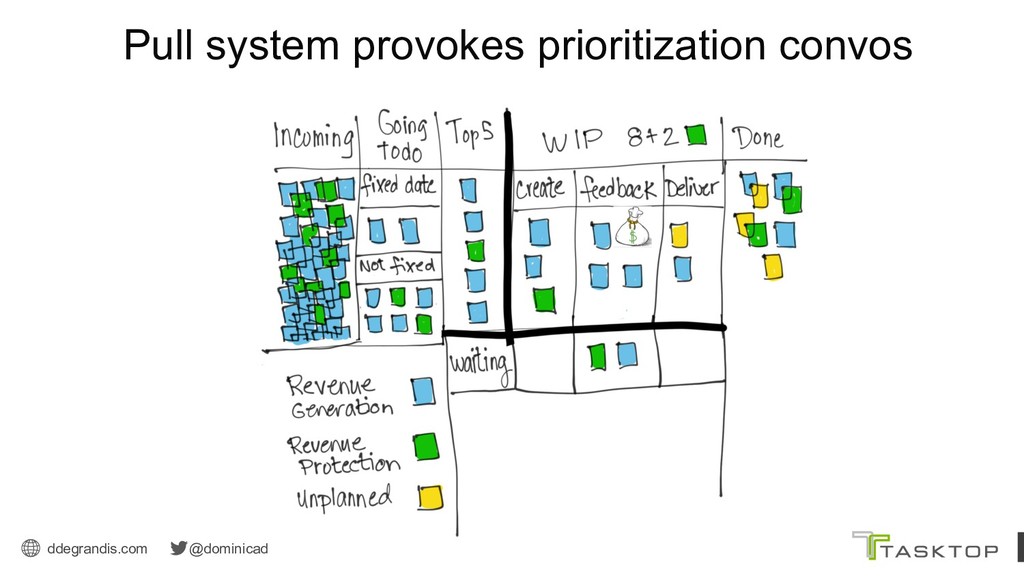
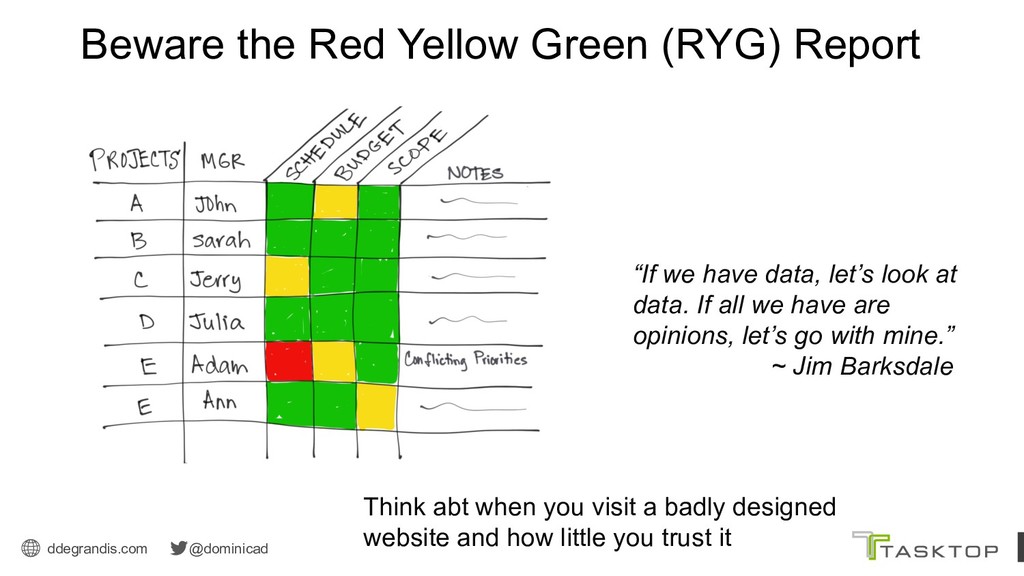
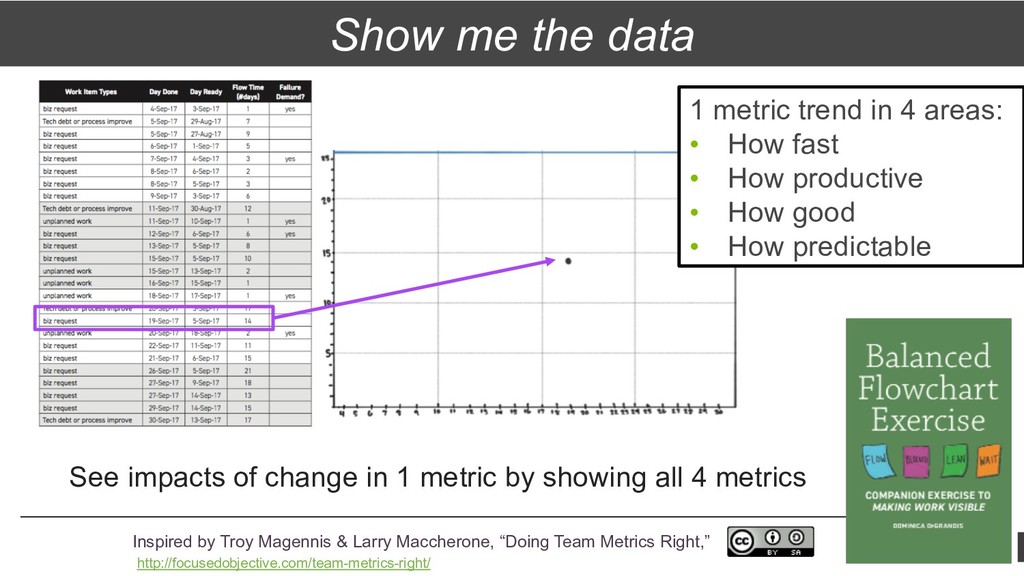
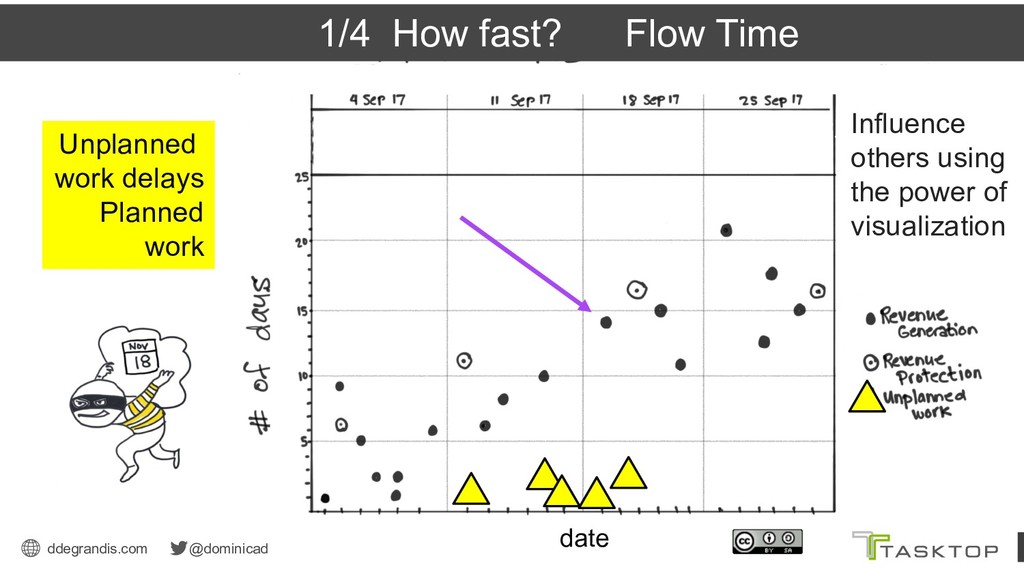
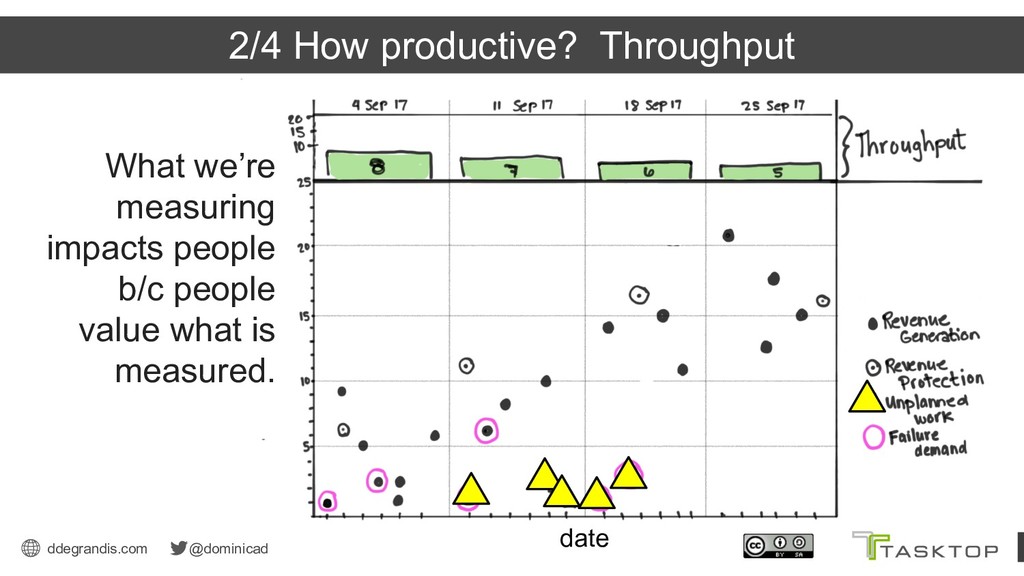
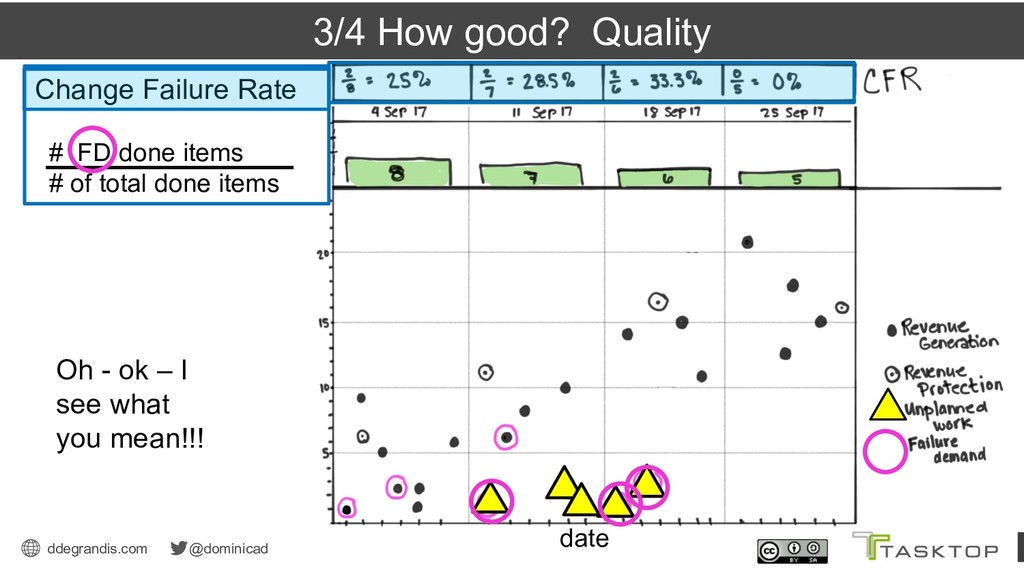
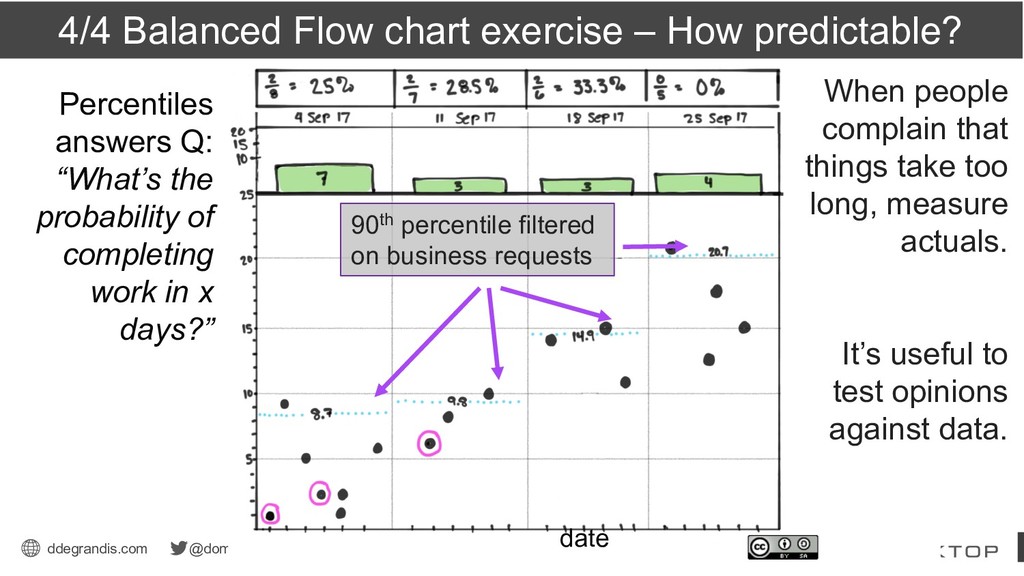
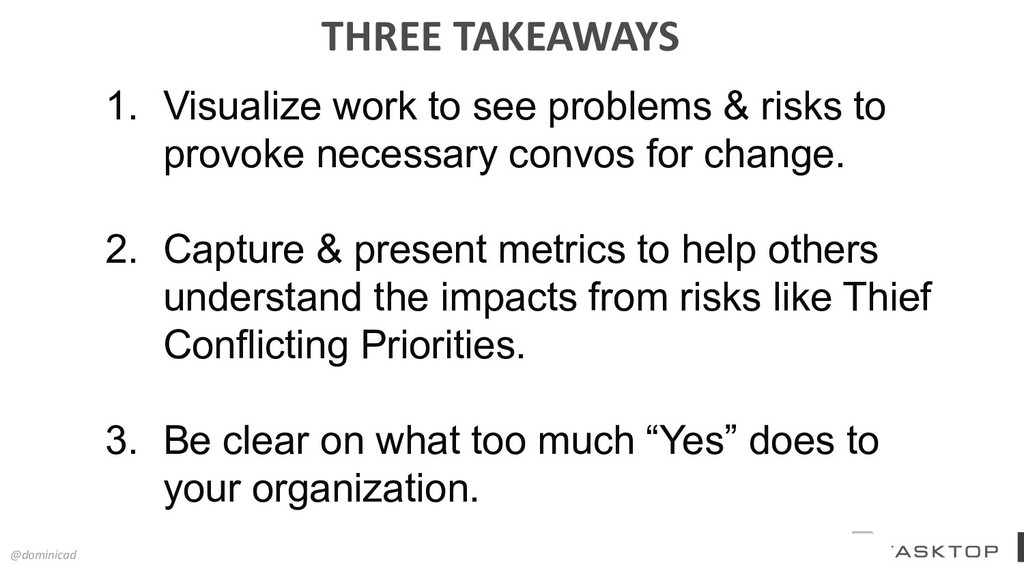
Bringing visibility to problems and risks is the 1st step toward solving them because it sheds light on what to do next that is otherwise invisible. In this presentation, Dominica shows you how to visualize impacts of them & how to influence the next steps for change

Dominica DeGrandis

June 15, 2018
Tweet

More Decks by Dominica DeGrandis

Other Decks in Technology

Transcript

  1. ddegrandis.com @dominicad Teams rarely work in isolation 1 2 3

    How does Courtney prioritize tasks across multiple projects?
  2. ddegrandis.com @dominicad Dominica DeGrandis Thief Too much Work-in-progress (WIP) High

    WIP means that other items sit waiting for service longer. The single most important factor that affects queue size is capacity utilization.
  3. ddegrandis.com @dominicad Dominica DeGrandis Thief Too much Work-in-progress (WIP) Queuing

    Theory allows us to quantify the relationship between wait times and capacity utilization. Wait times increase exponentially as utilization approaches 100%. Queuing Theory: Applied statistics that studies waiting lines If the goal is speed, consider managing work by queues. http://reinertsenassociates.com/books/
  4. ddegrandis.com @dominicad • can’t be in 3 places at 1

    time. • if no-show person disagrees w/ decision made, then rework occurs to rehash decision. Conflicting priorities show up in the calendar
  5. ddegrandis.com @dominicad A decision to do one thing is a

    decision to delay something else High WIP blocks FLOW
  6. ddegrandis.com @dominicad Beastly Practice Individually named swim lanes People may

    prioritize based on making themselves look good to the detriment of the team performance! Same thing at the team level w/ local optimization.
  7. ddegrandis.com @dominicad Explicit Prioritization Policies help teams be more predictable

    § PNW rainy weather causes unpredictable Landslides § Limited number of rails - freight trains have higher priority
  8. ddegrandis.com @dominicad How to Prioritize? Explicit Prioritization Options ROI: Return

    of investment Cost of investment CoD: Missed revenue (gen, rev protection) costs (staffing, operational) WSJF: Delay cost Duration FIFO: First In First Out HiPPO: Highest Paid Persons Opinion wsjf - http://reinertsenassociates.com/books/ if work is same size, do work w/ high CoD If work is same Cod, do short work 1st if size & CoD are diff, do WSJF
  9. ddegrandis.com @dominicad Beware the Red Yellow Green (RYG) Report “If

    we have data, let’s look at data. If all we have are opinions, let’s go with mine.” ~ Jim Barksdale Think abt when you visit a badly designed website and how little you trust it
  10. ddegrandis.com @dominicad Show me the data 1 metric trend in

    4 areas: • How fast • How productive • How good • How predictable See impacts of change in 1 metric by showing all 4 metrics Inspired by Troy Magennis & Larry Maccherone, “Doing Team Metrics Right,” http://focusedobjective.com/team-metrics-right/
  11. ddegrandis.com @dominicad Look at Flow time 1/4 How fast? Flow

    Time Influence others using the power of visualization date Unplanned work delays Planned work
  12. ddegrandis.com @dominicad Look at Throughput 2/4 How productive? Throughput What

    we’re measuring impacts people b/c people value what is measured. date
  13. ddegrandis.com @dominicad 3/4 How good? Quality Change Failure Rate #

    FD done items # of total done items date Oh - ok – I see what you mean!!!
  14. ddegrandis.com @dominicad When people complain that things take too long,

    measure actuals. It’s useful to test opinions against data. 90th percentile filtered on business requests 4/4 Balanced Flow chart exercise – How predictable? date Percentiles answers Q: “What’s the probability of completing work in x days?”
  15. ddegrandis.com @dominicad Dominica’s Hypothesis: Explicit prioritization policies and correct WIP

    levels will help teams be more predictable. Why? Because people are clear on what to do and have capacity to finish work before time thieves sneak in and do damage.
  16. ddegrandis.com @dominicad THREE TAKEAWAYS @dominicad 1. Visualize work to see

    problems & risks to provoke necessary convos for change. 2. Capture & present metrics to help others understand the impacts from risks like Thief Conflicting Priorities. 3. Be clear on what too much “Yes” does to your organization.
  17. ddegrandis.com @dominicad “The difference between successful people and very successful

    people is that very successful people say “no” to almost everything.” ~Warren Buffett https://www.goodreads.com/author/show/756.Warren_Buffett
  18. ddegrandis.com @dominicad Email: [email protected] Subject: flow To receive: • copy

    of this presentation deck • excerpts of Making Work Visible • Tasktop video on TFS/SN tool integration • Forrester article: Agile-Plus-DevOps With Value Stream Management