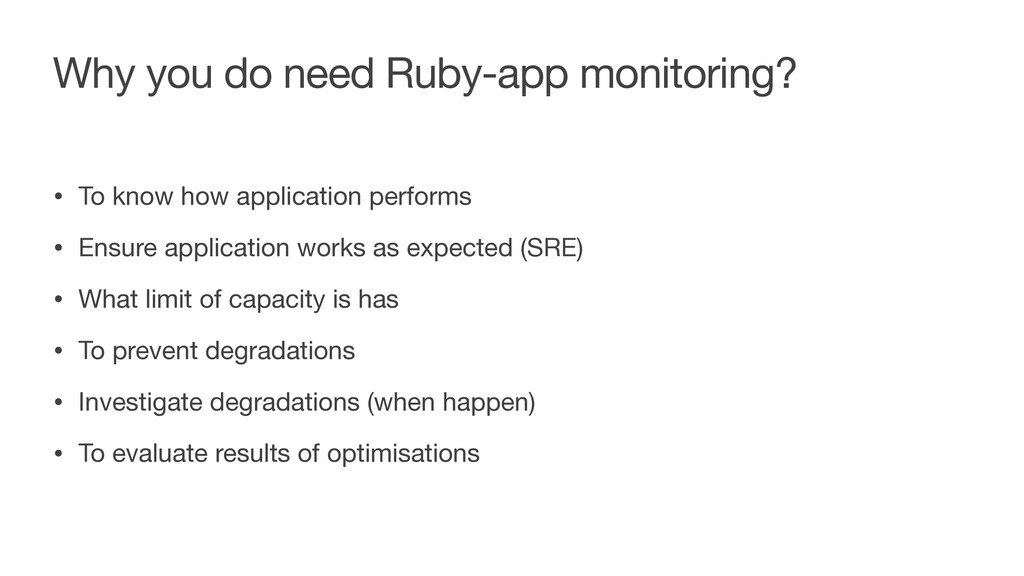
application performs • Ensure application works as expected (SRE) • What limit of capacity is has • To prevent degradations • Investigate degradations (when happen) • To evaluate results of optimisations
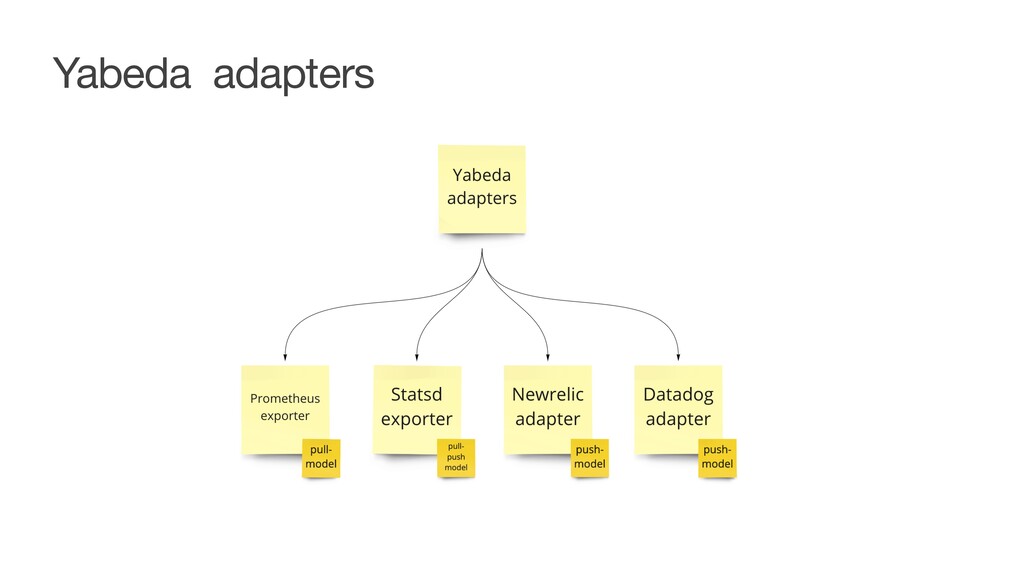
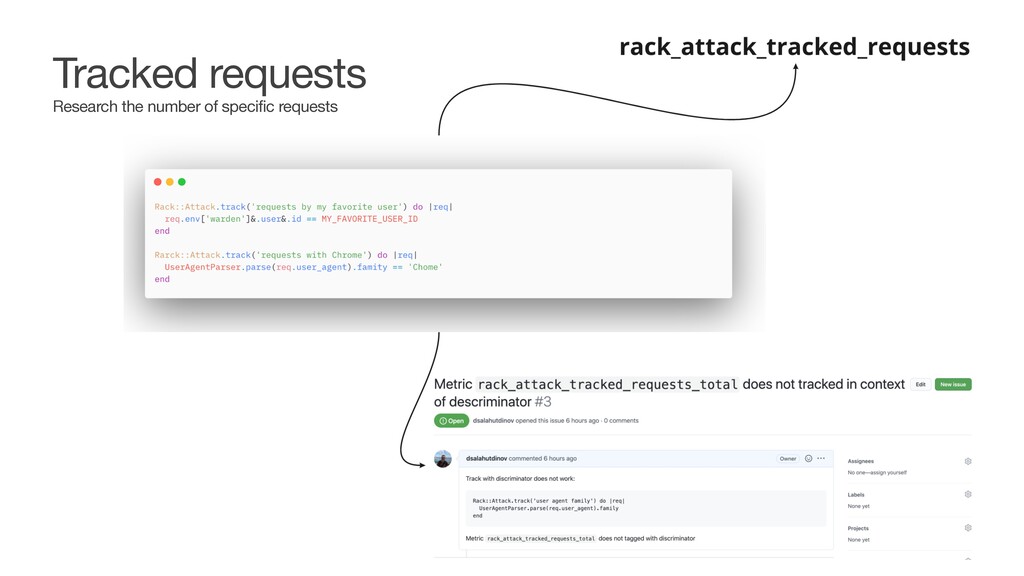
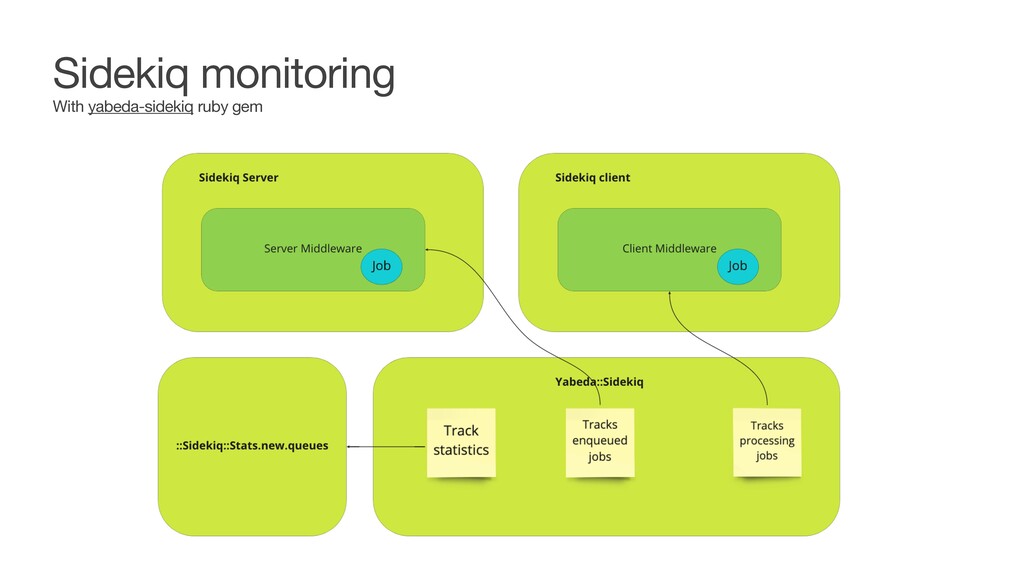
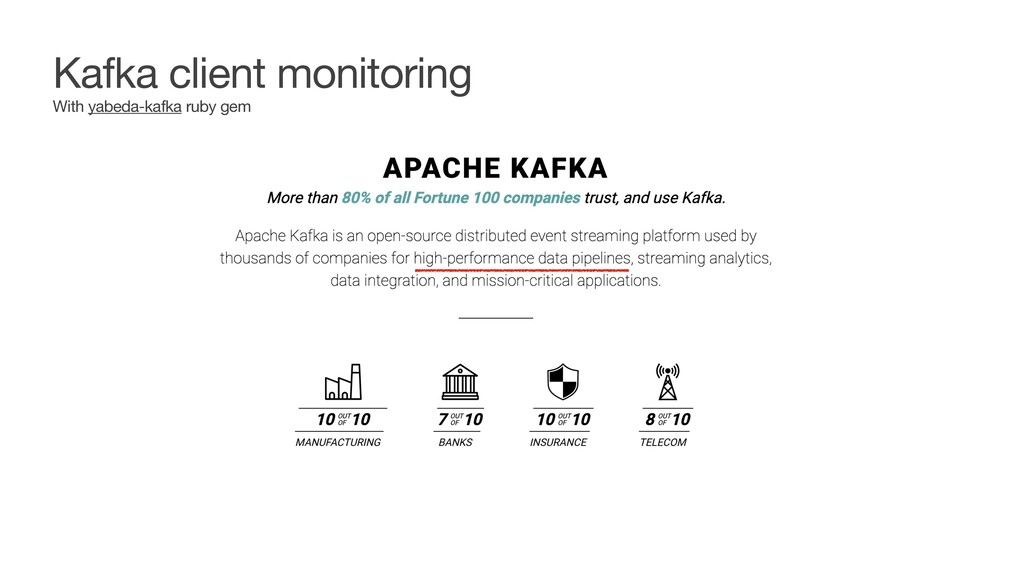
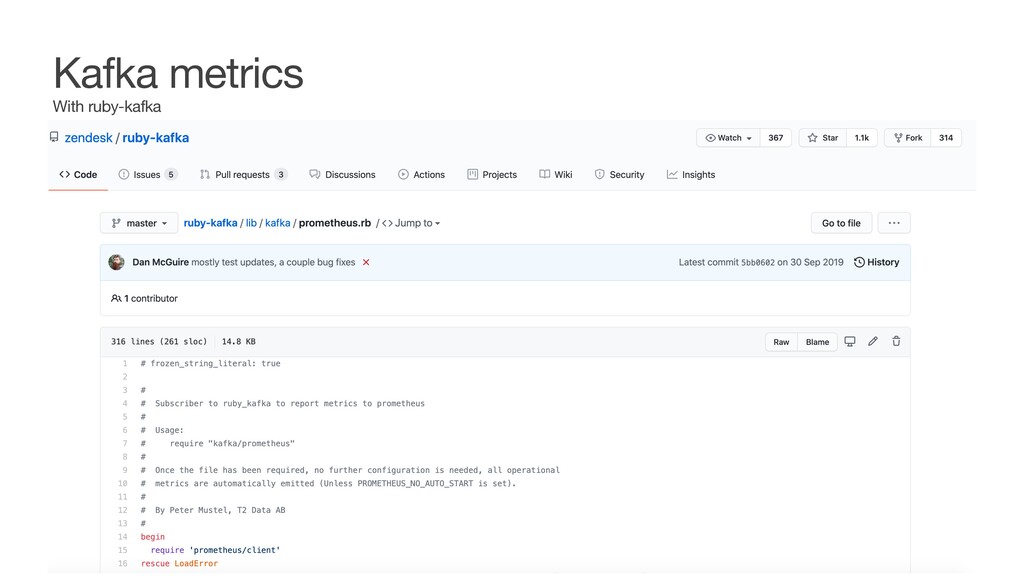
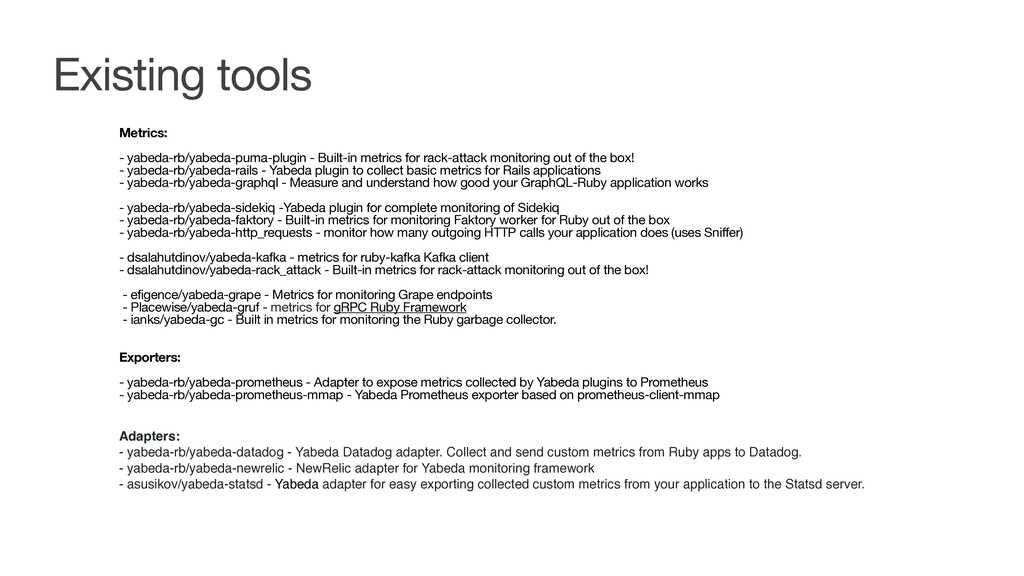
of the box! - yabeda-rb/yabeda-rails - Yabeda plugin to collect basic metrics for Rails applications - yabeda-rb/yabeda-graphql - Measure and understand how good your GraphQL-Ruby application works - yabeda-rb/yabeda-sidekiq -Yabeda plugin for complete monitoring of Sidekiq - yabeda-rb/yabeda-faktory - Built-in metrics for monitoring Faktory worker for Ruby out of the box - yabeda-rb/yabeda-http_requests - monitor how many outgoing HTTP calls your application does (uses Sniffer) - dsalahutdinov/yabeda-kafka - metrics for ruby-kafka Kafka client - dsalahutdinov/yabeda-rack_attack - Built-in metrics for rack-attack monitoring out of the box! - efigence/yabeda-grape - Metrics for monitoring Grape endpoints - Placewise/yabeda-gruf - metrics for gRPC Ruby Framework - ianks/yabeda-gc - Built in metrics for monitoring the Ruby garbage collector. Exporters: - yabeda-rb/yabeda-prometheus - Adapter to expose metrics collected by Yabeda plugins to Prometheus - yabeda-rb/yabeda-prometheus-mmap - Yabeda Prometheus exporter based on prometheus-client-mmap Adapters: - yabeda-rb/yabeda-datadog - Yabeda Datadog adapter. Collect and send custom metrics from Ruby apps to Datadog. - yabeda-rb/yabeda-newrelic - NewRelic adapter for Yabeda monitoring framework - asusikov/yabeda-statsd - Yabeda adapter for easy exporting collected custom metrics from your application to the Statsd server. Existing tools
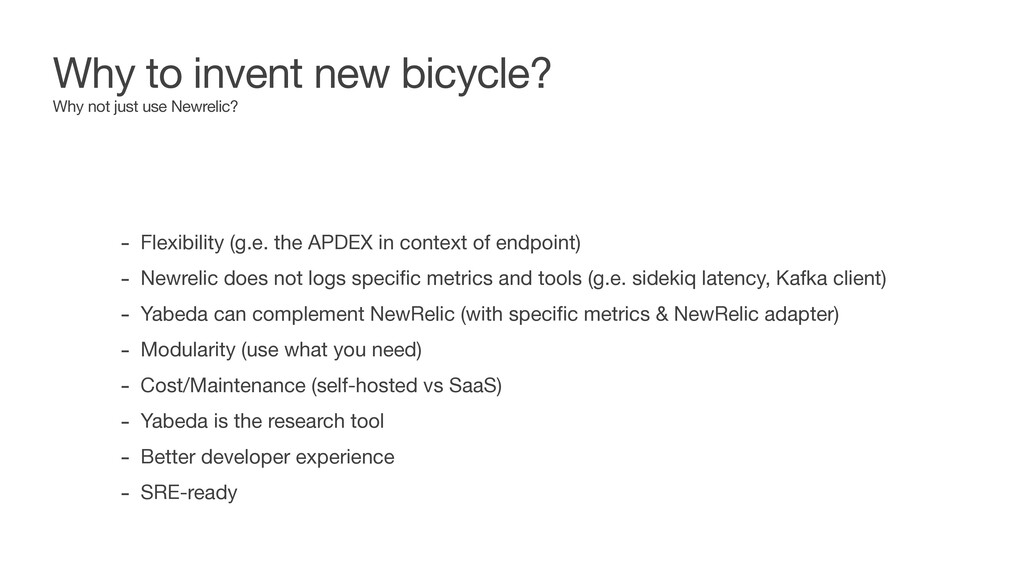
in context of endpoint) - Newrelic does not logs specific metrics and tools (g.e. sidekiq latency, Kafka client) - Yabeda can complement NewRelic (with specific metrics & NewRelic adapter) - Modularity (use what you need) - Cost/Maintenance (self-hosted vs SaaS) - Yabeda is the research tool - Better developer experience - SRE-ready Why not just use Newrelic?