Upgrade to Pro — share decks privately, control downloads, hide ads and more …

Advancing Greater Detroit's Startup Ecosystem

Dug Song
January 24, 2023

Advancing Greater Detroit's Startup Ecosystem

Startup Genome on greater Detroit (including Ann Arbor), named their #1 emerging global startup ecosystem in 2022, in this report sponsored by Endeavor and William Davidson Foundation.

Dug Song

January 24, 2023
Tweet

More Decks by Dug Song

Other Decks in Business

Transcript

  1. © 2020
    Advancing
    Greater Detroit’s
    Startup Ecosystem
    JF Gauthier, Founder and CEO
    Marc Penzel, Founder and President
    Pranav Arya, Senior Consultant
    Ethan Webster, Innovation Policy Specialist
    startupgenome.com

    View Slide

  2. © 2020
    © 2022
    2
    A Note From Endeavor Detroit
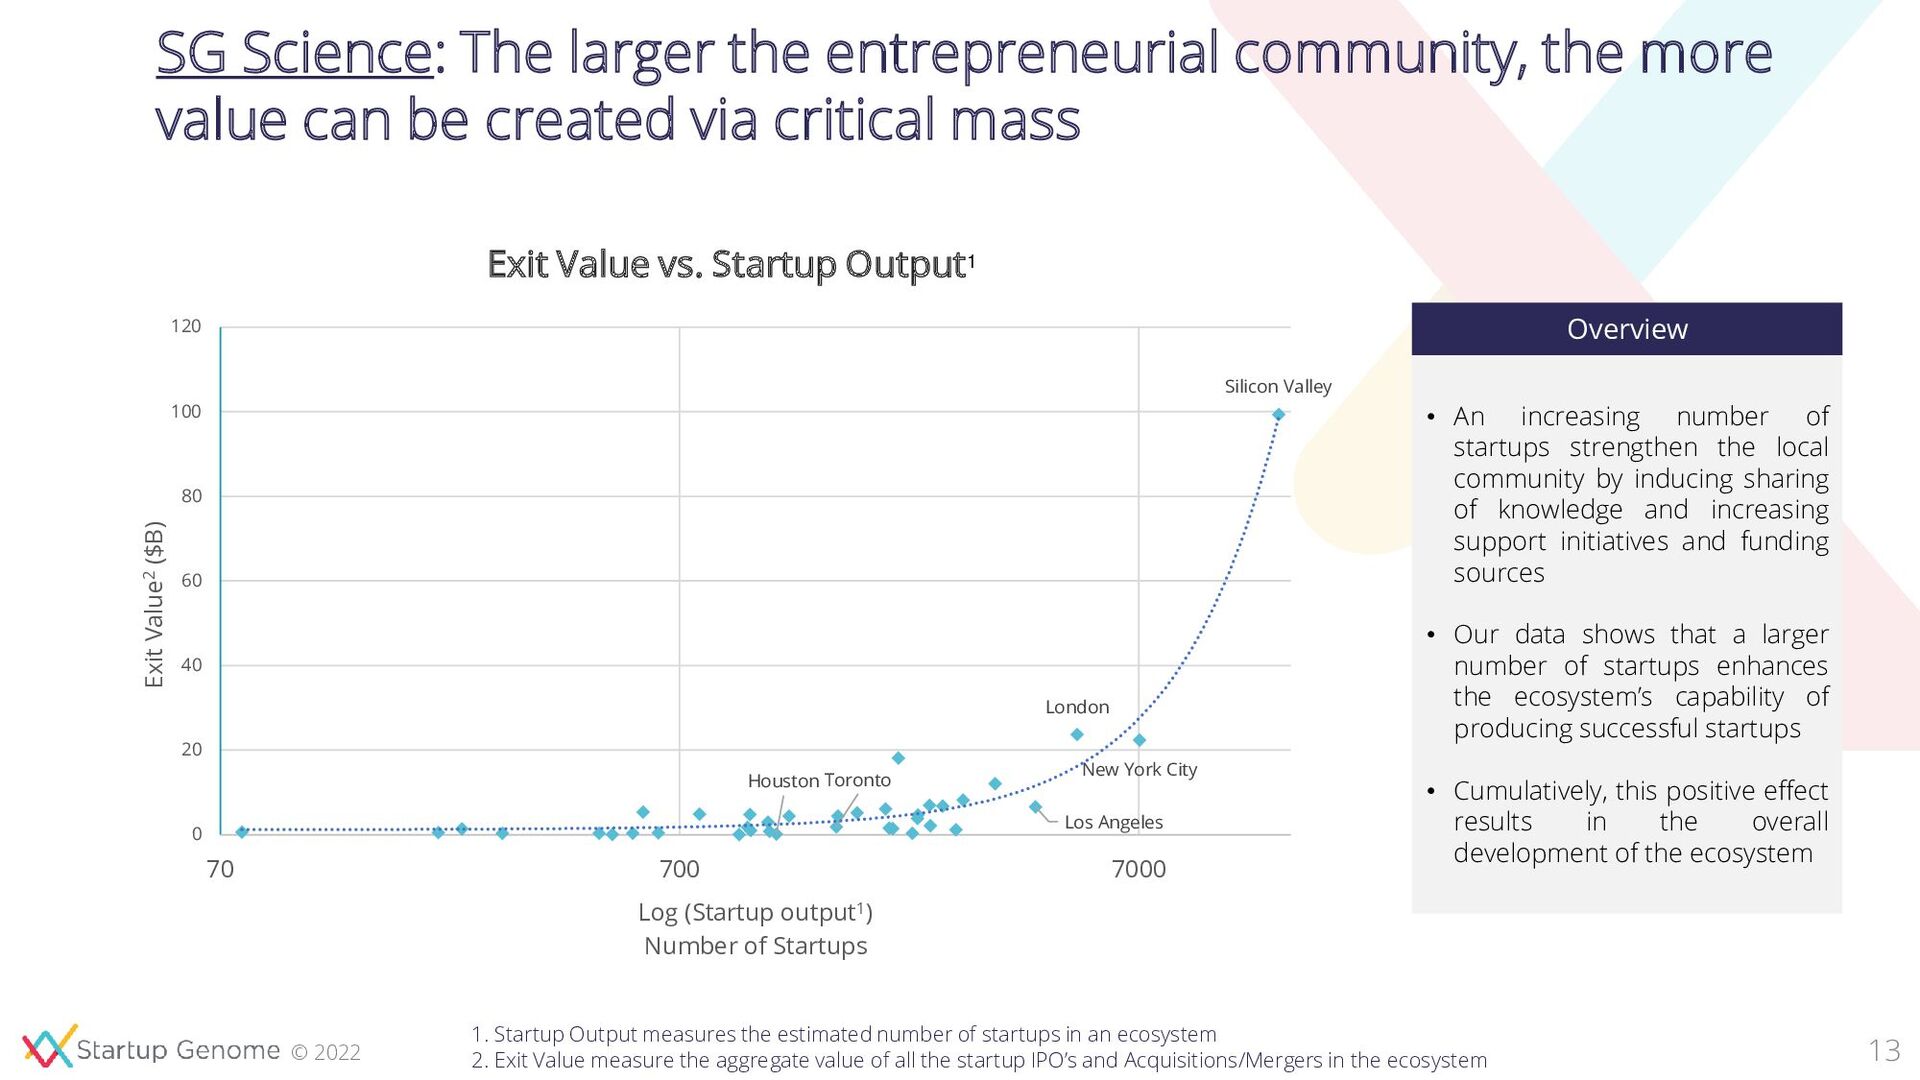
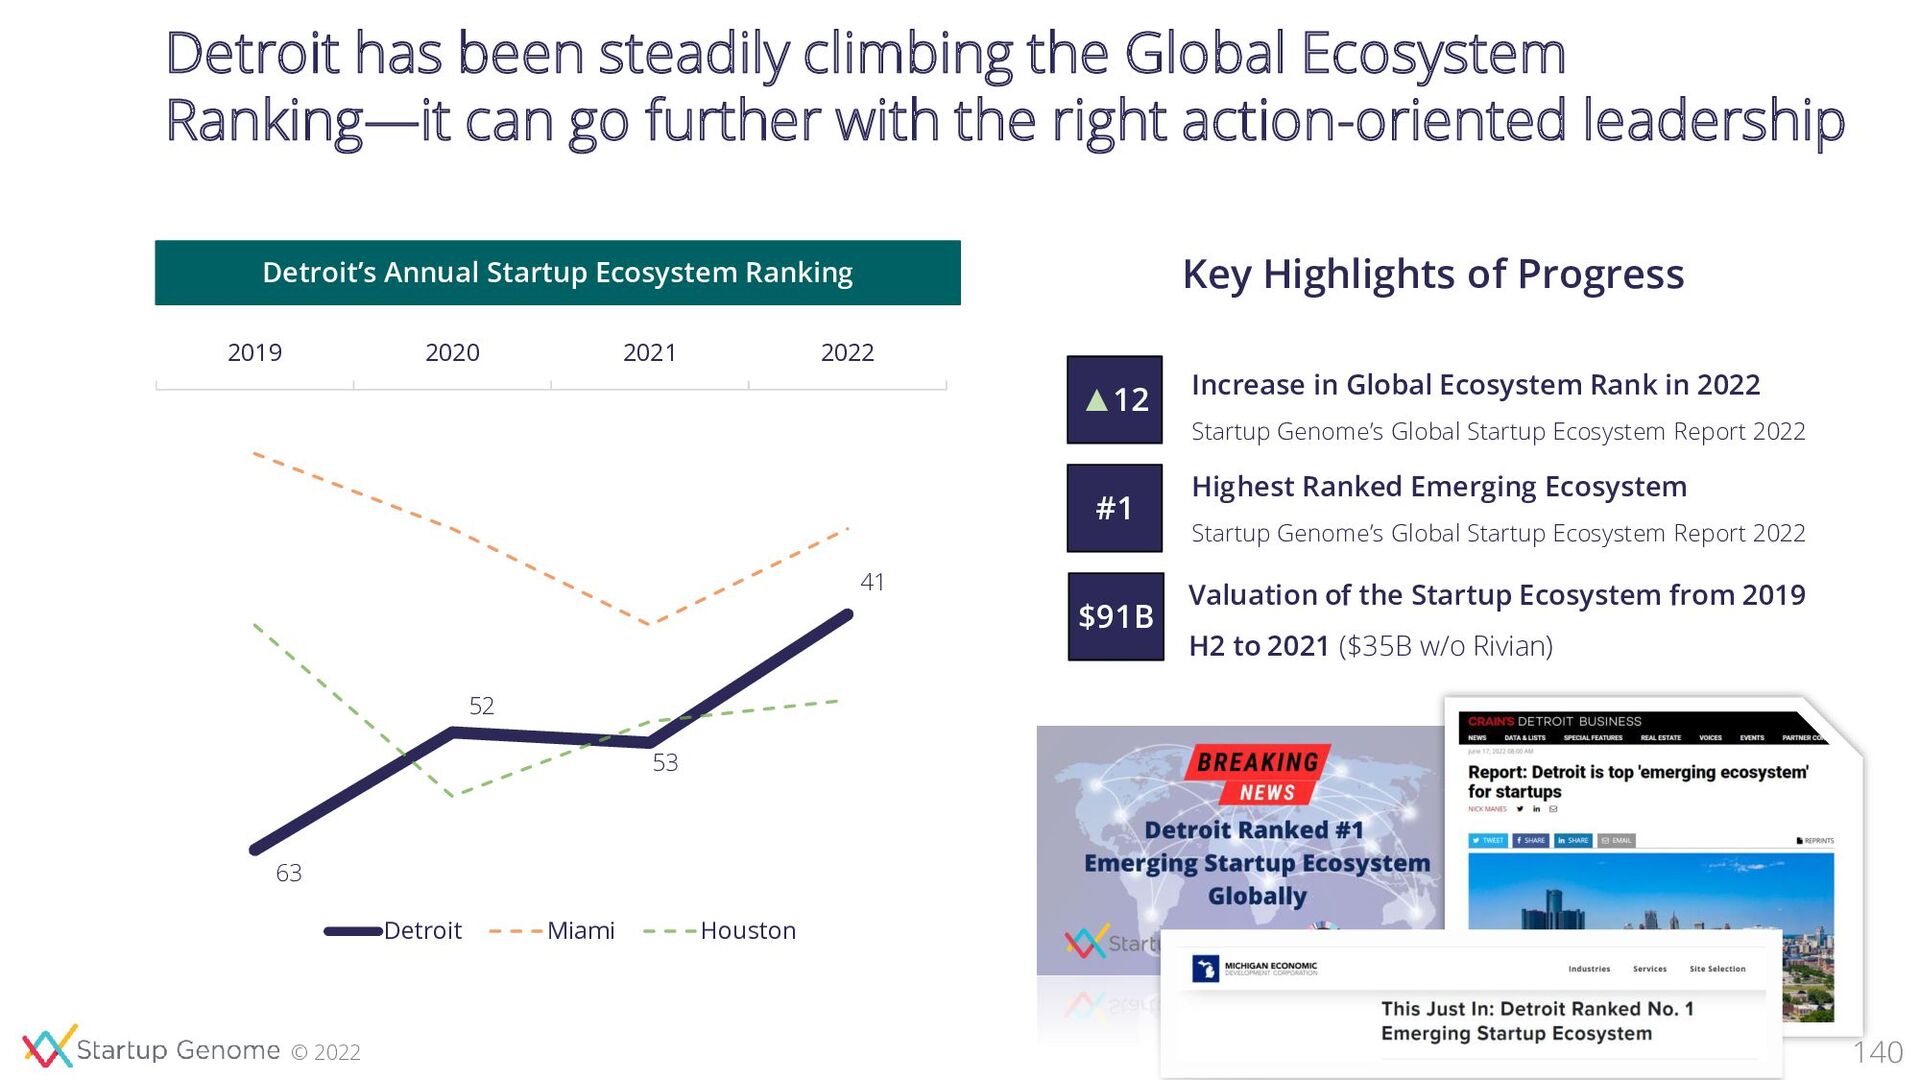
    Decades of research have shown that entrepreneurs who have the support and capital investment they need to scale, peers and mentors who coach them
    to dream bigger, and a pay it forward mentality, have an outsized impact on local economies. By scaling high-growth companies that lead to large exits and
    attracting outside investment into the region, they drive liquidity to their markets and deploy the wealth created by their businesses to create the
    infrastructure and networks necessary for aspiring entrepreneurs to follow in their footsteps. We know this model of entrepreneur-led economic
    development works, because for more than 25 years, our organization has researched and seen this impact in startup ecosystems in emerging markets
    worldwide.
    In 2019, Endeavor partnered with William Davidson Foundation on research that found U.S. metropolitan areas with the greatest income and productivity
    share a common trait – they all generate more of a specific type of high-growth business: local, entrepreneur-led, with 50 or more employees, in high-value
    industries. National data pulled for the study suggests that if Southeast Michigan could create 60 of these high-growth companies, it would increase local
    GDP by over $5 billion annually.
    There is tremendous potential for this type of “high-impact” entrepreneurship in Southeast Michigan. With top tier universities, big industry, and driven,
    entrepreneurially minded talent, the region has made powerful progress and recently was named by Startup Genome as the “#1 Highest Ranked Emerging
    Ecosystem in the World.” With recent notable exits like Duo, Benzinga, and Wisely, and significant valuations from companies like StockX, Workit Health, and
    SkySpecs, our entrepreneurs have proven growing and scaling successful scaleups can be done here at home.
    By all measures, we have momentum, but our success is not a foregone conclusion. While much focus has been placed on attracting large corporate
    investment and supporting community small business growth, there is still no cohesive strategy for supporting entrepreneurs leading high-growth
    companies or wide stakeholder acknowledgement of the greater startup ecosystem’s critical role in economic development. Meanwhile, well-supported
    startup ecosystems are taking root outside strongholds like Silicon Valley, Boston, and New York. Our high-growth companies are increasingly competing for
    talent and resources in emerging ecosystems like Atlanta, Chicago, Columbus, Miami, and Pittsburgh.

    View Slide

  3. © 2020
    © 2022
    3
    A Note From Endeavor Detroit
    To capitalize on our momentum and to successfully compete with emerging tech and innovation cities, we must first understand where we stand in
    comparison to other regions nationally and globally. In 2022, William Davidson Foundation partnered with Startup Genome and Endeavor to take a closer
    look at the Detroit region’s high-growth startup ecosystem. In alignment with our values, we adopted an “entrepreneur first” lens for this project. We
    contracted Bloomscape founder, Justin Mast to lead research and analysis efforts for the project and we have convened founders to help design initiatives
    that will follow. This analysis is based on data that has been collected over the last year largely via surveys and conversations with high-growth startup
    founders, incorporating input from Entrepreneur Support Organization (ESO) leaders, investors, and policymakers.
    The following analysis identifies strengths, opportunities for improvement, and insight into how our region is performing against our peers. This is not just
    another research report – what follows is a hard look at our collective strengths and weaknesses, with the intent to show where we must invest and level-up
    as a region to achieve our full growth potential. The purpose of this study is not to support any one entity or agenda but is intended to provide insights to the
    greater community so that we can all work to advance high-growth entrepreneurship here in Southeast Michigan.
    A few key findings include:
    1. Founders feel there is no clear strategy leading the region’s efforts and believe support organizations (accelerators, incubators, and other ESOs) are
    disjointed and have provided limited services to support their growth and scale.
    2. In terms of exit and scale, founders aim lower in comparison to national and global regions, limiting the outlook and potential of success; despite this, the
    region has produced more $100M exits than other peer markets in the U.S.
    3. Founders believe local angel groups and investors have outmoded mindsets and provide limited valuable support to help founders grow and scale; there
    is not enough capital to deploy, too few active investors in the region, and too few that take necessary risks on emerging companies.
    4. In comparison to peers, the Detroit area shows a low success rate of companies securing seed funding and an even lower success rate of those securing
    Series A funding. Those who do secure Series A rounds show smaller valuations on average than those in peer cities.

    View Slide

  4. © 2020
    © 2022
    4
    A Note From Endeavor Detroit
    Given these findings, we believe there is great opportunity to elevate our high-growth ecosystem.
    A few opportunities include:
    1. Convening and aligning our region’s efforts around a more unified strategy, while also ensuring efforts are founder-led and founder-focused.
    2. Advancing policy/advocacy efforts to drive more federal, state, and local funding into early-stage investment and targeted support for high-performing
    ESOs and those requiring technical assistance.
    3. Providing more transparency around accelerators, incubators, and ESOs’ performance.
    4. Advancing our region’s storytelling to drive momentum and provide greater visibility and investment into our successes.
    5. Increasing livability in Southeastern MI to attract and retain scaleup companies and high-potential talent.
    6. Supporting "think bigger mindsets" by taking deliberate steps to grow presence and visibility for our high-potential founders outside of Michigan, including
    in other strategic national and international ecosystems.
    We believe the Detroit area has the potential to become one of the world’s premier locations for high-growth entrepreneurship. This study offers actionable
    insights to help us get there.
    Diana Callaghan
    Managing Director, Endeavor Detroit

    View Slide

  5. © 2022
    Agenda
    Ecosystem Lifecycle Phase
    2
    Success Factor Assessment
    3
    5
    Innovation Edge
    4
    Way Forward
    5
    Introduction
    1

    View Slide

  6. © 2022
    Agenda
    Ecosystem Lifecycle Phase
    2
    Success Factor Assessment
    3
    6
    Innovation Edge
    4
    Way Forward
    5
    Introduction
    1

    View Slide

  7. © 2022
    7
    Our Role is to prioritize, shape and drive action with you
    • Data-Driven Assessment: Gaps and strengths of the ecosystem, peer benchmarks
    • Global Best Practices: Bring relevant best practices to address gaps & invest in strengths
    • Community Alignment: Consensus-building around priorities among stakeholders
    • Taking Action: Support ecosystem leaders to shape and drive first actions
    Our Role

    View Slide

  8. © 2022
    We performed an objective and in-depth assessment of Greater
    Detroit’s startup ecosystem
    8
    Founder
    Surveys and
    Data Analysis
    Create missing Success Factor data with
    startup survey + combine and process
    data from major databases
    Interviews with
    18 Key
    Stakeholders
    Angels, VCs, corporate executives,
    university leaders
    Focused Group
    Discussions
    Two founder roundtables to
    understand key issues
    Ranking of
    Sub-Sector
    Strengths
    Objective voice of global databases for
    you to combine with local knowledge
    Detroit City
    Ann Arbor
    About 60-mile radius
    Geographic Scope Assessment Activities
    Map of Michigan is not to scale, for representative purposes only
    The Detroit
    Ecosystem, nominally
    referred to as
    “Detroit” in this
    presentation unless
    marked otherwise

    View Slide

  9. © 2022
    Startups are young, technology-focused and/or high-growth
    organizations finding scalable business models
    9
    Taking inspiration from Steve Blank, we define startups as young organizations searching for a
    repeatable and scalable business model. We use this definition to look at new businesses in sectors
    including, but not limited to, Software, Hardware, Health, and Energy.
    Time
    Cash
    Flow
    SMEs
    Time
    Cash
    Flow
    Startups
    Definition of Startups

    View Slide

  10. © 2022
    Startup Ecosystem Assessment anchored on Success Factors
    2
    Factors critical to the success of startup
    ecosystems are analyzed against ecosystems in
    similar phases to understand strengths and gaps
    Quantify key strengths and barriers to startup success
    10
    Startup Ecosystem Lifecycle Phase Identification
    1
    Research of 100+ startup ecosystems highlights
    that they evolve across predictable trajectories
    and exhibit specific characteristics along the way
    Identify characteristics and peer set for comparison
    Our holistic assessment is driven by two facets and based on
    research with hundreds of startup ecosystems globally

    View Slide

  11. © 2022
    The Ecosystem Lifecycle Model explains how an ecosystem
    performs in comparison to others and which measures to prioritize
    11
    We observed a struggle among city and regional leaders to
    accelerate the growth of their startup ecosystems as the
    structure and dynamics differ radically from the traditional
    economy, requiring a brand-new model of economic
    development. Startup ecosystems are highly dynamic and,
    similar to new technologies, evolve rapidly through different
    maturity phases, with each phase having unique
    characteristics and needs. A global perspective on key
    development actions, contrary to a singular focus on Silicon
    Valley, can drive sustainable growth and job creation.
    To categorize startup ecosystem phases and their evolution, we developed “The Ecosystem Lifecycle Model”
    to help leaders take appropriate action for the most direct impact relative to their current phase

    View Slide

  12. © 2022
    12
    • Fewer than 1,000 startups
    • Limited Ecosystem Experience
    • Challenges like resource
    leakages to later-stage
    ecosystems make it difficult to
    grow
    Activation • More than 1,000 startups
    • A startup ecosystem with
    higher scaling experience
    Integration
    Globalization • More than 2,000 startups
    • Global Resource Attraction,
    and very few Success Factor
    gaps remain
    Attraction
    • More than 3,000 startups
    • Startups integrate into the global
    fabric of knowledge, producing
    global business models and
    achieving high Global Market
    Reach
    The Ecosystem Lifecycle consists of four distinct phases, each with
    distinct characteristics and goals

    View Slide

  13. © 2022
    SG Science: The larger the entrepreneurial community, the more
    value can be created via critical mass
    Exit Value vs. Startup Output1
    13
    Silicon Valley
    New York City
    Los Angeles
    Houston Toronto
    London
    0
    20
    40
    60
    80
    100
    120
    70 700 7000
    Exit Value2 ($B)
    Log (Startup output1)
    Number of Startups
    1. Startup Output measures the estimated number of startups in an ecosystem
    2. Exit Value measure the aggregate value of all the startup IPO’s and Acquisitions/Mergers in the ecosystem
    • An increasing number of
    startups strengthen the local
    community by inducing sharing
    of knowledge and increasing
    support initiatives and funding
    sources
    • Our data shows that a larger
    number of startups enhances
    the ecosystem’s capability of
    producing successful startups
    • Cumulatively, this positive effect
    results in the overall
    development of the ecosystem
    Overview

    View Slide

  14. © 2022
    Founder Roundtable Attendees
    Startup/Organization Name Date Attended Attendee
    Autobooks September 21st Steven Robert
    Matterscale (VC investor) September 21st Antonio Lück
    Signal Advisors September 21st Patrick Kelly
    Ash and Erie September 21st Steven Mazur
    Floyd Home September 22nd Alex O’Dell
    Floyd Home September 22nd Kyle Hoff
    Culturewell September 22nd Sarah Beatty
    Censys September 22nd Lorne Groe
    Skyspecs September 22nd Danny Ellis
    Bloomscape September 22nd Justin Mast
    Founder Roundtable Interviews were conducted in-person in Detroit on September 21st and September 22nd
    14

    View Slide

  15. © 2022
    Interviews Conducted (1/2)
    Organization Name Organization Role Interviewee
    Growthcap VC Lauren Bigelow
    Holofy Angel Doug Collier
    Beringea VC Bill Blake
    Renaissance Venture Capital VC Chris Rizik
    Bamboo ESO Amanda Lewan
    Pocketnest Founder Jessica Willis
    Michigan Central District Corporate Innovator Josh Sirefman
    Centrepolis Accelerator ESO Riley Lenhard
    Endeavor ESO Diana Callaghan
    University of Michigan University Kelly Sexton
    Startup Genome reached out to 23 stakeholders in Detroit, representing experts, investors, founders, universities, SSOPs and Corporate Innovators
    15

    View Slide

  16. © 2022
    Organization Name Organization Role Interviewee
    Ann Arbor SPARK ESO Skip Simms
    CGS Advisors Corporate Innovator Greggory Garrett
    Zeck Founder Robert Wolfe
    Benzinga Founder Jason Raznick
    Automation Alley ESO John Bedz
    MVCA VC Ara Topouzian
    Magna VC Josh Burgh
    MTRAC University Anne Partington
    Startup Genome reached out to 23 stakeholders in Detroit, representing experts, investors, founders, universities, SSOPs and Corporate Innovators
    16
    Interviews Conducted (2/2)

    View Slide

  17. © 2022
    Agenda
    Ecosystem Lifecycle Phase
    2
    Success Factor Assessment
    3
    17
    Innovation Edge
    4
    Way Forward
    5
    Introduction
    1

    View Slide

  18. © 2020
    © 2022
    Detroit has been steadily climbing in our annual Global Ranking—
    and it can go further with the right action-oriented leadership
    18
    Detroit’s Annual Startup Ecosystem Ranking
    2019 2020 2021 2022
    Detroit Miami Houston
    63
    52
    53
    41
    #1
    ▲12
    Key Highlights
    $91B
    Emerging Startup Ecosystem in 2022
    Increase in Global Ecosystem Rank
    Ecosystem Value of $91B ($35B w/o Rivian)
    Rankings based on Startup Genome’s Global Startup Ecosystem Report

    View Slide

  19. © 2020
    © 2022
    Detroit is in the Globalization Phase, characterized by an increasing
    number of startups and a growing availability of resources
    Detroit
    19
    • Detroit exhibits
    characteristics consistent
    with other Early
    Globalization Ecosystems
    • Detroit has about 1,500+
    startups
    • Detroit has had more than
    two Billion-Dollar exits in
    the last 5 years (Duo
    Security, Rivian)
    Overview
    Ecosystem Phase indicators include ecosystem size, exits and scaleup creation, and Success Factor gaps

    View Slide

  20. © 2020
    © 2022
    Detroit has been benchmarked against relevant National and
    International ecosystems with similar characteristics
    National Peers International Peers
    Ecosystem Phases
    20
    Globalization
    Attraction
    Integration
    0
    1
    2
    3
    4
    Boston Miami Houston Detroit Toronto-Waterloo Melbourne Tel Aviv
    Detroit

    View Slide

  21. © 2020
    © 2020
    © 2022
    We calculate and benchmark the number of startups (Startup
    Output) using the Multiple Systems Estimation method
    21
    ● To quantify the startups in an ecosystem, we make use of the Multiple Systems Estimation
    methodology, a derivative of the mark and recapture method. We utilize this methodology to create
    powerful estimates using the overlaps between several incomplete lists
    ● This process involves capturing domain names of startups in the ecosystem using email lists of ESOs
    in the ecosystem and cross-referencing this data through other sources. It uses the overlaps (or lack
    thereof) between multiple lists to arrive at an estimate of the number of startups
    Mark and Recapture is a widely-utilized tool for measuring
    animal wildlife populations by biologists and ecologists
    Total Population
    First Capture
    Second Capture
    Recapture
    This methodology has been tried and
    tested with ecosystem leaders around
    the world and continues to produce
    highly accurate and, importantly,
    standardized results

    View Slide

  22. © 2020
    © 2022
    1. Startup: Innovative, technology-enabled business in search of a repeatable and scalable business model. Applies to companies in software, hardware, energy,
    health, and others. This not only means that the business has the potential to scale to hundreds or thousands of employees, but that such scaling is a primary goal
    0
    2,000
    4,000
    6,000
    8,000
    10,000
    Activation Globalization Attraction Integration
    Startup Output
    (Estimated number of startups1)
    0
    200
    400
    600
    800
    1,000
    Activation Globalization Attraction Integration
    Startup Density
    (Estimated number of Startups Per Million Population)
    22
    Detroit
    Detroit
    Greater Detroit’s Startup Ecosystem is growing as more startups
    are being founded, on par with Globalization average

    View Slide

  23. © 2022
    Agenda
    Ecosystem Lifecycle Phase
    2
    Success Factor Assessment
    3
    23
    Innovation Edge
    4
    Way Forward
    5
    Introduction
    1

    View Slide

  24. 24
    We assess and benchmark ecosystems according to our
    proprietary Success Factor Model
    • Startup Genome began as a research project with leading
    entrepreneurship experts such as Steve Blank, Chuck
    Eesley (Stanford University), and Ron Berman (Wharton
    School of Business)
    • We codify and understand the Success Factors of startups
    and startup ecosystems by building data-driven globally
    standardized perspectives
    • Our mission is to enable more geographies to have a
    chance to capture their fair share of the value created by
    the global startup economy
    • We have created the most comprehensive,
    authoritative startup ecosystem research ever done by far
    Since then, we have made a mark on the Global Startup Ecosystem:
    Our Success Factor Model currently incorporates 10 key Success Factors that capture the essence of what
    makes a startup and startup ecosystems in its entirety successful
    Surveys in:
    3M+
    Companies covered in
    our dataset
    100k
    Founders & executives
    covered through
    primary research
    Data from:
    45+
    Countries
    280+
    Cities

    View Slide

  25. © 2022
    SG Science: The Success Factor Model represents the factors most
    strongly correlated with success based on our global research
    RESOURCES
    TEAM LOCAL ECOSYSTEM
    NETWORKS
    (Knowledge flow)
    PERFORMANCE
    RESOURCE ATTRACTION
    ECOSYSTEM EXPERIENCE
    TALENT FUNDING
    FOUNDER ORGANIZATIONS
    LOCAL
    CONNECTEDNESS
    GLOBAL
    CONNECTEDNESS
    GLOBAL
    MARKET REACH
    ECOSYSTEM
    VALUE
    STARTUP
    OUTPUT
    ECONOMIC IMPACT
    RESOURCE RECYCLING EXITS
    Local
    System
    Global
    System
    25

    View Slide

  26. © 2020
    © 2022
    RESOURCES
    TEAM LOCAL ECOSYSTEM
    NETWORKS
    (Knowledge flow)
    PERFORMANCE
    RESOURCE ATTRACTION
    ECOSYSTEM EXPERIENCE
    TALENT FUNDING
    FOUNDER ORGANIZATIONS
    LOCAL
    CONNECTEDNESS
    GLOBAL
    CONNECTEDNESS
    GLOBAL
    MARKET REACH
    ECOSYSTEM
    VALUE
    STARTUP
    OUTPUT
    ECONOMIC IMPACT
    RESOURCE RECYCLING EXITS
    Local
    System
    Global
    System
    26
    The Success Factor Model: Overview of Local System and Global
    System Overview
    Local Success Factors are the most important at the early stages of ecosystem growth to support the
    development of a thriving community. The success metric for a growing startup community is Startup Output, i.e.,
    the number of startups within the ecosystem. A larger startup community creates enough critical mass to advance
    to the next stages of startup ecosystem growth
    Global Success Factors become critical for ecosystems in the later phases of the Ecosystem Lifecycle, i.e., from the
    later stages of the Activation phase onwards (Phase II: Globalization and beyond). Critical mass at the local level
    helps drive the virtuous cycle of ecosystem growth. Success at the Global Systems level is measured by Global
    Market Reach, i.e., the percent of sales to foreign ecosystems and Connections to top ecosystems

    View Slide

  27. © 2020
    © 2022
    Success Factor Model: Definitions
    27
    Success
    Factors
    Ecosystem Experience
    Global resources and startup knowledge
    acquired and generated over time to help
    accelerate the startup ecosystem
    Global Market Reach
    The proportion of sales to foreign
    ecosystems
    Global Connectedness
    Global networks that facilitate the inflow of
    global knowledge and best practices for local
    founders to build globally leading products
    Resource Attraction
    The gravitational pull of an ecosystem in
    drawing in entrepreneurs and startups from
    elsewhere
    Founder
    Success factors related to the startup
    founder, under his or her control, or internal
    to the start-up as opposed to external
    Organizations
    Availability, expertise and presence of specialized
    programs of Entrepreneurial Support Organizations
    Talent
    Measures Founder’s access to key positions
    in terms of quality, expertise and cost
    Funding
    The level and growth of Early-Stage funding,
    looking at both access and quality
    Local Connectedness
    The quality and volume of connections that
    exist between binding the local startup
    community together
    Startup Output
    The number of startups in an ecosystem
    Local System Success Factors
    Global System Success Factors

    View Slide

  28. © 2020
    © 2022
    Success Factor Model
    Founder
    RESOURCES
    TEAM LOCAL ECOSYSTEM
    NETWORKS
    (Knowledge flow)
    PERFORMANCE
    RESOURCE ATTRACTION
    ECOSYSTEM EXPERIENCE
    TALENT FUNDING
    FOUNDER ORGANIZATIONS
    LOCAL
    CONNECTEDNESS
    GLOBAL
    CONNECTEDNESS
    GLOBAL
    MARKET REACH
    ECOSYSTEM
    VALUE
    STARTUP
    OUTPUT
    ECONOMIC IMPACT
    RESOURCE RECYCLING EXITS
    Local
    System
    Global
    System
    28
    Founder: Factors concerning the profile of founders themselves, their experiences and motivations
    Founder DNA:
    • Founder team background, Founder Experience, Founder Demographics
    Ambition:
    • Founders targeting large addressable markets

    View Slide

  29. © 2020
    © 2020
    © 2022
    SG Science: Founder DNA and Ambition factors are indicative of
    wider Ecosystem trends
    29
    • Founder DNA includes:
    • Team: Skills, relevant sub-sector experience, and size of the
    founder team
    • Founder Background: Demographic profile and if they were
    attracted to the ecosystem to found their startup
    • Financial Situation: Socioeconomic background and
    knowledge of other funding opportunities
    • The composition of teams is imperative to see if the startups have
    a team that brings their own set of skills, experiences, and vision to
    the table, which leads to better innovation, growth, customer
    satisfaction, and profitability
    Key Founder Factors
    Founder DNA
    High Ambition
    Motivation
    Unique Selling
    Proposition
    Total Addressable
    Market Size
    Team
    Background
    Financial Situation
    • High Ambition Includes:
    • Motivation: Change the world, build a great product
    • Unique Selling Proposition: First in the world vs. Better or
    Cheaper
    • Total Addressable Market: $30B as a proxy for global
    market potential
    • We explore founders’ ambition in the ecosystem through the
    competitiveness of their business models, their motivation or
    purpose, and their ability to address larger markets

    View Slide

  30. © 2020
    © 2022
    Almost half of Detroit Founders had previously founded a
    startup, contrary to stakeholder feedback
    Detroit Startup Serial Founder Analysis Detroit Startup Founding Team Breakdown
    30
    Positively, on average almost half of the founders and co-
    founders of startup founding teams in Detroit claim to have
    founded a startup before
    A high percentage of startups having at least one serial
    founder shows the presence of Startup Experience in the
    founding team, increasing success chances in the long run
    15%
    85%
    Startups having no serial founder
    Startups having at least one serial founder
    54%
    46%
    % of founding team having no startup founder
    experience before
    % of founding team who founded a startup before
    Serial Founder: A Founder or co-founder of a startup who has previously founded or co-founded another startup
    The values for
    Detroit are based
    on 47 survey
    responses
    FOUNDER

    View Slide

  31. © 2020
    © 2022
    Background: Detroit startups have a high proportion of founders
    with business degrees
    65%
    92%
    91%
    88%
    79%
    86%
    59%
    Global Average
    40%
    60%
    80%
    100%
    82%
    73%
    64%
    65%
    79%
    67%
    93%
    Global Average
    40%
    60%
    80%
    100%
    Business Founder Team Technical Founder Team
    31
    Business Founder Team: Percentage of startups with at least one founder with a business background
    Technical Founder Team: Percentage of startups with at least one founder with a technical background
    FOUNDER

    View Slide

  32. © 2020
    © 2022
    16%
    19%
    15%
    14%
    16%
    23%
    8%
    Global Average
    0%
    10%
    20%
    30%
    Boston Miami Houston Detroit Toronto-Waterloo Melbourne Tel Aviv
    Female Founders
    32
    Detroit has an average proportion of Female Founders
    The values for
    Detroit are based
    on 41 survey
    responses
    FOUNDER
    This metric is not a direct comparison between Detroit and its peer ecosystems as it represents the proportion of female founders and it varies due to the
    distinct demographics of each ecosystem

    View Slide

  33. © 2020
    © 2022
    LGBTQ Founders
    33
    Participation: LGBTQ Founders
    3%
    5%
    2%
    6%
    3%
    7%
    0%
    2%
    4%
    6%
    8%
    Calgary Indiana Detroit Melbourne Miami Toronto-Waterloo
    The values for
    Detroit are based
    on 31 survey
    responses
    FOUNDER

    View Slide

  34. © 2020
    © 2022
    Racial Minority Founders
    34
    Participation: Racial Minority Founders
    21%
    14%
    22%
    16%
    36%
    25%
    0%
    10%
    20%
    30%
    40%
    Calgary Indiana Detroit Melbourne Miami Toronto-Waterloo
    FOUNDER
    This metric is not a direct comparison between Detroit and its peer ecosystems as it represents the proportion of founders who come from a racial
    minority background and it varies due to the distinct demographics of each ecosystem. The values for Detroit are based on 40 survey responses.

    View Slide

  35. © 2020
    © 2022
    Racial/Ethnic Background Breakdown of Respondents % Education levels of Respondents
    35
    Breakdown of Ethnic Background & Education Level By
    Respondents
    From the 22% of Respondents who identified as being a racial
    minority, more than half belong to Hispanic or Black/African-
    American backgrounds
    13%
    38% 38%
    13%
    0%
    10%
    20%
    30%
    40%
    Asian - Eastern Black/ African-
    American
    Hispanic Mixed race
    Asian - Eastern Black/ African-American
    Hispanic Mixed race
    56%
    4%
    7%
    11%
    22%
    Graduate Degree (Masters)
    Graduate Degree (PhD)
    Some College
    Some Graduate School
    Undergraduate Degree (Bachelors)
    FOUNDER

    View Slide

  36. © 2020
    © 2022
    Founders in Detroit are older than those in other ecosystems
    36
    37
    40
    43
    38
    41.9
    38
    Global Average
    30
    35
    40
    45 45
    Founder Age
    73%
    87% 87%
    95%
    75%
    90%
    83%
    Global Average
    40%
    60%
    80%
    100%
    Founders Aged 30+
    FOUNDER

    View Slide

  37. © 2020
    © 2022
    2.33
    2.03
    1.94
    2.40
    2.22
    2.06
    2.50
    Global Average
    1
    2
    3
    69%
    59%
    52%
    68% 67%
    57%
    79%
    Global Average
    20%
    40%
    60%
    80%
    Founder Team Number Startups with 2 or 3 Founders
    37
    Most Detroit founding teams have a 2 or 3-member founding
    team, the sweet spot
    Founder teams with 2-3 members
    have been found to be optimal
    FOUNDER

    View Slide

  38. © 2020
    © 2022
    81% 80%
    72% 73%
    70%
    65%
    72%
    Global Average
    40%
    60%
    80%
    100%
    17%
    2%
    23%
    27%
    34%
    16%
    31%
    Global Average
    0%
    20%
    40%
    Founders with Personal Financial Support at Formation Founders Aware of 3rd Party Financial Support at Formation
    Personal Financial Support: Percentage of founders who had or were sure of financial support from personal sources such as savings, family, spouse, or friends
    Third-Party Financial Support: Percentage of founders who were aware of third-party support such as insurance, loans, or grants
    38
    The proportion of founders in Detroit with awareness of 3rd party
    financial sources while establishing their startup is average
    FOUNDER

    View Slide

  39. © 2020
    © 2022
    26%
    19% 19%
    13%
    16% 15%
    29%
    Globalization Average
    0%
    10%
    20%
    30%
    Boston Miami Houston Detroit Toronto-Waterloo Melbourne Tel Aviv
    Founders with High Ambition
    Founders with High Ambition: Percentage of founders who show high ambition, measured as those targeting an addressable
    market at least $30B in size, striving to change the world or make a lot of money with a new or niche idea
    The percentage of founders in Detroit with High Ambition is below
    the phase average
    39
    FOUNDER

    View Slide

  40. © 2020
    © 2022
    Gaps in Founder Ambition stem from a relatively few proportion
    targeting very large, $30B+ Markets
    Globalization Average
    0%
    15%
    30%
    45%
    Globalization Average
    60%
    70%
    80%
    90%
    100%
    Founders Claiming Differentiated
    Product
    Globalization Average
    40%
    50%
    60%
    70%
    80%
    40
    Founders with High Motivation: Percentage of entrepreneurs who are motivated by changing the world, getting rich, or developing a great product
    Founders Claiming Differentiated Product: Percentage of entrepreneurs who claimed to have either a new global product, niche, or a product that no one else
    has launched successfully
    $30B+ Total Addressable Market: Percentage of entrepreneurs whose addressable market size is at least $30 Billion
    FOUNDER
    Founders with High Motivation
    (e.g., want to change the world)
    $30B+ Total Addressable Market

    View Slide

  41. © 2020
    © 2022
    Detroit has produced more $100M+ exits than other Globalization
    Phase peers in the US, despite lower average ambitions
    41
    0
    2
    4
    6
    8
    10
    12
    14
    Houston Atlanta Detroit Denver-Boulder Miami
    Exits Count (#)
    we only need an ambitious few to drive
    these numbers home…
    Number of Exits Over $100M (2019-H12022)

    View Slide

  42. © 2020
    © 2020
    © 2022
    Detroit’s Founders come from a variety of backgrounds but are
    lacking key early-stage support
    42
    Interview Findings*
    More Business
    Founders, lack of
    CEO Talent
    Higher Founder
    Age
    Low proportion of
    Ambitious
    Founders
    Low Awareness of
    3rd Party Financial
    Sources
    Ecosystem
    representation
    does not match
    population
    Most Founders in Detroit
    come from a business
    background, while the
    proportion of Founders
    with a technical
    background falls short of
    the global average.
    However, many Detroit
    stakeholders stated that
    they feel the exact
    opposite is true and that
    the ecosystem is sorely
    lacking executive business
    talent, which decreases
    Detroit startups’
    competitiveness
    The average Founder age
    at a Detroit startup is 45
    years old and 95% are
    above 30, one of the
    oldest averages Startup
    Genome has ever
    recorded. An older
    founder age is reflective of
    an ecosystem where
    Founders are transitioning
    from a full career into the
    startup space. This may
    well benefit the
    development of more
    complex technology
    solutions and applications
    The proportion of Detroit
    founders with High
    Ambition is lower than
    many peers. Many experts
    commented that
    Midwestern identity and
    cultural factors cause
    Founders to shy away
    from the grandeur and the
    reputation of building a
    globally leading company,
    and that being a Midwest-
    based startup is still widely
    stigmatized as being
    considered “2nd class”
    compared to coastal
    ecosystems
    A large proportion of
    Founders in Detroit are
    supported by personal
    financial sources,
    indicating lower founder
    participation from lower
    socio-economic
    backgrounds. This also
    suggests that a lower
    proportion of Founders
    are aware of the presence
    of third-party financial
    support, such as
    government grants or
    loans for startups when
    starting their
    entrepreneurial journey
    Around 1/5th of Detroit
    Founders identify as being
    part of a “Racial Minority”,
    and just under 10%
    identified as being
    Black/African American.
    Given that the city of
    Detroit was 77% Black/
    African American at the
    last US census,
    participation in Detroit’s
    ecosystem differs
    significantly from the
    makeup of the community
    overall
    *Findings reflect the
    aggregate opinions
    of key stakeholders
    in Detroit and do
    not necessarily
    reflect data-based
    findings of Detroit’s
    performance
    FOUNDER

    View Slide

  43. © 2020
    © 2022
    Success Factor Model
    Local Connectedness
    RESOURCES
    TEAM LOCAL ECOSYSTEM
    NETWORKS
    (Knowledge flow)
    PERFORMANCE
    RESOURCE ATTRACTION
    ECOSYSTEM EXPERIENCE
    TALENT FUNDING
    FOUNDER ORGANIZATIONS
    LOCAL
    CONNECTEDNESS
    GLOBAL
    CONNECTEDNESS
    GLOBAL
    MARKET REACH
    ECOSYSTEM
    VALUE
    STARTUP
    OUTPUT
    ECONOMIC IMPACT
    RESOURCE RECYCLING EXITS
    Local
    System
    Global
    System
    43
    Local Connectedness: Strength of the community, meaningful relationships founders hold with key stakeholders
    Relationships:
    • Founder relationships with other Founders, Investors and Experts
    Sense of Community :
    • Informal help received by founders from key stakeholders

    View Slide

  44. © 2020
    © 2022
    SG Science: Local Connectedness – The quality of the local
    community
    44
    • Our global research has identified community as one of the
    strongest factors correlating with ecosystem performance
    • This metric comprises two principal sub-factors:
    • Sense of Community Index: a sub-factor of Local
    Connectedness capturing the degree to which founders
    informally receive help from investors, experts, and
    fellow founders
    • Number of Relationships Between Founders: number of
    quality relationships between local founders, where they
    know each other and can call upon each other for help
    “this week”
    • Here, we discuss the importance of a high-quality community in
    general (what is the impact of community, all other factors left
    equal?) and its current level of development in Detroit
    Local Connectedness is a multi-variable assessment of the local community, including the Sense of Community and Local Relationships
    between founders, investors, and experts within an ecosystem.
    Sense of Community
    Local Relationships
    Founder Help
    Investor & Expert
    Help
    Founder
    Relationships
    Investor
    Relationships
    Expert
    Relationships
    LOCAL CONNECTEDNESS

    View Slide

  45. © 2020
    © 2022
    0.0
    0.2
    0.4
    0.6
    0.8
    1.0
    1 2 3 4 5
    Startup’s Quarterly Revenue ($M)
    Age of Startup (In years)
    Quarterly Revenue vs Age of Startup
    SG Science: Startups with higher Local Connectedness
    grow faster and have more potential for bigger exits
    High Local Connectedness
    Medium Local Connectedness
    Low Local Connectedness
    45
    • An analysis of over 2,000
    surveyed startups from
    across the world was
    conducted by Startup
    Genome to analyze the
    relationship between Local
    Connectedness and revenue
    growth
    • It was observed that
    startups with high Local
    Connectedness grew 2.1x
    faster than startups with low
    Local Connectedness

    View Slide

  46. © 2020
    © 2022
    6.8
    5.7
    6.7 6.7
    6.4 6.5
    7.1
    3
    4
    5
    6
    7
    8
    Boston Miami Houston Detroit Toronto-Waterloo Melbourne Tel Aviv
    Detroit’s Local Connectedness Index is in line with its peers
    46
    Local Connectedness Index: Index measuring the extent to which the founders are locally connected with other founders, and investors in a startup community
    Local Connectedness Index
    LOCAL CONNECTEDNESS

    View Slide

  47. © 2020
    © 2022
    7.6
    6.6
    6.8
    8.0
    7.2
    6.7
    7.8
    6
    7
    8
    9
    Detroit’s Founders have stronger networks but are not receiving
    as much informal help as peers in other ecosystems
    47
    Sense of Community Index: Index measuring the extent to which the startup community is helping each other
    Relationship Index: Index measuring the engagement of founders with other founders, investors and experts
    6.4
    5.2
    6.6
    6.1 6.0
    6.3
    6.6
    4
    5
    6
    7
    Relationship Index Sense of Community Index

    View Slide

  48. © 2020
    © 2022
    Founder Relationships: Average number of relationships to other local startup founders and executives
    Investor Relationships: Average number of relationships to local investors
    Expert Relationships: Average number of relationships to local experts other than investors
    Founders in Detroit have a high number of quality connections with
    other founders and investors
    Expert Relationships
    Founder Relationship Metrics
    19.5
    17.5
    16.5
    23.3
    18.2
    15.3
    21.5
    12
    14
    16
    18
    20
    22
    24
    Investor Relationships
    7.2
    5.4
    5.2
    9.1
    6.1
    5.2
    7.6
    4
    5
    6
    7
    8
    9
    10
    9.6
    6.6
    8.2 8.3
    8.6
    8.4
    9.5
    4
    5
    6
    7
    8
    9
    10
    Founder Relationships
    48
    LOCAL CONNECTEDNESS

    View Slide

  49. © 2020
    © 2022
    Founder Relationships: Average number of relationships to other local startup founders and executives
    Investor Relationships: Average number of relationships to local investors
    Expert Relationships: Average number of relationships to local experts other than investors
    Within the Detroit Region, Founders in The City of Detroit are
    much less connected than in Ann Arbor
    49
    Founder Relationships
    27.5
    19.8
    0
    10
    20
    30
    Investor Relationships
    12.1
    6.6
    0
    5
    10
    15
    Expert Relationships
    10.4
    6.3
    3
    6
    9
    12
    Detroit (Ecosystem) Relationship Index
    7.6
    6.6
    6.8
    8.0
    7.2
    6.7
    7.8
    6
    7
    8
    9

    View Slide

  50. © 2020
    © 2022
    Local Founder Help: Average hours of help founders received from other founders and executives in the last two weeks
    Local Investor & Expert Help: Average hours of help founders received from local investors and experts in the last two weeks
    Detroit Founders support one another but are receiving less
    tangible help from other stakeholders than their peers
    3.3
    2.2
    4.3
    3.4
    3.3
    3.9
    4.0
    1
    2
    3
    4
    5
    3.2
    2.2 2.2
    2.3 2.3
    2.1
    2.8
    0
    1
    2
    3
    4
    Local Investor & Expert Help
    Local Founder Help
    50
    LOCAL CONNECTEDNESS

    View Slide

  51. © 2020
    © 2020
    © 2022
    Detroit’s Local Connectedness is high overall, though Founders
    receive less help from Investors and Experts than their peers
    Local Connectedness
    Sense of Community
    Founder Helping
    Each Other
    Investors and
    Expert Help
    Quality Relationships
    Founder
    Relationships
    Investor
    Relationships
    Expert
    Relationships
    • Founders look out for one another: Founders feel
    they are “in this together” to build and scale their
    startups in Detroit and are eager to support and
    connect with one another in this effort
    • Disconnected Regional Hubs: Communities across
    Southeast Michigan (i.e., Ann Arbor and Detroit) do not
    have strong connections between one another and
    there is no singular center of gravity for the ecosystem
    • Founders vs. Investors: Founders feel that local
    investors are not reliable partners and hold startups
    back. Investors feel that founders lack the know-how to
    effectively engage with investors and that the
    ecosystem lacks sufficient deal flow
    • The Covid Factor: While meetups and community
    gatherings were on an upward trajectory, this was
    dashed by Covid and has not yet bounced back
    Interview Findings
    51
    The Color-Coded Summary scores are based on Detroit’s performance in this
    Success Factor from survey data as well as secondary data. Findings have been
    sourced from Validation Interviews
    LOCAL CONNECTEDNESS
    Above Phase Average
    Equal to Phase Average
    Below Phase Average

    View Slide

  52. © 2020
    © 2022
    Success Factor Model
    Global Connectedness and Global Market Reach
    RESOURCES
    TEAM LOCAL ECOSYSTEM
    NETWORKS
    (Knowledge flow)
    PERFORMANCE
    RESOURCE ATTRACTION
    ECOSYSTEM EXPERIENCE
    TALENT FUNDING
    FOUNDER ORGANIZATIONS
    LOCAL
    CONNECTEDNESS
    GLOBAL
    CONNECTEDNESS
    GLOBAL
    MARKET REACH
    ECOSYSTEM
    VALUE
    STARTUP
    OUTPUT
    ECONOMIC IMPACT
    RESOURCE RECYCLING EXITS
    Local
    System
    Global
    System
    52
    Global Connectedness: Measurement of how connected Founders are to globally-leading startup knowledge
    • Relationships with peers in Top Ecosystems, Immigrant Founders
    Global Market Reach: Focus, ability and customer share of local startups to sell to Top Ecosystems Nationally and Globally
    • Founder Ambition, Founder Strategy

    View Slide

  53. © 2020
    © 2022
    % of Entrepreneurs Globally
    Connected to Ecosystem
    Top Global Markets of Startup Innovation
    Where startups from all over the world
    compete for global customers
    53
    SG Science: Silicon Valley, NYC and London are the
    nexus of the Global Fabric of startup ecosystems

    View Slide

  54. © 2020
    © 2020
    © 2022
    SG Science: Globally-Connected ecosystems achieve greater Global
    Market Reach, realizing their ecosystem’s scaleup potential
    Toronto
    Boston
    Chicago
    New York City
    Silicon Valley
    0%
    10%
    20%
    30%
    40%
    50%
    0 4 8 12 16
    Global Connectedness (Scaleup Potential)
    (# of Founder Relationships in Top Ecosystems)
    Global Market Reach (Realize Potential)
    (% of Out of Continent Customers)
    Size of bubble indicates
    Ecosystem Value
    54

    View Slide

  55. © 2020
    © 2020
    © 2022
    SG Science: Startups that go-global early see their revenue
    grow faster, receive larger funding rounds and are more
    likely to become scaleups1
    55
    B2B Startup Revenue Growth vs. Global Market Reach
    Linear Regression
    lines based on
    thousands of startups
    0
    50
    100
    150
    200
    250
    1 2 3 4 5
    Monthly Revenue ($K)
    Time (years)
    Globally-focused Startups
    - 2.1 x Revenue Growth
    - Accelerate Quicker
    - More Scaleups
    >50% Foreign
    Customers
    <50% Foreign
    Customers
    * Data is based off Startup Genome’s Voice of the Entrepreneur global survey
    1. A scaleup is a startup with a valuation of $100M or more
    2. Globally-Focused Startups: Startups focused on targeting a customer base outside their country
    3. Nationally-Focused Startups: Startups focused on targeting customers within their country

    View Slide

  56. © 2020
    © 2022
    SG Science: Global Connectedness & Global Market are
    closely related to Scaleup1 production
    56
    Global Market Reach + Global Connectedness Score
    vs. Exit Value – by Ecosystem
    Silicon Valley
    New York City
    London
    Berlin
    Toronto
    Houston
    -2.00
    -1.50
    -1.00
    -0.50
    0.00
    0.50
    1.00
    1.50
    2.00
    -1.00 -0.80 -0.60 -0.40 -0.20 0.00 0.20 0.40 0.60 0.80 1.00
    Exit Value
    (Index)
    Market Reach Success Factor2 (Incl. Global Connectedness)
    (Index)
    1. A scaleup is a startup with a valuation of $100M or more
    2. The Market Reach Success Factor Measures early-stage startup access to customers allowing them to scale and “Go-Global” from the onset

    View Slide

  57. © 2020
    © 2022
    Detroit startups are mainly selling to the National market, and
    International expansion is not top of mind
    57
    26.8%
    14.3%
    11.0%
    8.8%
    7.1%
    9.6%
    6.7%
    0.18
    0%
    10%
    20%
    30%
    40%
    Customers Outside Continent
    30% 30%
    19%
    13%
    10%
    12%
    11%
    22%
    0%
    10%
    20%
    30%
    40%
    Customer Outside Country
    GLOBAL MARKET REACH

    View Slide

  58. © 2020
    © 2022
    Detroit Founders have few connections in Top International
    Ecosystems and do not claim to have Globally-Leading products
    58
    Connections to Top International Ecosystems: Average number of significant relationships founders have with founders from Berlin, Tel Aviv, London, and Shanghai
    Globally Leading Product: Percentage of startups that are developing a new product
    5.4
    3.9
    2.1
    3.5
    1.2
    5.3
    1.05
    Globalization Average
    0
    2
    4
    6
    Boston Miami Houston Detroit Indiana Austin Atlanta
    Connections to Top International Ecosystems (non-US)
    40%
    31%
    43%
    33%
    40%
    44%
    51%
    Global Average
    20%
    30%
    40%
    50%
    60%
    Founders Claiming Globally-Leading Product
    GLOBAL CONNECTEDNESS

    View Slide

  59. © 2020
    © 2022
    Despite a lack of global focus, Detroit Founders have a good number of
    connections in Top National Ecosystems, supporting scaleup potential
    59
    Top Global Ecosystems: Average number of significant relationships startup leaders have with founders from SV, NYC, Berlin, Tel Aviv, London, and Shanghai
    High Ambition: Percentage of founders who show high ambition across multiple factors
    Connections to Top Ecosystems: National and Global
    5.4
    3.9 3.5
    5.3
    1.1 2.1
    12.6
    10.2 10.0
    10.3
    9.2
    6.0
    0
    5
    10
    15
    20
    Boston Miami Detroit Austin Atlanta Houston
    Number of Connections
    Connections to Other Top Global Ecosystems Connections to New York City and Silicon Valley
    GLOBAL CONNECTEDNESS

    View Slide

  60. © 2020
    © 2022
    0
    0.2
    0.4
    0.6
    0.8
    Melbourne Detroit Houston Indiana Atlantic
    Canada
    60
    Local Meeting: Average number of startup leaders from Berlin, Tel Aviv, London and Shanghai that entrepreneurs from your ecosystem have met locally (this shows the
    degree to which entrepreneurs from top ecosystem travel to your ecosystem)
    Travel to Top International Ecosystems: Average number of startup leaders who have traveled 2 or more times to top ecosystems (stated above) in the last 2 years
    0
    0.4
    0.8
    1.2
    Melbourne Detroit Houston Indiana Atlantic
    Canada
    Local Meeting Travel to Top International Ecosystems
    All peers presented were assessed after the beginning of the COVID-19 Pandemic
    GLOBAL CONNECTEDNESS
    Detroit Founders were able to meet more with their connections
    from top ecosystems as compared to their national peers

    View Slide

  61. © 2020
    © 2022
    Detroit ‘s proportion of Immigrant Founders1 is far below the
    American average
    61
    Immigrant Founders
    1. Immigrant Founder: An individual who immigrated into the country as an adult and founded a company according to our criteria
    30%
    46%
    22%
    10%
    13%
    9%
    16%
    0%
    10%
    20%
    30%
    40%
    50%
    Boston Miami Houston Detroit Indiana Austin Atlanta
    GLOBAL CONNECTEDNESS
    American Average

    View Slide

  62. © 2020
    © 2020
    © 2022
    Detroit has room to grow in connecting with Top Ecosystems
    to benefit from leading centers of knowledge
    62
    Interview Findings
    • Limited Founder Ambition: Detroit’s
    Founders do not claim to have globally-
    leading products and are not targeting
    customers in top international markets
    • COVID-19’s Impact: Covid limited both
    Detroit Founder’s ability to travel to top
    ecosystems and to meet with connections
    locally from globally leading ecosystems
    • Networks are National: Detroit-based
    Founders have fewer quality relationships
    with peers in globally leading ecosystems
    than their national peers
    Expected to
    improve
    Global
    Market Reach
    Founder Ambition
    Globally Leading
    Product
    Founder Strategy
    Global
    Connectedness
    Networking
    Local
    Meetings
    International
    Travel
    Immigrant
    Founders
    Potential
    The Color-Coded Summary scores are based on Detroit’s performance
    in this Success Factor from survey data as well as secondary data.
    Findings have been sourced from Validation Interviews
    GLOBAL CONNECTEDNESS
    Above Phase Average
    Equal to Phase Average
    Below Phase Average

    View Slide

  63. © 2020
    © 2022
    Success Factor Model
    Talent
    RESOURCES
    TEAM LOCAL ECOSYSTEM
    NETWORKS
    (Knowledge flow)
    PERFORMANCE
    RESOURCE ATTRACTION
    ECOSYSTEM EXPERIENCE
    TALENT FUNDING
    FOUNDER ORGANIZATIONS
    LOCAL
    CONNECTEDNESS
    GLOBAL
    CONNECTEDNESS
    GLOBAL
    MARKET REACH
    ECOSYSTEM
    VALUE
    STARTUP
    OUTPUT
    ECONOMIC IMPACT
    RESOURCE RECYCLING EXITS
    Local
    System
    Global
    System
    63
    Talent: Measurement of the access startups have to critical employees, namely software developers and
    customer acquisition roles (i.e., marketing, hypergrowth, scaling roles)
    • Experienced Software Engineers, Experienced Growth Employees
    Experienced Software Engineers: Percentage of software engineers with at least 2 years of Startup Experience prior to joining this startup
    Experienced Growth Employees: Percentage of growth (customer acquisition) employees with at least 2 years of Startup Experience prior to joining this startup

    View Slide

  64. © 2020
    © 2022
    SG Science: Talent Success Factor correlates very highly
    with Ecosystem Performance
    64
    Silicon Valley
    New York City
    London
    Beijing
    Toronto
    Chicago
    Houston
    -1.50
    -1.00
    -0.50
    0.00
    0.50
    1.00
    1.50
    2.00
    -1.00 -0.80 -0.60 -0.40 -0.20 0.00 0.20 0.40 0.60 0.80 1.00
    Performance Model1
    (index, generally a log function)
    Talent Success Factor2 (all independent of ecosystem size)
    Talent Success Factor vs. Performance Model
    1. The performance model analyses indicators like exits, funding and startup output to capture the economic outcomes in a startup ecosystem
    2. The talent success factor assesses the availability of software development and customer acquisition talent to Startups

    View Slide

  65. © 2020
    © 2022
    72%
    41%
    48%
    50%
    53%
    42%
    80%
    Globalization Average
    0%
    20%
    40%
    60%
    80%
    Average Proportion of Startup-Experienced Growth
    Employees
    80%
    66%
    46%
    39%
    64%
    30%
    74%
    Globalization Average
    0%
    20%
    40%
    60%
    80%
    Average Proportion of Startup-Experienced Software Engineers
    Startup-Experienced Software Engineers Startup-Experienced Growth Employees
    Values represented refer to the average proportion of a Detroit startup’s percentage of experienced employees
    Experienced Software Engineers: Average proportion of software engineers in each startup with at least 2 years of Startup Experience prior to joining this startup
    Experienced Growth Employees: Average proportion of Growth (customer acquisition) employees with at least 2 years of Startup Experience prior to joining this startup
    65
    Detroit suffers
    from a lack of
    accessible
    technical
    software talent.
    Founders have
    difficulty in hiring
    technical
    software talent
    and are
    outcompeted on
    salary by other
    ecosystems
    Detroit Startups have less access to Startup-Experienced
    Software Engineers but can access Growth Employees
    TALENT

    View Slide

  66. © 2020
    © 2022
    Ecosystems across the globe have witnessed a decline in access to
    Experienced Software Engineers (less so for growth talent)
    53%
    37%
    50%
    48%
    64%
    33%
    56%
    60%
    0%
    20%
    40%
    60%
    80%
    Helsinki Manila Melbourne Houston
    44%
    36%
    31%
    45%
    72%
    39%
    73%
    71%
    0%
    20%
    40%
    60%
    80%
    Helsinki Manila Melbourne Houston
    Experienced Software Engineers – 2019 vs 2021/2022
    Change from
    2019-20 >>
    Experienced Growth Employees – 2019 vs 2021/2022
    2019 Value
    2022/21 Value
    -39% -37%
    -70%
    -8% -17% -20%
    -39%
    +12%
    66
    TALENT
    Values represented refer to the average proportion of a Detroit startup’s percentage of experienced employees
    Average Proportion of Startup-Experienced Software Engineers
    Average Proportion of Startup-Experienced Growth Employees

    View Slide

  67. © 2020
    © 2022
    Proportion of Female Software Engineers (%)
    67
    Participation: Female Software Engineers
    22%
    25%
    35%
    41%
    26%
    14%
    0%
    10%
    20%
    30%
    40%
    50%
    Calgary Indiana Detroit Melbourne Miami Toronto-Waterloo
    TALENT
    Average Proportion of Female Software Engineers
    This metric is not a direct comparison between Detroit and its peer ecosystems as it represents the proportion of female software engineers who have
    experience working in a startup and it varies due to the distinct demographics of each ecosystem. The values for Detroit are based on 26 responses.

    View Slide

  68. © 2020
    © 2022
    20%
    25%
    32% 33%
    64%
    48%
    0%
    15%
    30%
    45%
    60%
    75%
    Calgary Indiana Detroit Melbourne Miami Toronto-Waterloo
    Proportion of Racial Minority Software Engineers (%)
    68
    Participation: Software Engineers from a Racial Minority
    TALENT
    Average Proportion of Racial Minority Software Engineers
    This metric is not a direct comparison between Detroit and its peer ecosystems as it represents the proportion of engineers from a racial minority background
    who have experience working in a startup and it varies due to the distinct demographics of each ecosystem. The values for Detroit are based on 26 responses.

    View Slide

  69. © 2020
    © 2020
    © 2022
    Detroit scores somewhat below average on Talent in relation to
    Globalization stage ecosystems
    69
    TALENT
    Interview Findings*
    Experienced
    Software Engineers
    are needed
    High-level talent
    hard to come by
    Founders are
    Midwest Modest
    Universities are
    very strong
    nationally
    Perceptions that
    Mobility is the sole
    focus
    Detroit is below the
    Globalization average for
    Experienced Software
    Engineers. Founders and
    Experts commented that
    fundamental changes to
    make Detroit an attractive
    location to live and work in
    are needed to be able to
    incentivize both local
    Talents to stay in the
    ecosystem and to entice
    needed Talent from
    outside the ecosystem to
    take jobs at Detroit-based
    startups
    Detroit Founders struggle
    to find affordable high-level
    Talent in-state and are
    often forced to contract
    talent out of state. Detroit
    Founders have commented
    on the extreme difficulty in
    sourcing leading executive-
    level positions, with some
    C-suite positions staying
    vacant for almost two years
    before a suitable candidate
    is found
    Many founders
    commented that the
    cultural norms of the
    Midwest are related to
    hard work and grit, but also
    to humility. This has led to
    a pattern where Founders
    are less comfortable
    steering their startups
    towards high-speed scaling
    and in pursuing higher
    valuations during
    investment rounds.
    Founders generally feel
    that the stigma that the
    Midwest is a second-class
    region in the country for
    entrepreneurship persists
    The University of Michigan
    has the highest amount of
    research dollars for any
    public institution in the
    country. Students come
    from across the nation
    (and some internationally)
    to Detroit, however many
    startups founded through
    the University of Michigan
    (and through other
    universities) are not able to
    be properly supported
    locally due to a lack of
    resources and funding
    opportunities and end up
    moving to other
    ecosystems
    Local stakeholders
    universally commented
    that they perceive Detroit’s
    traditional identity, most
    profitable companies, state
    initiatives, and universities
    to be solely focusing on the
    Mobility sector. They feel
    this has resulted in other
    sectors in Detroit, namely
    Life Sciences and
    Cybersecurity, not receiving
    adequate levels of support
    from public funding
    sources and programmatic
    initiatives
    *Findings reflect the
    aggregate opinions
    of key stakeholders
    in Detroit and do
    not necessarily
    reflect data-based
    findings of Detroit’s
    performance

    View Slide

  70. © 2020
    © 2022
    Success Factor Model
    Ecosystem Experience
    RESOURCES
    TEAM LOCAL ECOSYSTEM
    NETWORKS
    (Knowledge flow)
    PERFORMANCE
    RESOURCE ATTRACTION
    ECOSYSTEM EXPERIENCE
    TALENT FUNDING
    FOUNDER ORGANIZATIONS
    LOCAL
    CONNECTEDNESS
    GLOBAL
    CONNECTEDNESS
    GLOBAL
    MARKET REACH
    ECOSYSTEM
    VALUE
    STARTUP
    OUTPUT
    ECONOMIC IMPACT
    RESOURCE RECYCLING EXITS
    Local
    System
    Global
    System
    70
    Ecosystem Experience: The depth and diversity of the pool of prior experience in the ecosystem through funding and large
    exits
    Scaling Experience:
    • Large Exits, Hypergrowth Experience
    Startup Experience:
    • Advisors, Employee Stock Options

    View Slide

  71. © 2020
    © 2022
    Globalization Average
    0.0
    1.0
    2.0
    3.0
    Average Ecosystem
    Experience
    Exits ≥ USD 50m in
    the last 10 years
    Founder Team
    Hypergrowth
    Experience
    Advisors with Equity Stock Options to All
    Employees
    Ecosystem Experience Index
    1.38
    0.61
    1.10
    1.71
    2.12
    Scaling Experience Startup Experience
    71
    Detroit’s higher Ecosystem Experience1 has yet to result in a string
    of large exits in comparison to peers in the Globalization phase
    1. Ecosystem Experience: Summary of Scaling Experience (record of creating or working at high-value startups) and Startup Experience (culture of providing
    and accepting equity and stock options as incentives)
    2. Hypergrowth Experience: Percentage of founders in the team who previously worked for 2+ years at a startup with a valuation of $100M+
    48% of respondents
    gave stock options
    to all employees
    43% of respondents
    had at least one
    advisor with equity
    Detroit’s Ecosystem Experience
    Detroit observed 11
    exits that were >=
    $50M in value
    2

    View Slide

  72. © 2020
    © 2022
    Success Factor Model
    Organizations
    RESOURCES
    TEAM LOCAL ECOSYSTEM
    NETWORKS
    (Knowledge flow)
    PERFORMANCE
    RESOURCE ATTRACTION
    ECOSYSTEM EXPERIENCE
    TALENT FUNDING
    FOUNDER ORGANIZATIONS*
    LOCAL
    CONNECTEDNESS
    GLOBAL
    CONNECTEDNESS
    GLOBAL
    MARKET REACH
    ECOSYSTEM
    VALUE
    STARTUP
    OUTPUT
    ECONOMIC IMPACT
    RESOURCE RECYCLING EXITS
    Local
    System
    Global
    System
    72
    * Results from the Organizations sections are based on validation interviews with Founders and Stakeholders, not survey data
    Organizations: Availability and quality of Entrepreneurial Support Organizations such as Incubators,
    Accelerators, or co-working spaces

    View Slide

  73. © 2020
    © 2022
    Stakeholders universally feel there is no standout organization that
    gathers the whole ecosystem or leads strategy
    73
    ESO*: Entrepreneurial Support Organization - Incubators, Accelerators, Coworking Spaces, Startup Support Programs, etc.
    Unclear Ecosystem Strategy
    ”…Struggles with identity and
    collaboration, …competitive
    environment where we don’t work
    together on behalf of founders.
    …not organized and unified”
    – ESO Leader
    Declining Public Funding
    “Up until 2016, the state budget to
    support entrepreneurship was 25M
    USD. Nowadays budget is 12-13M”
    - Investor and Researcher
    Low Ambition
    “Founders in Detroit are less
    ambitious than on the coast,
    Midwesterners are humble and
    conservative, there’s a more “honest”
    approach from local founders”
    - Fintech Founder
    Cultural Ambition Issues
    “In NYC…very ambitious element to
    the culture that doesn’t quite exist in
    Detroit. Successes in NYC energize
    and feed off each other, …Detroit
    has no hunger for big thinking”
    - Founder and ESO* Leader
    ORGANIZATIONS

    View Slide

  74. © 2020
    © 2022
    Many Detroit Stakeholders believe that startup support
    organizations have more potential to help the ecosystem
    74
    Weak ESO Landscape
    “Many incubators and accelerators
    have failed, … Our few ESOs are
    untested and inexperienced, there’s
    more support for SMEs and brick
    and mortar companies”
    Siloed ESOs
    “ESOs all have a piece of the puzzle
    but don’t share with one another,
    …we lack coordination on what
    services we provide”
    Limited Focus on High-Growth
    Ventures
    ”ESOs in Detroit are less successful
    …many resources end up diluted
    they have a broader mandate for
    SMEs and Mom & Pop shops”
    ESOs Not Trusted
    “The most important piece of advice I
    can give to upcoming entrepreneurs
    is to not take any ESO* advice but to
    focus on building their company”
    ORGANIZATIONS
    – ESO* Leader and Investor
    – ESO Leader and Investor - Leading ESO Leader
    – Leading Founder
    ESO*: Entrepreneurial Support Organization - Incubators, Accelerators, Coworking Spaces, Startup Support Programs, etc.

    View Slide

  75. © 2020
    © 2022
    Success Factor Model
    Early-Stage Funding
    RESOURCES
    TEAM LOCAL ECOSYSTEM
    NETWORKS
    (Knowledge flow)
    PERFORMANCE
    RESOURCE ATTRACTION
    ECOSYSTEM EXPERIENCE
    TALENT FUNDING
    FOUNDER ORGANIZATIONS
    LOCAL
    CONNECTEDNESS
    GLOBAL
    CONNECTEDNESS
    GLOBAL
    MARKET REACH
    ECOSYSTEM
    VALUE
    STARTUP
    OUTPUT
    ECONOMIC IMPACT
    RESOURCE RECYCLING EXITS
    Local
    System
    Global
    System
    75
    Early-Stage Funding: Volume and quantity of Seed and Series A deals raised by startups in the ecosystem
    Key Measurements:
    • Seed Round Median, Series A Median, Number of FTEs Funded

    View Slide

  76. © 2022
    Silicon Valley
    New York City
    London Beijing
    Toronto
    Houston
    -1.50
    -1.00
    -0.50
    0.00
    0.50
    1.00
    1.50
    2.00
    -1.00 -0.80 -0.60 -0.40 -0.20 0.00 0.20 0.40 0.60 0.80 1.00
    Performance Model1
    Funding Success Factor2
    Funding Success Factor vs. Performance Model
    SG Science: The Funding Success Factor correlates very
    highly with Ecosystem Performance
    76
    1. The performance model analyses indicators like exits, funding and startup output to capture the economic outcomes in a startup ecosystem
    2. The Funding Success Factor measures the growth of early-stage funding, looking at both access and quality

    View Slide

  77. © 2020
    © 2020
    © 2022
    Detroit’s Early-Stage Funding gaps in relation to other Globalization-
    Stage ecosystems holds back its scaling potential
    77
    Interview Findings
    • Gaps in Early-Stage Funding: While the Seed Round
    Median and percentage of seed-funded startups in
    Detroit is in line with its peers, the impact is
    minimized by raising costs of doing business in terms
    of ballooning costs for software developer talent
    • Angels Not Activated: “Michigan Angel Groups are
    great places to pitch but horrible to actually raise
    capital”. Founders express frustration at the risk
    averse nature of current Michigan-based angel
    networks, while others commented on a clear need
    to activate more HNIs in the region
    • Moderate Success Rate: Despite the lower number
    of seed-funded startups, late-stage funding in Detroit
    is going strong, as depicted by the attrition funnel.
    The proportion of Series C-funded startups in Detroit
    is greater than its peers in the same phase
    Seed Series A
    Large
    Rounds
    Median
    Median Size
    &
    # of FTEs Funded
    Median Size
    Best % $1M+ % of $10M rounds
    Many
    Rounds
    % Seed-Funded
    Startups
    Survival
    Rate
    The Color-Coded Summary scores are based on
    Detroit’s performance in this Success Factor from
    survey data as well as secondary data. Findings
    have been sourced from Validation Interviews.
    FUNDING
    Above Phase Average
    Similar to Phase Average
    Below Phase Average

    View Slide

  78. © 2020
    © 2022
    $1.20
    $0.66
    $0.48
    $0.51 $0.50 $0.53
    $1.30
    $0.0
    $0.4
    $0.8
    $1.2
    $1.6
    Boston Miami Houston Detroit Toronto-Waterloo Melbourne Tel Aviv
    Seed Median Round Size ($M) (2019-1H2021)*
    78
    Funding rounds often suffer a reporting lag between the time the deal is made and when it is properly logged in a leading online database. As such, it
    is possible that not all recent deals are reflected, as visibility on funding activity becomes more accurate once reporting has caught up to actual activity
    * Not based on Startup Genome data -- Based on Pitchbook, Crunchbase and Dealroom and subject to normal issues with funding data
    While Detroit’s Seed rounds are of similar size to some of its
    peers in the same phase…..
    FUNDING

    View Slide

  79. © 2020
    © 2022
    ….. Average Software Engineer Salaries are rising in Detroit…..
    $107.91
    $99.97
    $94.02 $93.81
    $72.04
    $68.45
    $87.63
    $0
    $30
    $60
    $90
    $120
    Boston Miami Houston Detroit Toronto-Waterloo Melbourne Tel Aviv
    Average Software Engineer Salary* ($K)
    79
    * Not based on Startup Genome data -- Based on Indeed, Builtin, Glassdoor, Payscale and ZipRecruiter data from 2022
    FUNDING
    Startups have faced unstable business landscape. Recent trends of ballooning costs of software engineers, the Covid-19 pandemic, the “great resignation”
    and inflationary concerns in the US have raised the cost of doing business near universally for founders

    View Slide

  80. © 2020
    © 2022
    Relative to the high cost of software engineering talent, startups
    in Detroit receive relatively low seed rounds
    Funding Runway* (Seed Median Round / Average Software Engineer Salaries)
    80
    11.12
    6.58
    5.11 5.47
    6.94
    7.71
    14.84
    0
    4
    8
    12
    16
    Boston Miami Houston Detroit Toronto-Waterloo Melbourne Tel Aviv
    Months
    Not based on Startup Genome data -- Based on Pitchbook, Crunchbase, and Dealroom and subject to normal issues with funding data
    *Funding Runway refers to the months a startup can fund their operations in terms of the seed median divided by the average software engineer salary
    FUNDING

    View Slide

  81. © 2020
    © 2022
    Approximately 25% of all seed rounds in Detroit are larger than one
    million dollars
    81
    % of Seed Rounds >=$1M (2019-1H2021)*
    37%
    29%
    27% 26%
    22%
    31%
    74%
    0%
    20%
    40%
    60%
    80%
    Boston Miami Houston Detroit Toronto-Waterloo Melbourne Tel Aviv
    * Not based on Startup Genome data -- Based on Pitchbook, Crunchbase and Dealroom and subject to normal issues with funding data
    319 100 37 211 75 542
    42
    Count of $1M+
    Seed Rounds
    870 340 145 967 239 740
    156
    Count of Seed
    Rounds
    FUNDING

    View Slide

  82. © 2020
    © 2022
    0%
    2%
    4%
    6%
    8%
    2017 2018 2019 2020 2021
    Boston Miami Houston Detroit Toronto-Waterloo Melbourne Tel Aviv
    The proportion of seed-funded startups in Detroit is relatively lower
    than most its peers
    % of Seed Funded Startups (2017-2021)*
    82
    * Not based on Startup Genome data -- Based on Pitchbook, Crunchbase and Dealroom and subject to normal issues with funding data
    52 60
    63
    43
    48
    FUNDING
    Decline from 2020-21 can be attributed to data lags in capturing seed rounds by global databases

    View Slide

  83. © 2020
    © 2022
    Series A rounds are lower on average, limiting startup growth
    83
    Series A Median Round ($M) (2019-1H2021)*
    $ 10.0 M
    $ 5.5 M
    $ 7.2 M
    $ 4.5 M
    $ 7.2 M
    $ 4.5 M
    $ 8.0 M
    $0
    $2
    $4
    $6
    $8
    $10
    $12
    Boston Miami Houston Detroit Toronto-Waterloo Melbourne Tel Aviv
    * Not based on Startup Genome data -- Based on Pitchbook, Crunchbase and Dealroom and subject to normal issues with funding data
    FUNDING

    View Slide

  84. © 2020
    © 2022
    Detroit Series A Deals are most often $1M-$5M, but half the
    total amount of Series A funding comes from the largest rounds
    84
    Deal Amount Deal Count Total Deal Amount
    <= $1M 3 $1.3M
    $1M - $2M 7 $11M
    $2M - $3M 10 $23M
    $3M - $4M 5 $17M
    $4M - $5M 8 $35M
    $5M - $6M 8 $42M
    $6M - $7M 4 $25M
    $7M - $8M 2 $15M
    >=$8M 13 $178M
    Total 60 $347.3M
    FUNDING

    View Slide

  85. © 2020
    © 2022
    The proportion of Series A-funded startups in Detroit has
    increased since 2019
    % of Series A Funded Startups (2017-2021)*
    85
    0%
    1%
    2%
    3%
    4%
    2017 2018 2019 2020 2021
    Boston Miami Houston Detroit Toronto-Waterloo Melbourne Tel Aviv
    15
    6
    21
    21
    23
    * Not based on Startup Genome data -- Based on Pitchbook, Crunchbase and Dealroom and subject to normal issues with funding data
    FUNDING

    View Slide

  86. © 2020
    © 2022
    43%
    22%
    26%
    13%
    20%
    13%
    32%
    0%
    15%
    30%
    45%
    Boston Miami Houston Detroit Toronto-Waterloo Melbourne Tel Aviv
    Detroit’s startups raise a lower proportion of large-ticket
    Series A rounds compared to their peers
    % of Series A Rounds >=USD $10M (2019-1H2021)*
    86
    * Not based on Startup Genome data -- Based on Pitchbook, Crunchbase and Dealroom and subject to normal issues with funding data
    154 16 5 45 12 112
    16
    Count of $10M+
    Series A Rounds
    361 73 38 223 90 345
    62
    Count of Series A
    Rounds
    FUNDING

    View Slide

  87. © 2020
    © 2022
    0%
    1%
    10%
    100%
    Startup Output Seed Series A Series B Series C
    Boston Miami Houston Detroit Toronto-Waterloo Melbourne Tel Aviv
    Detroit’s gaps in the attrition funnel stem from a lower proportion
    of Series A-funded startups
    Attrition Funnel (2017-2021)*
    87
    2017-19 2018-20 2019-21
    * Not based on Startup Genome data -- Based on Pitchbook, Crunchbase and Dealroom and subject to normal issues with funding data
    2020-21
    FUNDING
    • The Attrition
    Funnel is a
    graphical
    representation
    of the graduation
    rate of startups
    across funding
    stages
    • It is essential in
    identifying the
    funding gaps in
    the ecosystem
    Detroit has the
    highest drop-off
    from Seed to Series
    A among peers

    View Slide

  88. © 2020
    © 2022
    Angel groups and the Investor Community are not the
    strongest partners of local startups
    88
    Lack of Understanding
    “HNIs1 and wealth in Michigan is
    “old money”, not tech-focused, …
    most angels have an SME2 profile
    and don’t know how to invest in
    innovative companies”
    Bias Against Mid-West Startups
    “There is still an antiquated mindset
    around “companies raising capital
    in the Midwest, …local investors
    end up being condescending
    towards Detroit startups”
    Risk-Averse Behavior
    “Angels and VCs are risk-averse, …
    Michigan angel groups are a great
    place to practice your pitch but a
    horrible place to raise capital”
    Few Local Investors
    “There are maybe five solid angels
    in all of Michigan, …I can’t think of
    a single startup that has raised
    capital exclusively in Michigan
    from Michigan investors”
    - Fintech Founder - Series A-Funded Founder
    - Leading Investor and Angel
    - Leading Investor and Angel
    FUNDING
    1. HNI: High Net-worth Individuals
    2. SME: Small and Medium-sized enterprises (non-startups)

    View Slide

  89. © 2020
    © 2022
    Success Factor Summary: Detroit Founders are well-connected but
    key local system gaps remain
    RESOURCES
    TEAM ECOSYSTEM
    NETWORKS
    (Knowledge flow)
    PERFORMANCE
    RESOURCE ATTRACTION
    ECOSYSTEM EXPERIENCE
    TALENT FUNDING
    FOUNDER ORGANIZATIONS
    LOCAL
    CONNECTEDNESS
    GLOBAL
    CONNECTEDNESS
    GLOBAL
    MARKET REACH
    SCALEUPS & EXITS
    STARTUP
    OUTPUT
    ECONOMIC IMPACT
    RESOURCE RECYCLING EXITS
    Local
    System
    Global
    System
    89
    The Color-Coded Summary scores are based on the data collected from the survey and broken down to reflect the
    performance of Detroit across each Success Factor. As performance is comparative to peer ecosystems in the Globalization
    Phase, red is behind the phase average, yellow is in line with the phase average while green is ahead of the phase average
    Above Phase Average
    Similar to Phase Average
    Below Phase Average

    View Slide

  90. © 2020
    © 2022
    Segment breakdown of Detroit Startups
    Funding breakdown of Detroit Startups
    90
    None
    17%
    Only Founders,
    Friends or
    Family invested
    so far
    5%
    Angel Grant, or
    Other Pre-Seed
    19%
    Seed
    34%
    Venture A
    10%
    Venture B
    15%
    Breakdown of Funding Stages & Market Segments By Respondents
    *B2C: “Business to Consumer”, these startups’ business model targets end consumers as customers
    *B2B: “Business to Business”, these startups’ business model targets other businesses as customers
    B2C
    5%
    B2B
    59%
    Marketplace
    0%
    Mixed
    36%

    View Slide

  91. © 2020
    © 2022
    Breakdown of Startup Age & Stage By Respondents
    Concept
    0%
    Development
    8%
    Product Ready
    & Free User
    13%
    Product Ready
    & No User
    2%
    Product Ready
    & Paying User
    34%
    Cash Flow
    Positive
    43%
    Startup Age Breakdown of Detroit (in years) Startup Stage Breakdown of Detroit
    91
    0 - 1
    6%
    1 - 2
    11%
    2 - 3
    6%
    3 - 4
    19%
    > 4
    58%
    Positively, over 75% of existing founders claim to have an
    operational product currently in the market
    The older average startup age shows that many startups in
    Detroit are either reaching a plateau in their growth or are
    experiencing a slower scaling journey than startups in other
    ecosystems

    View Slide

  92. © 2022
    Agenda
    Ecosystem Lifecycle Phase
    2
    Success Factor Assessment
    3
    92
    Innovation Edge
    4
    Way Forward
    5
    Introduction
    1

    View Slide

  93. © 2020
    © 2022
    The Innovation Edge aims to identify key opportunities for sub-
    sector specialization based on local, regional and global potential
    Local Ecosystem Strengths Positioning within Peer Group Global Potential
    Assessment of the factors that assess the
    local startup ecosystem’s strengths and
    potential
    Traditional Innovation
    Ecosystem
    Corporate
    Presence
    and
    Operations
    Universities
    and Higher
    Education
    Patents and
    R&D
    Market-Driven Business
    Model Innovation
    Startup
    Ecosystem
    Drivers
    Comparison of local performance and
    assets to relevant peer ecosystems
    Prioritization of top sub-sectors based on
    sub-sectors with highest local/regional
    strength and global potential
    93

    View Slide

  94. © 2020
    © 2022
    94
    Methodology: Sub-sector specialization potential is assessed by
    evaluating and quantifying startup sector performance and assets
    Traditional Innovation
    Ecosystem (assets)
    DRIVERS
    Corporations as customers,
    talent feeder, networks and
    knowledge base
    Entrepreneurial & market-
    driven culture
    Corporate Presence and Operations
    Universities and Higher Education
    Patents and R&D
    Collaborations
    Spin off
    PhDs ⇒ Entrepreneurs
    Talent
    Market-Driven Business
    Model Innovation
    Startup
    Ecosystem

    View Slide

  95. © 2020
    © 2020
    © 2022
    Startup Genome has deep capabilities in the assessment of 12
    broad technology sub-sectors
    95
    Adtech
    Agtech &
    New Food
    AI, Big Data &
    Analytics
    Industry 4.0
    Edtech
    Gaming Life Sciences
    Fintech
    Cybersecurity
    Cleantech
    Blockchain
    Blue
    Economy*
    *Assessed for some parts of the analysis

    View Slide

  96. © 2020
    © 2020
    © 2022
    96
    Sub-Sector Tagging Process
    Data Collection
    Our Machine Learning
    Algorithm, which has been
    fine-tuned over the years,
    creates and analyzes a dataset
    of startups, deals, and exits
    based on the tags provided by
    our main data partners.
    (Crunchbase, Dealroom, and
    Pitchbook)
    Keyword Tagging
    We process all startups using
    domain names as their unique
    identifier and assign a sub-
    sector to each startup based
    on keywords tagged to each
    sub-sector. For example,
    “clean energy” or “water
    treatment” are tagged to
    Cleantech
    Sub-Sector Scoring
    We determine the most likely
    sub-sector(s*) a startup is
    classified within based on
    industry tags provided by
    databases and their business
    description
    *Startups may be tagged to multiple sub-sectors depending on their activities and business models

    View Slide

  97. © 2020
    © 2020
    © 2022
    97
    Adtech Adtech Includes different types of analytics and digital tools used in advertising and
    marketing.
    Parrable
    Agtech & New Food Agtech captures the use of technology in agriculture and New food includes technologies that
    can be leveraged to food consumption related processes.
    Banza
    AI & BD AI, Big Data & Analytics refers to an area of technology devoted to extracting meaning from large
    sets of raw data
    Shoptelligence
    Blockchain Blockchain is a decentralized data storage method secured by cryptography, companies building
    this product on the top of this encrypted technology are defined as Blockchain companies
    EmaginePOS
    Cleantech Cleantech consists of sustainable solutions in the fields of energy, Water, Transportation,
    Agriculture and Manufacturing that include other related energy and water treatment systems.
    Intecells
    Blue Economy The Blue Economy is the sustainable use of ocean resources for economic growth, improved
    livelihoods, and job creation while preserving the health of the ocean ecosystem.
    Umitron
    Methodology: Tech Sub-Sectors: Definitions (1/2)
    Sub-Sector Definition Example

    View Slide

  98. © 2020
    © 2020
    © 2022
    Methodology: Tech Sub-Sectors: Definitions (2/2)
    98
    Gaming Gaming involves the development, marketing, and monetization of video games, gambling
    machines, and associated services
    Elm Park Labs
    Life Sciences Life Sciences is the sector concerned with diagnosing, treating, and managing diseases and
    conditions. It includes startups in Biotech, Pharma, and Medtech (also referred to as medical devices).
    Forever Labs
    Edtech Edtech refers is devoted to the development and application of tools (including software,
    hardware, and intended to redesign traditional products and services in education. Alchemie
    Fintech Fintech Includes startups which aim to improve existing processes, products, and services in the
    Financial Services industry (including insurance) via software and modern technology
    Bankjoy
    Cybersecurity Cybersecurity is the body of technologies, processes and practices designed to protect networks,
    computers, programs, and data from attack, damage or unauthorized access. Censys
    Industry 4.0 Industry involves startups working on smart technology to improve traditional manufacturing of
    products/services and robotics
    May Mobility
    Sub-Sector Definition Example

    View Slide

  99. © 2020
    © 2020
    © 2022
    Tech Sub-Sectors: Rankings Methodology
    99
    Factors
    Performance
    Funding
    Talent
    Knowledge
    Experience
    Focus
    Legacy
    Overview
    Measure of actual, leading, current, and lagging indicators of
    sub-sector performance
    Analysis of the funding landscape for sub-sectors at the early
    and late stages
    Assessment of the availability and quality of talent available to
    startups across sub-sectors
    Analysis of the patent activity in an ecosystem mapped to
    startup sub-sectors
    Long-term view of big-ticket exits and venture A deals in an
    ecosystem, as a proxy for team experience across sub-sectors
    Measure of concentration of the volume of startups in an
    ecosystem
    Strength of traditional industries that relate to sub-sectors
    within an ecosystem
    Main Components
    Exits, Startup Output (volume) and startup
    success within a sub-sector over 5 years
    Volume of early and late-stage funding deals
    in a sub-sector
    Quality and quantity of top subjects from
    Shanghai Rankings mapped to sub-sectors
    Volume and complexity of over 100 patent
    classes mapped to sub-sectors
    Large-ticket exits and Series A rounds in a
    sub-sector (10-year horizon)
    Proportion of startups related to a sub-sector
    in an ecosystem
    Market Cap and Employees in large
    companies within traditional sectors

    View Slide

  100. © 2020
    © 2022
    0
    0.1
    0.2
    0.3
    0.4
    0.5
    0.6
    0.7
    0.8
    0.9
    1
    0 1
    Global Potential
    Ecosystem Potential
    Low High
    Low High
    Moonshots
    Experiment
    Low Priority
    Divest
    Smart
    Specialization
    Invest
    Sustain
    Advantage
    Maintain
    100
    Methodology: Design a focused sub-sector strategy based on local
    strengths and global competitive positioning
    Overview
    • The Innovation Edge Framework
    assesses sub-sector areas which
    perform well both locally and globally
    • Utilize the Innovation Edge as
    guidance to assess high-potential
    areas
    Ecosystem Potential: A numeration of Detroit’s sub-sector performance across multiple factors (funding, exits, startup concentration, and traditional ecosystem factors
    such as R&D, corporations, and industries) relative to ~300 ecosystems
    Global Potential: Scores relative to the performance of each sub-sector compared to one another in ~300 ecosystems globally in terms of Series A Funding and Exit
    growth over the last five years
    Smart Specialization: Sub-sectors in this quadrant are both strong locally and seeing a global rise in performance, representing the strongest potential
    Sustain Advantage: Sub-sectors in this quadrant are strong locally but less so globally. Nonetheless, these are areas not to be overlooked due to the local advantage
    Moonshots: Sub-sectors in this quadrant are not strong locally but are rapidly increasing globally in performance. While local performance is currently weak, this
    represents an area to invest in
    Innovation Edge Framework

    View Slide

  101. © 2020
    © 2020
    © 2022
    Detroit has high potential to develop specializations within
    Cybersecurity, Life Sciences, Industry 4.0, Fintech and AI & BD
    Overview
    • Cybersecurity is the highest locally
    performing sub-sector and is a strong
    candidate to foster
    • Life Sciences has potential as a leading sub-
    sector, although stiff competition exists
    within the region
    • Anchored by local legacy corporations,
    strong potential for Industry 4.0 exists both
    within Detroit and globally
    • The need for a regional Artificial Intelligence
    and Big Data (AI & BD) strategy is critical to
    build on existing strengths and support
    growth of other sectors
    Bubble size indicates local density of startups
    in a sub-sector compared to the global
    average. Larger density implies higher than
    average density or emerging cluster
    Smart Specialization targets for highest-
    performing sub-sectors locally and globally
    Adtech
    Industry 4.0
    Agtech & New Food
    AI & BD
    Blockchain
    Cleantech
    Cybersecurity
    Edtech
    Fintech
    Gaming
    Life Sciences
    Global Potential
    Ecosystem Potential
    Low
    Low High
    High
    101
    Detroit’s Innovation Edge (2017-2021)
    Based on inputs from global databases, including PitchBook, Crunchbase, Dealroom, USPTO, WIPO, Shanghai Rankings

    View Slide

  102. © 2020
    © 2020
    © 2022
    Detroit has a strong legacy and overall performance in Mobility, which
    appears mainly in Industry 4.0, followed by Cleantech and AI & BD
    102
    Industry 4.0
    AI & BD
    Cleantech
    Global Potential
    Ecosystem Potential
    Low
    Low High
    High
    Mobility-Related Sub Sectors
    Industry 4.0: Introducing sensors and
    software to optimize the manufacturing
    process of the Mobility sector
    Example: Internet of Things (IoT) Solutions,
    Additive Manufacturing
    Cleantech: Solutions specifically related to
    minimizing the carbon footprint of the Mobility
    sector.
    Example: Energy Storage, Micro-Mobility,
    Fleetification, asset efficiency
    AI & BD: Incorporating automated, robotic
    or analytical solutions to the Mobility sector.
    Example: Autonomous Vehicles, Predictive
    Maintenance, In-Vehicle Experience
    Bubble size indicates local density of startups
    in a sub-sector compared to the global
    average. Larger density implies higher than
    average density or emerging cluster
    Smart Specialization targets for highest-
    performing sub-sectors locally and globally

    View Slide

  103. © 2020
    © 2020
    © 2022
    Sub-Sector Adtech
    Agtech &
    New food
    AI & BD Blockchain Cleantech
    Cyber
    Security
    Edtech Fintech Gaming
    Industry
    4.0
    Life
    Sciences
    Overall 71 106 56 80 63 34 40 51 79 43 39
    Performance 60 78 110 85 67 34 26 39 93 23 58
    Funding 92 88 50 89 59 33 58 73 71 50 32
    Startup
    Experience
    59 59 42 50 29 32 37 55 81 44 24
    Focus 107 86 95 154 101 139 160 79 181 137 70
    Knowledge 103 107 98 108 83 99 123 60 130 88 112
    Talent 13 7 7 13 22 11 6 13 18 8 7
    Legacy 137 66 66 42
    Detroit exhibits relative strengths in Cybersecurity, Life Sciences,
    Edtech and Industry 4.0
    Global Sub-Sector Ranks for Detroit out of 300 Ecosystems
    Startup
    Ecosystem
    Traditional
    Innovation
    Ecosystem
    103
    Rankings are based on Startup Genome’s Global Startup Ecosystem Report and sub-sector methodologies

    View Slide

  104. © 2020
    © 2020
    © 2022
    104
    Innovation Edge Key Takeaways: Industry 4.0 and Life Sciences
    emerge as the sub-sectors with the highest potential
    • Cybersecurity is the best-performing sub-sector locally in Detroit and strong potential exists to build upon additional
    specializations based on Life Sciences and Industry 4.0
    • Life Sciences and AI & BD witnessed the highest aggregate funding levels locally, while Detroit performs better
    in Industry 4.0 and Cybersecurity when compared to its peers
    • In terms of number and value of exits, Detroit performs higher than the peer average in Cybersecurity and Industry
    4.0
    • Industry 4.0 is characterized by a strong traditional innovation ecosystem, accelerated by
    the presence of high-performing traditional Industries (by revenue) like Mobility and Manufacturing
    • Life Sciences and AI & BD are the best-performing sub-sectors concerning University performance for Detroit locally
    followed by Industry 4.0
    • Detroit witnessed the highest levels of patent development in fields related to Industry 4.0 followed by AI & BD
    The Tech Sector
    The Traditional
    Innovation
    Ecosystem
    Overall Ecosystem
    Summary
    • Although Detroit performs well in Cybersecurity overall, the ecosystem has the potential to further specialize in
    additional tech sub-sectors, such as Life Sciences and Industry 4.0 powered by ttraditional industries related to these
    sub-sectors
    • Additionally, there is a need in the ecosystem to create a regional Artificial Intelligence and Big Data (AI & BD)
    strategy, representing a critical horizontal enabler of other sub-sectors that would allow Detroit to build on existing
    strengths and support growth of other sub-sectors, such as Industry 4.0

    View Slide

  105. © 2020
    © 2022
    We also looked at the key sector strengths within Detroit and
    benchmarked these against regional and comparable ecosystems
    105
    Chicago
    Pittsburgh
    Indianapolis
    Miami
    Columbus
    Toronto-Waterloo

    View Slide

  106. © 2020
    © 2020
    © 2022
    106
    Indexed Scores for all sub-factors (Peer Average = 10)
    Relative to its peers, Detroit has sub sector strengths in Industry
    4.0, Cybersecurity, Life Sciences and Cleantech
    Startup
    Ecosystem
    Traditional
    Innovation
    Ecosystem
    Adtech
    Agtech &
    New Food
    AI & BD Blockchain Cleantech
    Cyber
    security
    Edtech Fintech Gaming
    Industry
    4.0
    Life
    Sciences
    ESF Index
    LSF Index
    Exits Index
    Corporate
    Fabric Score
    University
    Score
    Patent Score
    2.3 2.5 5.2 2.0 4.8 8.4 3.1 2.9 3.4 11.3 6.6
    0 5.8 5.9 2.7 10.0 14.3 4.8 3.8 0 17.7 13.0
    3.7 4.6 1.8 1.9 5.2 49.7 7.6 5.6 1.5 15.1* 5.6
    - 5.1 - - 16.0 - - 7.7 3.8 15.9 6.2
    9.9 12.2 10.4 9.9 9.4 9.8 9.9 9.6 9.2 10.6 10.0
    10.5 5.7 12.2 9.4 12.5 9.4 5.9 9.8 6.1 12.8 9.4
    © 2022 *Excludes Rivian

    View Slide

  107. © 2020
    © 2022
    Detroit’s Startup Ecosystem has seen the strongest funding
    performances in Life Sciences, AI & BD and Industry 4.0
    Startup Sub-Sectors Early-Stage Funding1 in $M (2016-20)
    Volume Value
    Adtech 4 $4.3
    Agtech & New Food 4 $10.8 2 $42
    AI & BD 82 $213.3 14 $208.4
    Blockchain 9 $11.7 1 $10.3
    Cleantech 15 $16.6 3 $6.9
    Cybersecurity 20 $49.2 4 $152.3
    Edtech 9 $11.4 3 $14.3
    Fintech 25 $54.6 6 $111.8
    Gaming 5 $11.4
    Industry 4.0 34 $141.4 9 $85.2
    Life Sciences 53 $158.3 24 $377.7
    107
    Volume Value
    Late-Stage Funding2 in $M (2017-21)
    Early-Stage Funding: Seed + Series A deals
    Late-Stage Funding: Series B onwards Source: PitchBook, Dealroom and Crunchbase
    FUNDING

    View Slide

  108. © 2020
    © 2020
    © 2022
    Detroit’s best-performing sub-sectors within AI & BD are Industry
    4.0 and Mobility, followed by Fintech and Life Sciences
    Highest-funded sub-sectors within AI & BD
    0%
    5%
    10%
    15%
    20%
    25%
    30%
    0
    20
    40
    60
    80
    100
    120
    Industry 4.0 Transportation Fintech Life Sciences
    Millions
    Sum of Amount Percentage share
    Mobility
    FUNDING
    Examples

    View Slide

  109. © 2020
    © 2022
    0
    3
    6
    9
    12
    Adtech Agtech & New
    Food
    AI & BD Blockchain Cleantech Cybersecurity Edtech Fintech Gaming Industry 4.0 Life Sciences
    Early-Stage Funding Index
    Detroit’s Early-Stage Funding Index1 (2016-2020, Peer Average2=10)
    Detroit Peer average
    Detroit performs best in Early-Stage Funding in Industry 4.0,
    followed by Cybersecurity and Life Sciences
    1. The Early-Stage Funding Index is calculated using volume (70%) and value (30%) of Seed and Series A
    deals in the ecosystem (Source: PitchBook, Crunchbase and Dealroom)
    2. Peer Ecosystems include Chicago, Columbus, Indianapolis, Miami, Pittsburgh, Toronto-Waterloo 109
    EARLY-STAGE
    FUNDING

    View Slide

  110. © 2020
    © 2022
    0
    5
    10
    15
    20
    Adtech Agtech & New
    Food
    AI & BD Blockchain Cleantech Cybersecurity Edtech Fintech Gaming Industry 4.0 Life Sciences
    Late-Stage Funding Index
    Detroit’s Late-Stage Funding Index1 (2017-2021, Peer Average2=10)
    Detroit Peer average
    Detroit sees higher Late-Stage Funding performance than its
    peers in Industry 4.0, followed by Cybersecurity and Life Sciences
    1. The Late-Stage Funding Index is calculated using volume (70%) and value (30%) of Series B+ deals in the
    ecosystem (Source: PitchBook, Crunchbase and Dealroom)
    2. Peer Ecosystems include Chicago, Columbus, Indianapolis, Miami, Pittsburgh, Toronto-Waterloo 110
    Very low Very low
    LATE-STAGE
    FUNDING

    View Slide

  111. © 2020
    © 2022
    Detroit has witnessed higher exit activity in Cybersecurity and
    Industry 4.0
    1. The Exits Index is calculated using volume (70%) and value (30%) of exit deals in the ecosystem (Source: PitchBook, Crunchbase and Dealroom)
    2. Peer Ecosystems include Chicago, Columbus, Indianapolis, Miami, Pittsburgh, Toronto-Waterloo
    * Excludes Rivian
    111
    0
    5
    10
    15
    20
    Adtech Agtech & New
    Food
    AI & BD Blockchain Cleantech Cybersecurity Edtech Fintech Gaming Industry 4.0 Life Sciences
    Exits Index
    Detroit’s Exits Index1 (2017-2021, Peer Average=10)*
    Detroit Peer Average
    50
    STARTUP EXITS

    View Slide

  112. © 2020
    © 2022
    112
    Detroit saw its largest exit with the ~$68B Rivian IPO in 2021 by Rivian,
    greater than the exit value of all peer ecosystems in the last five years
    Peer Ecosystems include Chicago, Columbus, Indianapolis, Miami, Pittsburgh and Toronto-Waterloo
    0 10 20 30 40 50 60 70 80
    Aggregate Exit Value
    of all Peer
    Ecosystems
    Exit Value of
    Rivian.com
    In Billions, USD
    Exit Value of Rivian Vs. Aggregate Exit Value of Peer Ecosystems
    Rivian’s exit value of
    $67.7 B also accounts
    for almost 95% of the
    total exit value seen in
    Detroit from 2017-2021
    STARTUP EXITS

    View Slide

  113. © 2020
    © 2022
    Exit activity in Life Sciences and Industry 4.0 is the strongest, with
    velocity picking up in other sectors
    Exit: IPOs and M&As (#)
    Adtech 1 1 3 5
    Agtech & New
    Food
    1 1
    AI & BD 2 1 1 1 2 7
    Blockchain 1 1 2
    Cleantech 1 1 3 5
    Cybersecurity 1 3 3 1 8
    Edtech 1 3 4 8
    Fintech 3 2 1 1 7
    Gaming 1 1
    Industry 4.0 4 2 5 11
    Life Sciences 6 3 5 5 19
    TOTAL
    2018
    2017 2020
    2019 2021
    Source: PitchBook, Dealroom and Crunchbase 113
    STARTUP EXITS

    View Slide

  114. © 2020
    © 2022
    $50M+ Exits (#) in Detroit (2017 – 2021)
    Source: PitchBook, Dealroom and Crunchbase 114
    Detroit has witnessed most of its $50M+ Exits in Life
    Sciences followed by Industry 4.0
    Cybersecurity 1
    Edtech 1
    Fintech 1
    Industry 4.0 2
    Life Sciences 3
    Companies
    Sub-sector Count
    STARTUP EXITS

    View Slide

  115. © 2020
    © 2022
    Corporate
    Fabric
    University Lens Patent
    Creation and
    R&D
    Corporate Fabric acts as a
    backbone for the startup
    ecosystem by providing
    legacy strengths, potential
    clients and subject matter
    expertise
    Universities propel the
    startup ecosystem by
    providing a flow of talent,
    knowledge and expertise in
    the ecosystem
    Patents filed in the
    ecosystem are a measure of
    the innovation and R&D
    happening in the ecosystem
    115
    The traditional innovation ecosystem provides growth pillars for
    the development of the startup ecosystem

    View Slide

  116. © 2020
    Corporate Fabric

    View Slide

  117. © 2020
    © 2022
    117
    Corporate Fabric Analysis Methodology: Analyzing the top 100
    companies in the ecosystem by revenue
    Company Industry Legacy Industry to Sub Sector
    Automotive
    Industry 4.0 (Primary)
    Cleantech (Secondary)
    Step 1 Source the Top 100 enterprises (by revenue) in the ecosystem
    Step 2
    1. Leverage global databases and secondary research to assign corporations to their corresponding
    traditional sector
    2. Industry sectors were assigned to their corresponding tech sub-sector. To ensure proper
    representation of each corporation’s full scope of activities, weighted scores were assigned per sub-
    sector
    Step 3
    We derived relative scores across three metrics for each Sub Sector:
    1. Revenue (USD Million)
    2. Number of Companies
    3. Number of Companies with Revenue >50M USD
    CORPORATE FABRIC

    View Slide

  118. © 2020
    © 2022
    118
    Corporate Fabric Analysis Methodology: Rationale
    Identify
    existing sub-
    sector
    strengths
    Key Success Factors for startups concern existing talent and expertise within an ecosystem. The
    presence of large companies in the ecosystem signifies that ample high-level experienced individuals,
    both in terms of executives and employees, are present and will benefit startups in the corresponding
    sub-sector
    Define the
    local corporate
    market
    Startups are on a journey for product-market fit. Looking at the existing corporate environment in
    their own backyard is relevant to understand what opportunities exist for founders to target, broken
    down by sub-sector
    Collaboration
    and exit
    targets
    Many large companies seek to work with startups to increase their innovative capacity and their
    competitiveness. They do this by either launching joint projects with startups or acquiring outright
    innovative businesses, thus giving founders their long-sought-after exit opportunity
    CORPORATE FABRIC

    View Slide

  119. © 2020
    © 2020
    © 2022
    $9 $10 $10
    $13 $15
    $18 $19
    $27
    $132
    $148
    0.5 2.5 4.5 6.5 8.5 10.5
    0
    10
    20
    30
    40
    50
    60
    70
    0%
    10%
    20%
    30%
    40%
    50%
    60%
    70%
    Manufacturing Energy & Utilities Financial Services Retail &
    Ecommerce
    Contribution to Total Revenue # of Companies
    Others
    Manufacturing
    Finance
    Detroit’s ten biggest companies by Revenue ($B)
    Detroit’s Corporate landscape is dominated by Transportation and
    Manufacturing companies
    Top 5 Traditional Industries by Revenue
    © 2022
    The 2 largest companies in Detroit by revenue are much bigger than the rest and are driving all the value created by the ecosystem’s concentrated
    transportation sector.
    CORPORATE FABRIC

    View Slide

  120. © 2020
    © 2022
    120
    Volume
    Number of companies
    per sub-sector
    (33.3%)
    Anchors
    Number of companies
    in the sub-sector
    with Revenue >50M USD
    (33.3%)
    Value
    Revenue of companies in
    USD Million per sub-sector
    (33.4%)
    Corporate/Legacy Fabric Analysis: Quantification Framework
    CORPORATE FABRIC

    View Slide

  121. © 2020
    © 2022
    121
    Detroit – Tech Sub-Sector potential by Legacy Industry Concentration
    The biggest corporations in Detroit are associated with Industry 4.0,
    followed by Cleantech and Transportation
    5.5
    7.7
    4.4
    4.5
    0
    2
    4
    6
    8
    10
    Industry 4.0 Cleantech Fintech
    The highest volume of
    legacy industries in
    this sector
    Relative index for concentration of Legacy Industries within an ecosystem (10 = highest concentration)
    Disproportionately driven
    by Ford and General
    Motors
    CORPORATE FABRIC

    View Slide

  122. © 2020
    © 2022
    122
    Detroit – Legacy Industries (normalized to Peer Ecosystems1)
    Compared to its peers, Detroit sees a higher concentration of
    traditional companies in Cleantech and Industry 4.0
    16 15.9
    7.7
    6.2
    0
    4
    8
    12
    16
    Cleantech Industry 4.0 Fintech Life Sciences
    Corporate Fabric Index Score
    Detroit Peer Average
    1. Peer Ecosystems include Chicago, Columbus, Indianapolis, Miami, Pittsburgh, and Toronto-Waterloo
    CORPORATE FABRIC

    View Slide

  123. © 2020
    University Lens

    View Slide

  124. © 2020
    © 2022
    124
    1. Data sourced from Shanghai Rankings
    University Strengths Analysis Methodology: Linking courses to sub-
    sectors and analyzing their strengths
    Analyzing
    University
    Performance
    1. Identification of top universities in
    the ecosystem
    2. Mapped a set of 54 courses to the
    sub-sector they would have an
    impact on.
    For Example: Fintech will be mapped
    to Computer Science, Finance and
    Economics, etc.
    For each university and its courses, we
    sourced the following scores:
    A) Total Score1
    B) CNCI Score1
    C) Top Score1
    D) Number of Institutions
    E) Number of Courses
    Note: All scores are sourced from Shanghai
    Rankings
    For each sub-sector, we calculated the
    relative scores across all highlighted
    metrics
    Mapping University
    and Courses
    Analyzing
    University
    Performance
    Indexing to Peer
    Average
    UNIVERSITY LENS

    View Slide

  125. © 2020
    © 2022
    125
    Average of the
    Top Score
    (20%)
    Average of the
    Quality
    Score
    (35%)
    Number of
    Universities
    (20%)
    Average of
    the CNCI
    Score
    (5%)
    Number of
    Courses
    (20%)
    Universities appearing in the Shanghai Index are scored in the following
    categories:
    Total Score/Quality Score*: The total score is the linearly weighted sum
    of 6 indicator scores derived from the corresponding raw data. The
    indicators are as follows: Alumni score, (Award) score, Citation Score
    (CNCI), Nature and Science Publications, Science Citation Index, and
    publication scores divided by the number of full-time staff per
    department
    CNCI Score: The ratio of citations of papers published to the average
    citations of papers in the same category, organized by year and category
    of journal publication
    Top Score: Number of papers published in Top Journals in an Academic
    Subject for an institution. Top Journals are nominated by distinguished
    scholars through the Shanghai Ranking Academic Excellence Survey.
    Number of Universities: The unique counts of leading universities from
    an ecosystem ranked by Shanghai Rankings
    Number of Courses: The distinct number of programs or disciplines
    within an ecosystem ranked by Shanghai Rankings
    Shanghai Index Metrics Defined
    * Only the courses in the 100 rankings globally are assigned a total score.
    University Strengths Analysis Framework
    UNIVERSITY LENS

    View Slide

  126. © 2020
    © 2022
    Local View: Relative Scores of Sub-sectors based on University Strengths in Detroit
    126
    0
    2
    4
    6
    8
    10
    Performance Score
    Within Detroit, relative university strengths are in Life Sciences, AI &
    BD, and Industry 4.0
    All university strengths per sub-sector are compared and scored against the highest performing sub-sector in Detroit on this lens, which scores 10
    UNIVERSITY LENS

    View Slide

  127. © 2020
    © 2022
    Scores for Universities in Detroit per Sub-Sector (Normalized to Peer Average)
    127
    Relative to peer ecosystems, Detroit has stronger performance in
    Agtech & New Food, Industry 4.0, and AI & BD
    6
    8
    10
    12
    14
    Detroit Peer Average
    UNIVERSITY LENS

    View Slide

  128. © 2020
    © 2022
    0
    4
    8
    12
    16
    AdTech Industry 4.0 AgTech &
    New Food
    AI & BD Blockchain Blue
    Economy
    CleanTech Cyber
    Security
    EdTech FinTech Gaming Life
    Sciences
    Chicago Columbus Indianapolis Detroit Miami Pittsburgh Toronto-Waterloo Peer Average
    Scores for Universities per sub-sector (Normalized to Peer Average)
    128
    Relative to its peer ecosystems, Detroit is positioned in the
    middle of the pack in terms of university performance
    UNIVERSITY LENS

    View Slide

  129. © 2020
    Overview of Patent
    Creation

    View Slide

  130. © 2020
    © 2020
    © 2022
    Collected the patent creation data from WIPO and USPTO by applicant location and date for the past 10
    years
    Mapped the patents to the relevant sub-sector using IPC (Internal Patent Classification) codes
    For each sub-sector, we then calculated the scores based on the number of patents filed
    130
    Patent Creation and R&D Analysis Methodology
    PATENT CREATION

    View Slide

  131. © 2020
    © 2022
    Detroit local patent creation is strongest in Industry 4.0,
    followed by AI & BD and Life Sciences
    0
    2
    4
    6
    8
    10
    Patent Creation Index
    Local View: Patent Creation within Detroit per Sector
    131
    PATENT CREATION
    All sub-sectors are compared and scored against the highest patent creating sector in Detroit, which scores 10

    View Slide

  132. © 2020
    © 2022
    Detroit is strong in Industry 4.0, Cleantech, and AI & BD when
    compared to the peer average
    0
    5
    10
    15
    Patent Creation Index
    Detroit Peer average
    Detroit’s Patent Creation Performance (Normalized to Peer Average)
    132
    PATENT CREATION

    View Slide

  133. © 2020
    © 2022
    Patent Creation per Sector (Normalized to Peer Average)
    133
    Detroit’s patent creation lags behind Toronto-Waterloo and
    Chicago in all sub-sectors but outperforms other peers
    0
    5
    10
    15
    20
    25
    30
    35
    Chicago Columbus Indianapolis Detroit Miami Pittsburgh Toronto Waterloo Peer Average
    PATENT CREATION

    View Slide

  134. © 2022
    Agenda
    Ecosystem Lifecycle Phase
    2
    Success Factor Assessment
    3
    134
    Innovation Edge
    4
    Way Forward
    5
    Introduction
    1

    View Slide

  135. © 2022 135
    Focus Areas
    for Detroit
    • Founder community helps each other but while Ann Arbor is very connected,
    Detroit is much less so
    • Lack of center of gravity and cohesion across all stakeholders
    • Route to Scaling Success: Despite gaps in average ambition and scaleup program,
    the rate of $100M exits is good and so are connections to the top ecosystem
    • Portfolio of programs is generally considered of low quality
    • Portfolio of programs has not been managed and aligned to local strengths
    • New innovation centers bring some alignment to local strengths but will exacerbate
    dispersion and lack of coordination
    Community
    Startup Support
    Early-Stage Funding
    • Seed: small to no gap in seed-funding rate and amounts, but lack of local angel
    groups aligned to best practices that can lead and provide the needed capital and
    more
    • Series A: clear gaps: low success rate from seed to Ser. A and low median deal sizes,
    with local investors rarely able to lead sizeable rounds
    Our assessment underlines three key themes to prioritize to
    advance Greater Detroit’s Startup Ecosystem to the next level

    View Slide

  136. © 2022
    Grow a connected and entrepreneur-centric community with a
    strong culture of helping and learning from each other
    Develop a portfolio of sustainable local organizations that
    support startups through the stages and is adapted to
    ecosystem objectives and sub-sector strengths
    Community
    Startup Support
    Funding
    Ecosystem
    Leadership
    Grow a community of investors leveraging best practices and
    providing competitive access to capital, combined with
    mentorship, across stages and sub-sectors
    Build a leadership group and operating team with the
    resources to execute a shared vision that is driven by and
    accountable to objective ecosystem performance metrics
    136
    Leadership is needed to accelerate the development of
    Ecosystem Pillars

    View Slide

  137. © 2022
    © 2022
    The performance of 3 ecosystems stands out in the last 10
    years – each with a dedicated leadership team
    137
    1
    11
    21
    31
    41
    51
    61
    2012-13 2016-17 2018-19
    Global Rank by Exit Value
    Stockholm Toronto-Waterloo Amsterdam-StartupDelta

    View Slide

  138. © 2022
    © 2020
    © 2022
    138
    Communicate
    Commence
    (initiate)
    Connect Coordinate
    Support the success of
    existing initiatives,
    organizations, and programs
    Connect everyone:
    entrepreneurs, investors,
    universities, program
    leaders, corporations
    Define a strong vision,
    objectives and develop a
    narrative around it
    Align and foster cooperation
    between organizations and
    programs
    Key to accelerating startup ecosystems: entrepreneurial-minded
    teams focused on driving startup ecosystem success through action
    Culture
    Foster a culture of
    entrepreneurship and
    community support among
    all
    Cooperate
    (support)
    Kickstart new initiatives and
    programs that are missing

    View Slide

  139. © 2022
    © 2022
    Public-Private partnerships leading the
    Toronto-Waterloo ecosystems, driving action
    and advocating for policies with the provincial
    government
    We call them Keystone Teams
    Relevant Best Practice Examples
    Created in 2015 and supported by the City of
    Amsterdam, StartupAmsterdam kicked off
    dozens of projects and initiatives promoting
    innovative and sustainable entrepreneurship
    139
    In 2016, entrepreneurs in Frankfurt created a
    private innovation agency, Tech Quartier
    bringing startups, corporates, and new talent
    together
    Founded in 2019 as a nonprofit with an
    explicit goal of advocacy and programmatic
    initiatives to support founders in Ohio

    View Slide

  140. © 2022
    Detroit has been steadily climbing the Global Ecosystem
    Ranking—it can go further with the right action-oriented leadership
    140
    Detroit’s Annual Startup Ecosystem Ranking
    2019 2020 2021 2022
    Detroit Miami Houston
    63
    52
    53
    41
    #1
    Highest Ranked Emerging Ecosystem
    Startup Genome’s Global Startup Ecosystem Report 2022
    ▲12 Increase in Global Ecosystem Rank in 2022
    Startup Genome’s Global Startup Ecosystem Report 2022
    Key Highlights of Progress
    $91B
    Valuation of the Startup Ecosystem from 2019
    H2 to 2021 ($35B w/o Rivian)

    View Slide

  141. © 2020
    Contacts
    Marc Penzel
    +49 160 928 68929
    [email protected]
    Ethan Webster
    +49 176 313 40699
    [email protected]
    Pranav Arya
    +49 174 7811659
    [email protected]
    JF Gauthier
    +1 415 722 0345
    [email protected]

    View Slide