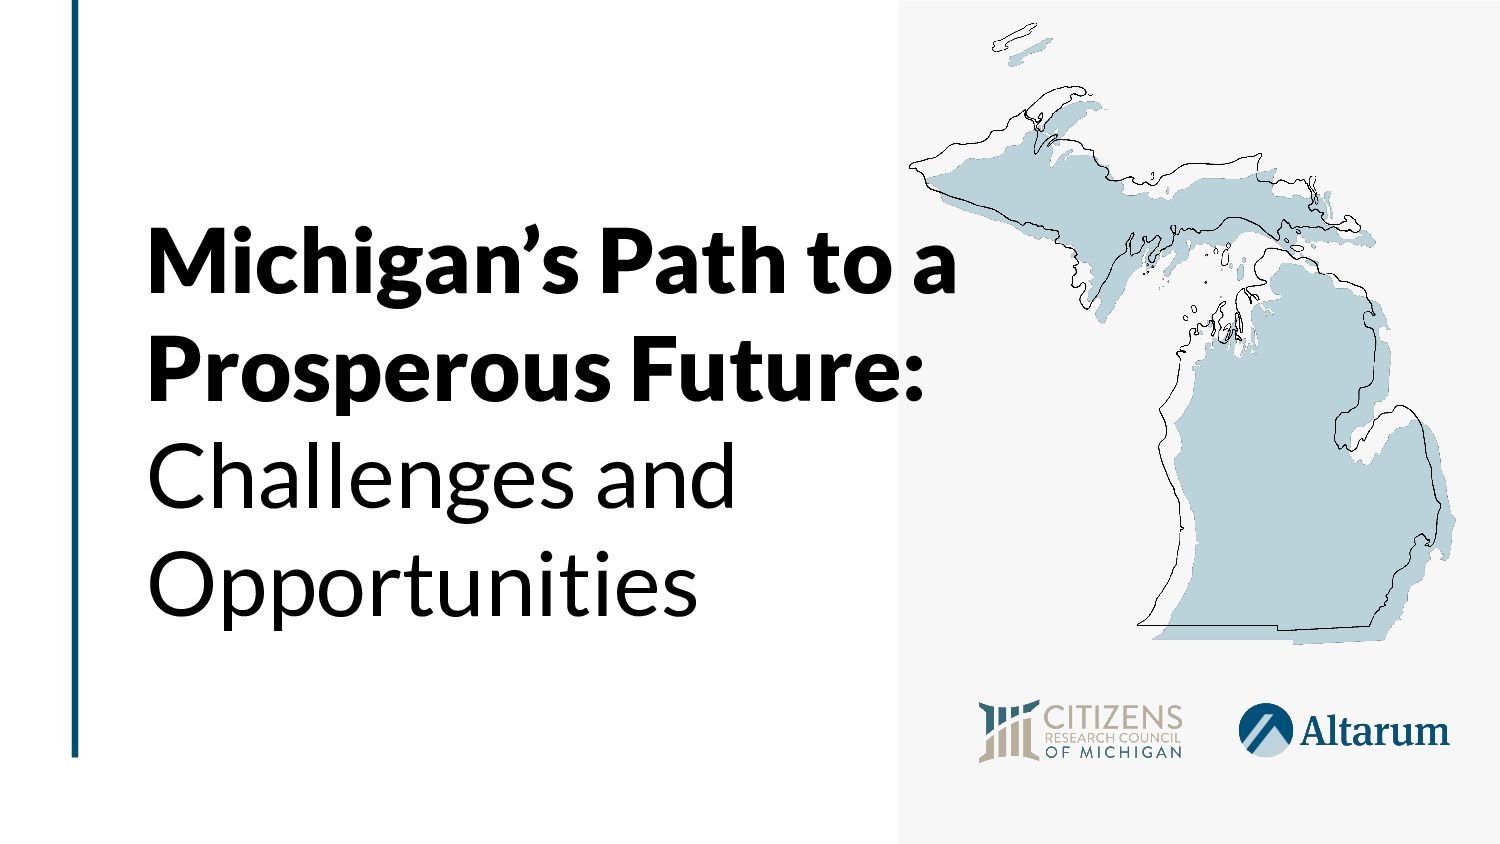
Citizens Research Council of Michigan and Altarum sobering report on Michigan's declining and aging population, delivered by Eric Lupher at A2YChamber's IMPACT, and previously the Detroit Regional Chamber's Mackinac Policy Conference in 2023.
Nonpartisan • Private not-for-profit • Promotes sound policy for state and local governments through factual research – accurate, independent and objective • Relies on charitable contributions from Michigan foundations, businesses, and individuals • #FactsMatter • www.crcmich.org 2
Citizens Research Council of Michigan and Altarum. This research presents a realistic, data-informed vision of Michigan’s future based on current trends and trajectories across multiple dimensions – demographics, economy, workforce, health, infrastructure, environment and public services. The project was funded by Charles Stewart Mott Foundation, The Kresge Foundation, Ralph C. Wilson, Jr. Foundation, Hudson-Webber Foundation, Grand Rapids Community Foundation, W.K. Kellogg Foundation, Max M. and Marjorie S. Fisher Foundation, Michigan Health Endowment Fund, The Joyce Foundation, The Skillman Foundation and the Ballmer Group. 3
was a global powerhouse of innovation, leading the world with its technological developments and manufacturing outputs. But not any longer. In short, other states are surpassing Michigan on a number of measures – economy, education, and infrastructure to name a few. Our ability to stay competitive in comparison to other parts of the country is in jeopardy. We are now finding ourselves in the bottom third of national rankings, including 36th in K-12 educational outcomes, 34th in per capita personal income, 39th in health outcomes, 45th in electric service reliability, and 47th in road condition. Michigan’s lack of population growth is at the root of many of these troubling trends. Michigan is suffering from brain drain, a shrinking workforce, declining health of its people, and a deteriorating infrastructure. All of this comes as racial and ethnic disparities across key indicators remain glaringly wide.
Decline, Creating Challenges for our Workforce, Economic Growth and Fiscal Outlook • Michigan’s population growth has been slow since the 1970s and we are losing ground to the rest of the country. • This gap will widen as Michigan’s population is projected to grow at one-third the U.S. rate. • On our current path, Michigan’s population will start to decline in a generation. • A declining population creates challenges for the state’s workforce, customer base, and tax base. • The state is also losing political influence, falling from 19 to 13 seats in the House of Representatives over the past 50 years. Cumulative Population Growth from 1950, U.S. and Michigan Sources of population data: U.S. Bureau of the Census (historical) and Jacob T. Burton, Gabriel M. Ehrlich, Donald R. Grimes, Kyle W. Henson, Daniil Manaenkov, and Michael R. McWilliams, University of Michigan, Research Seminar in Quantitative Economics, The Economic and Demographic Outlook for Michigan Through 2050, July 29, 2022 (projections)
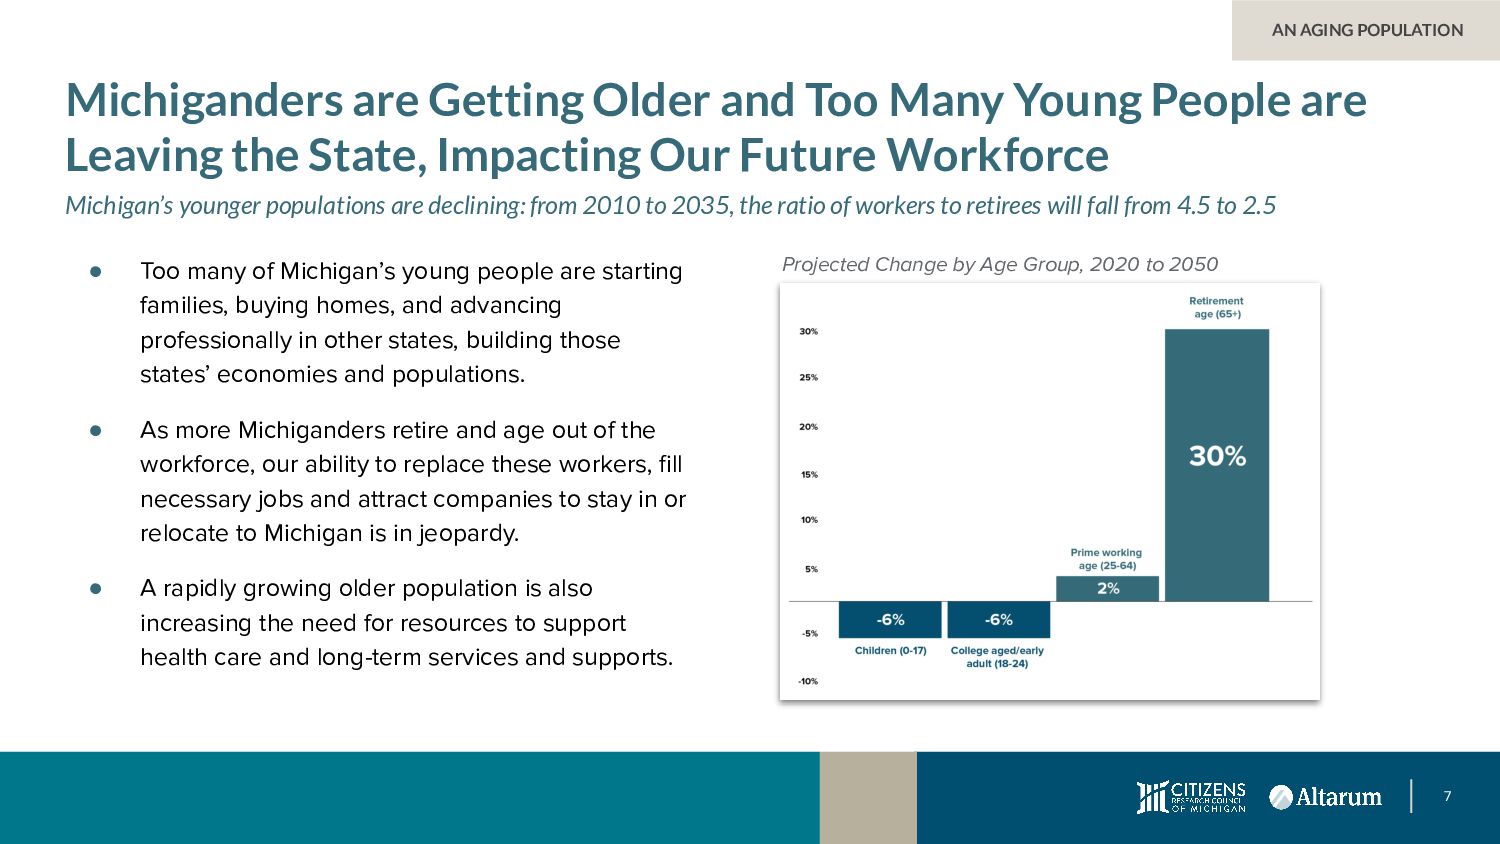
are Leaving the State, Impacting Our Future Workforce Michigan’s younger populations are declining: from 2010 to 2035, the ratio of workers to retirees will fall from 4.5 to 2.5 • Too many of Michigan’s young people are starting families, buying homes, and advancing professionally in other states, building those states’ economies and populations. • As more Michiganders retire and age out of the workforce, our ability to replace these workers, fill necessary jobs and attract companies to stay in or relocate to Michigan is in jeopardy. • A rapidly growing older population is also increasing the need for resources to support health care and long-term services and supports. AN AGING POPULATION Projected Change by Age Group, 2020 to 2050
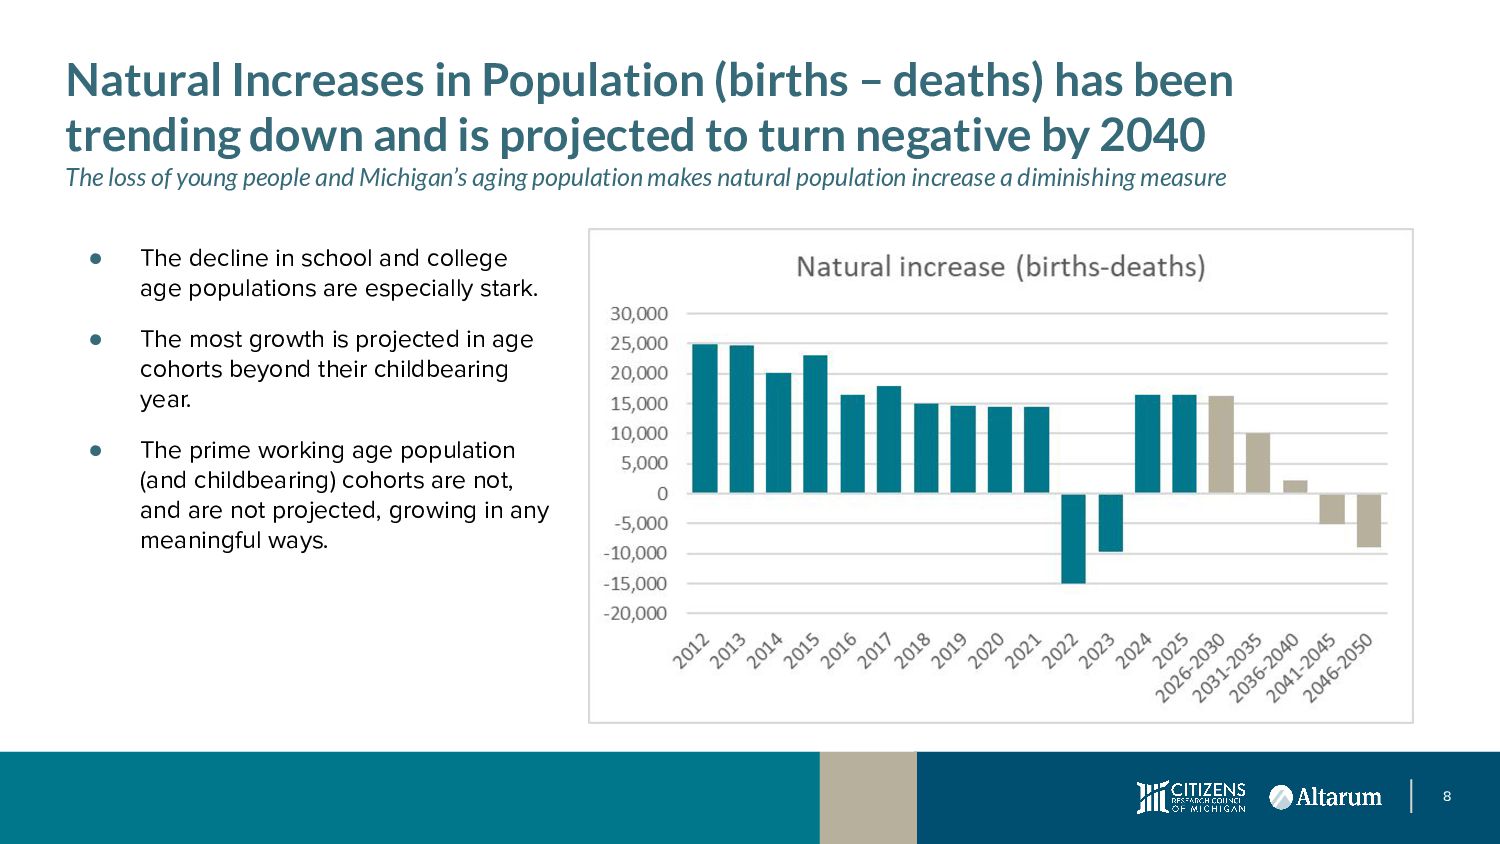
trending down and is projected to turn negative by 2040 The loss of young people and Michigan’s aging population makes natural population increase a diminishing measure • The decline in school and college age populations are especially stark. • The most growth is projected in age cohorts beyond their childbearing year. • The prime working age population (and childbearing) cohorts are not, and are not projected, growing in any meaningful ways.
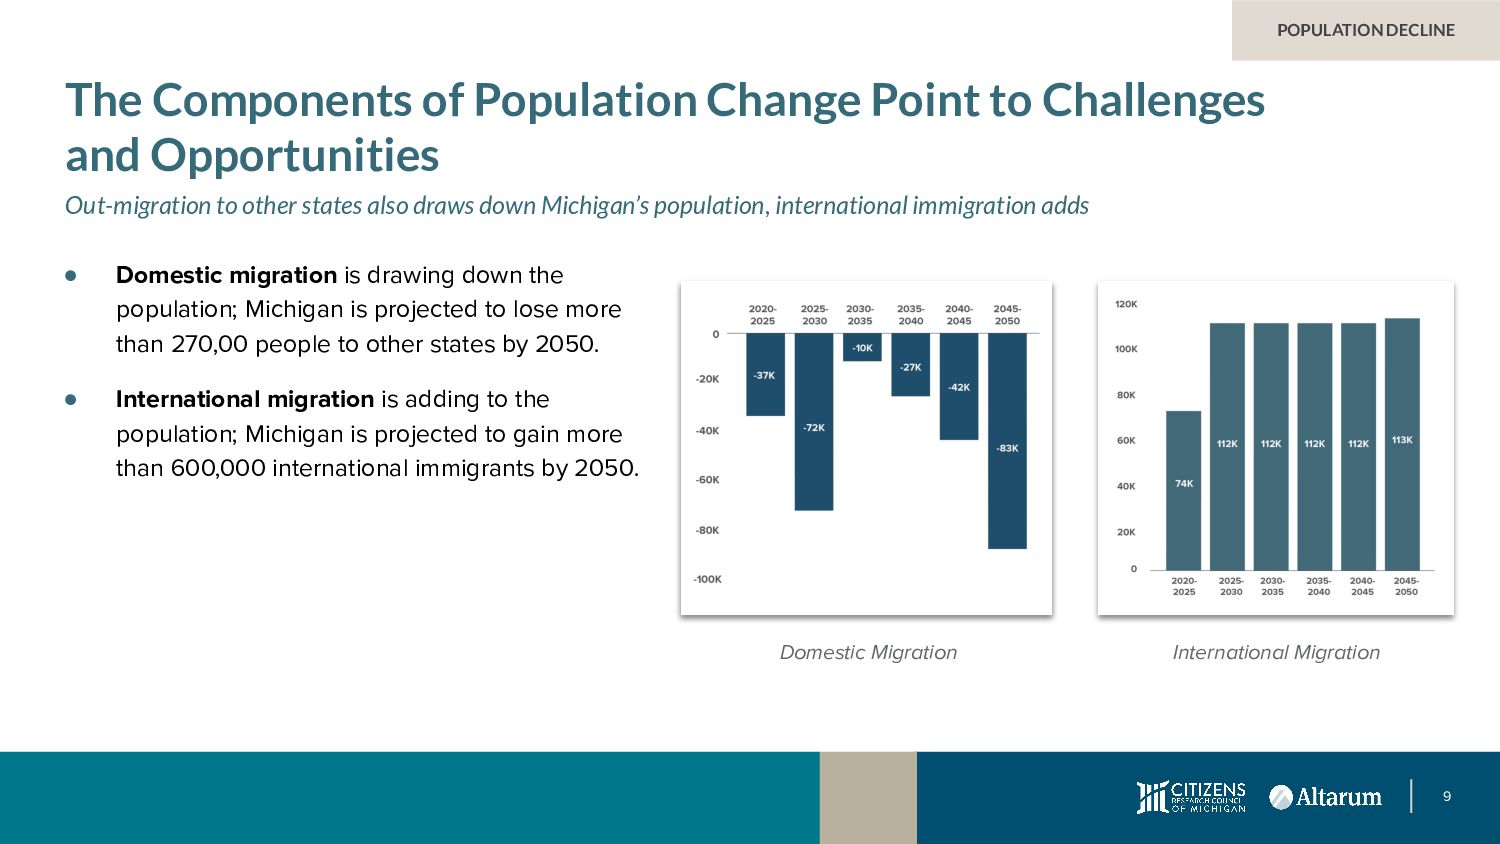
Challenges and Opportunities Out-migration to other states also draws down Michigan’s population, international immigration adds • Domestic migration is drawing down the population; Michigan is projected to lose more than 270,00 people to other states by 2050. • International migration is adding to the population; Michigan is projected to gain more than 600,000 international immigrants by 2050. POPULATION DECLINE International Migration
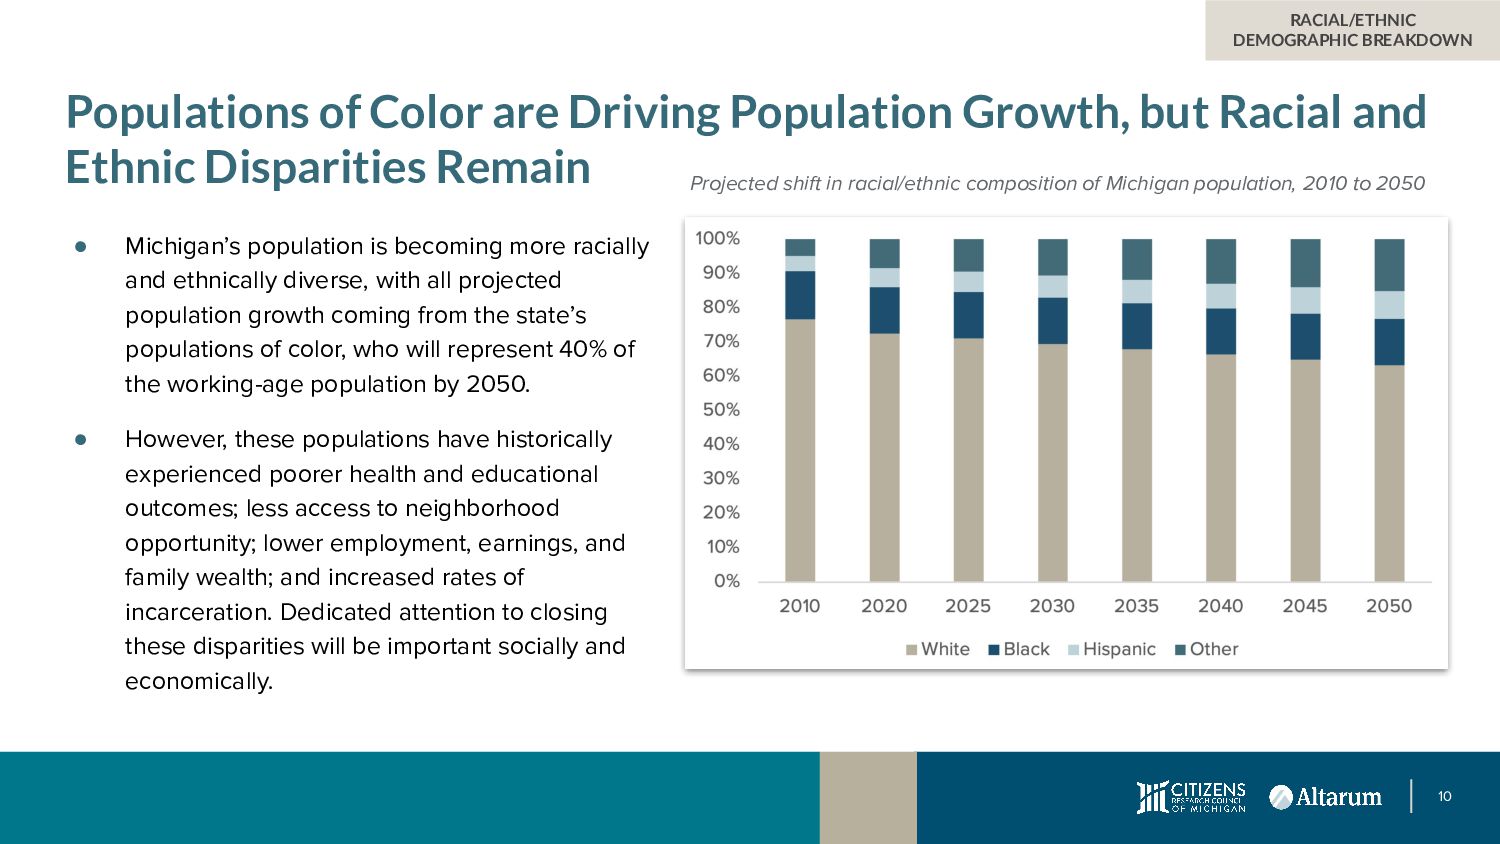
and Ethnic Disparities Remain • Michigan’s population is becoming more racially and ethnically diverse, with all projected population growth coming from the state’s populations of color, who will represent 40% of the working-age population by 2050. • However, these populations have historically experienced poorer health and educational outcomes; less access to neighborhood opportunity; lower employment, earnings, and family wealth; and increased rates of incarceration. Dedicated attention to closing these disparities will be important socially and economically. RACIAL/ETHNIC DEMOGRAPHIC BREAKDOWN Projected shift in racial/ethnic composition of Michigan population, 2010 to 2050
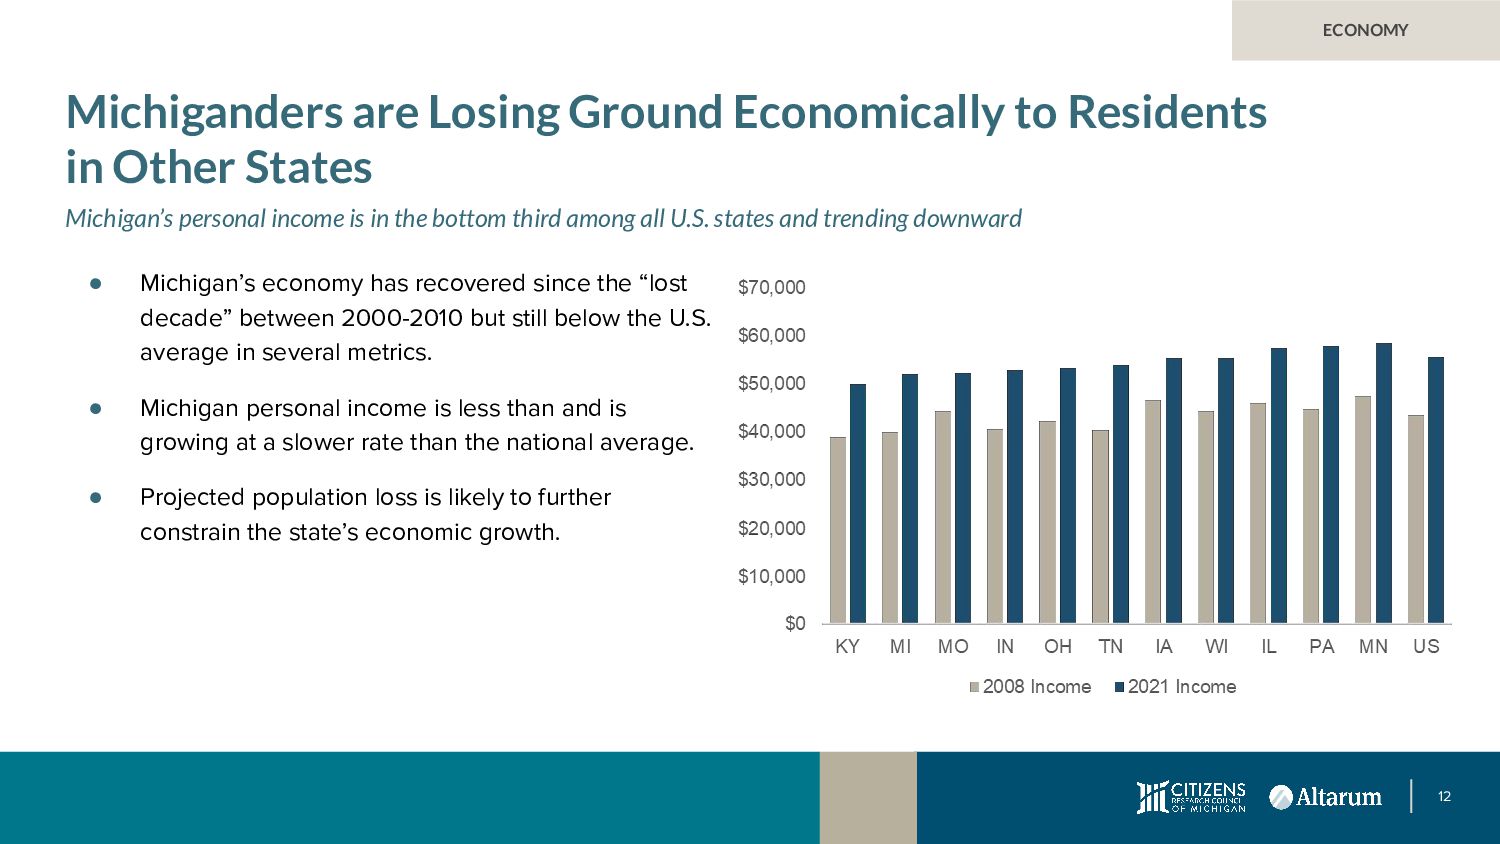
States Michigan’s personal income is in the bottom third among all U.S. states and trending downward • Michigan’s economy has recovered since the “lost decade” between 2000-2010 but still below the U.S. average in several metrics. • Michigan personal income is less than and is growing at a slower rate than the national average. • Projected population loss is likely to further constrain the state’s economic growth. ECONOMY
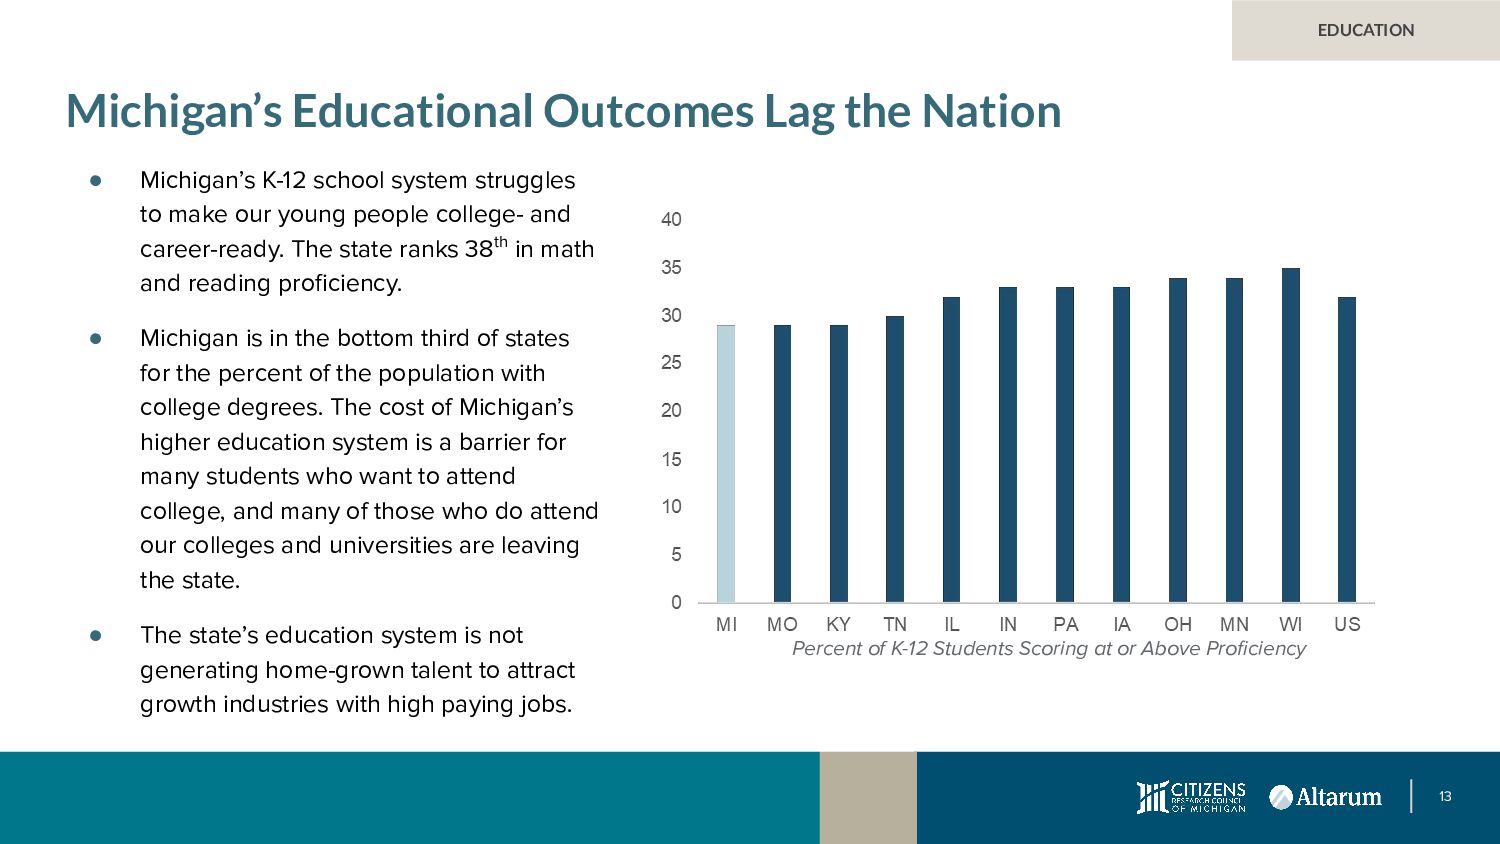
school system struggles to make our young people college- and career-ready. The state ranks 38th in math and reading proficiency. • Michigan is in the bottom third of states for the percent of the population with college degrees. The cost of Michigan’s higher education system is a barrier for many students who want to attend college, and many of those who do attend our colleges and universities are leaving the state. • The state’s education system is not generating home-grown talent to attract growth industries with high paying jobs. EDUCATION Percent of K-12 Students Scoring at or Above Proficiency
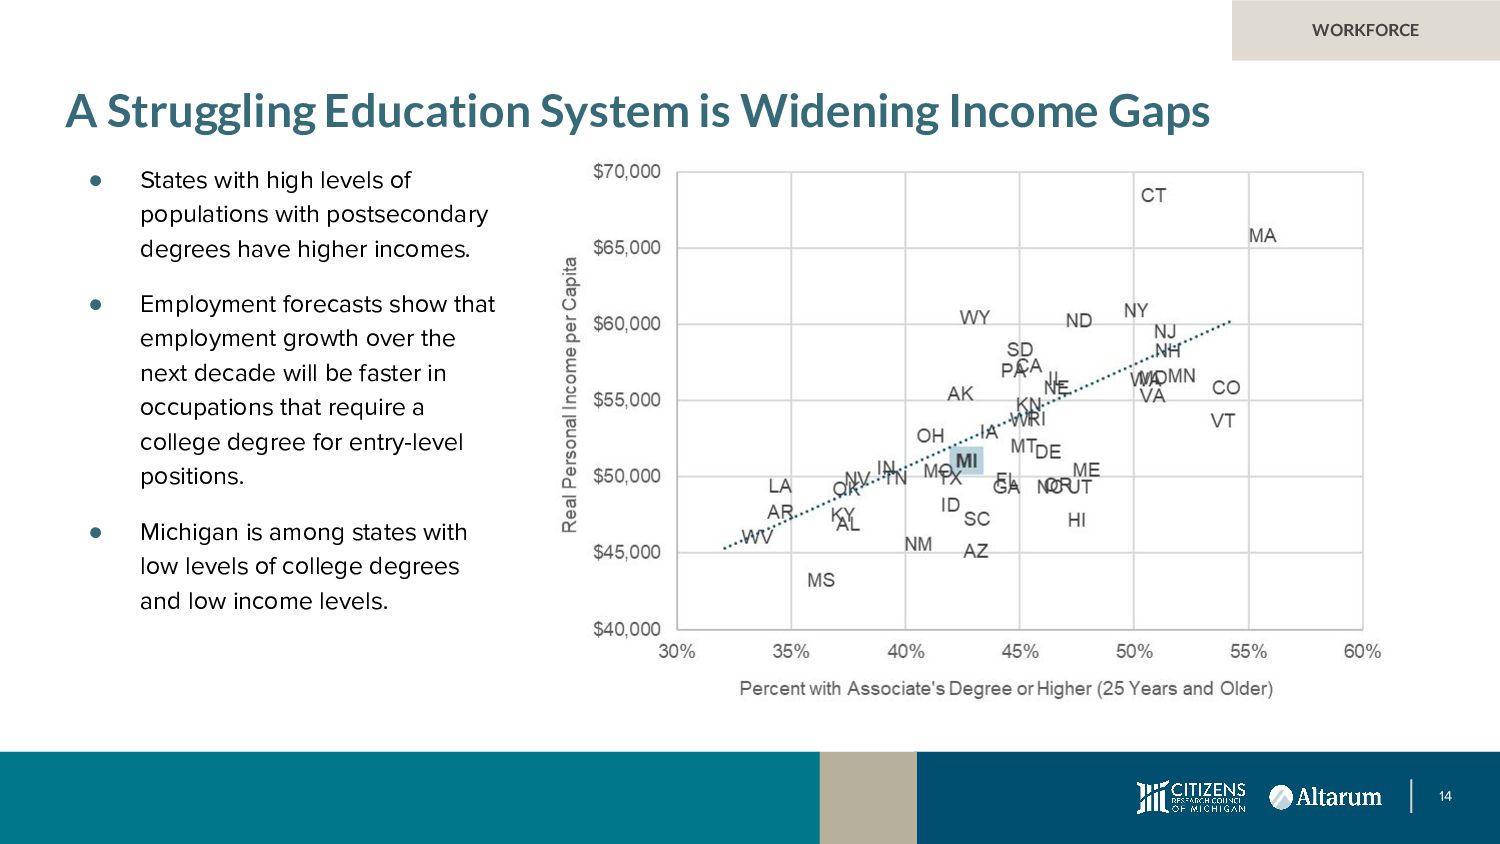
States with high levels of populations with postsecondary degrees have higher incomes. • Employment forecasts show that employment growth over the next decade will be faster in occupations that require a college degree for entry-level positions. • Michigan is among states with low levels of college degrees and low income levels. WORKFORCE Percent of State Populations with Associates Degrees or Higher
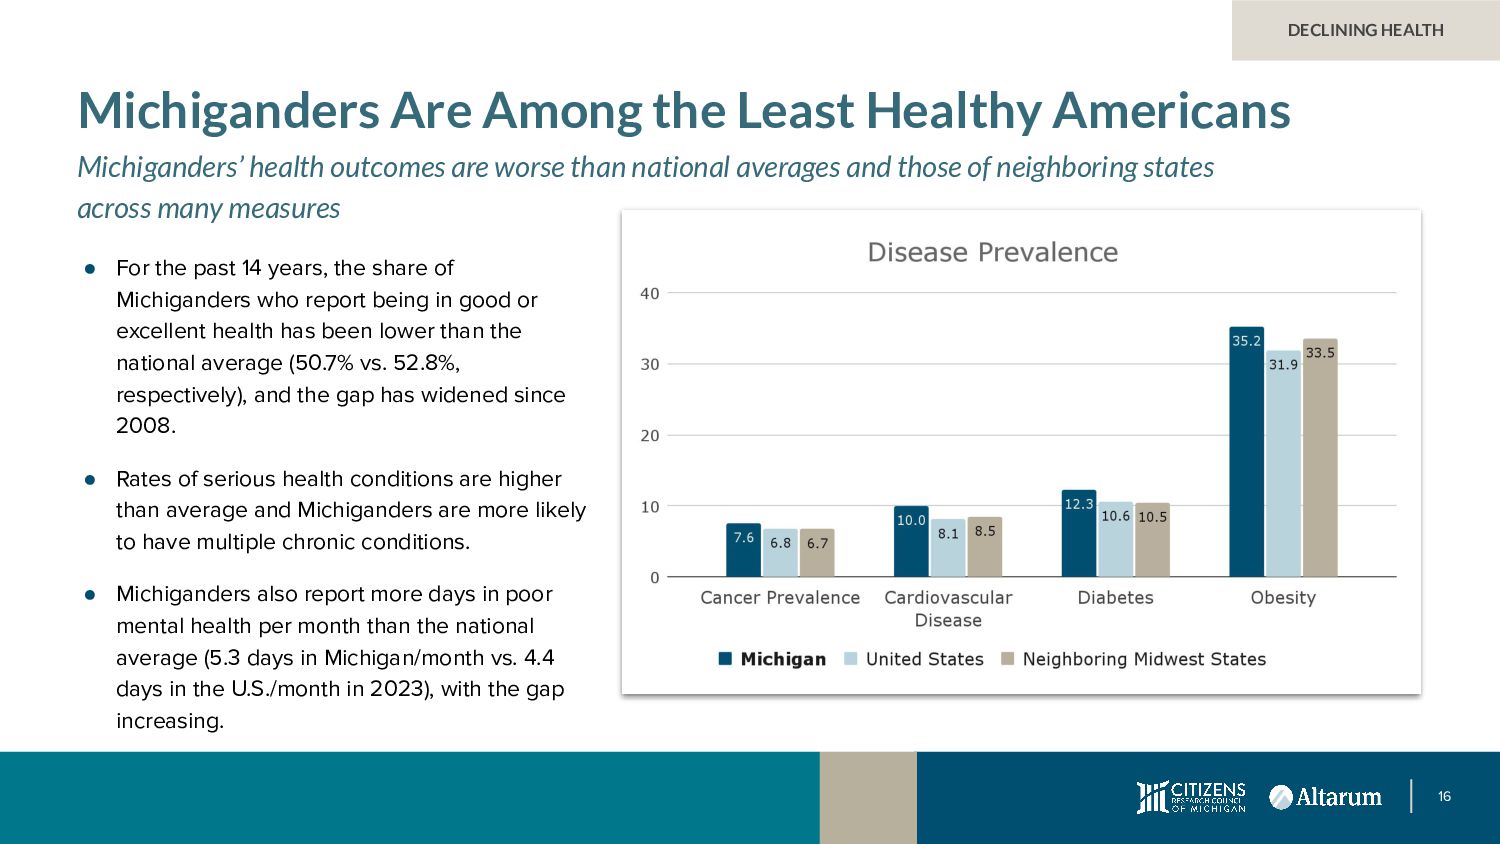
outcomes are worse than national averages and those of neighboring states across many measures • For the past 14 years, the share of Michiganders who report being in good or excellent health has been lower than the national average (50.7% vs. 52.8%, respectively), and the gap has widened since 2008. • Rates of serious health conditions are higher than average and Michiganders are more likely to have multiple chronic conditions. • Michiganders also report more days in poor mental health per month than the national average (5.3 days in Michigan/month vs. 4.4 days in the U.S./month in 2023), with the gap increasing. DECLINING HEALTH
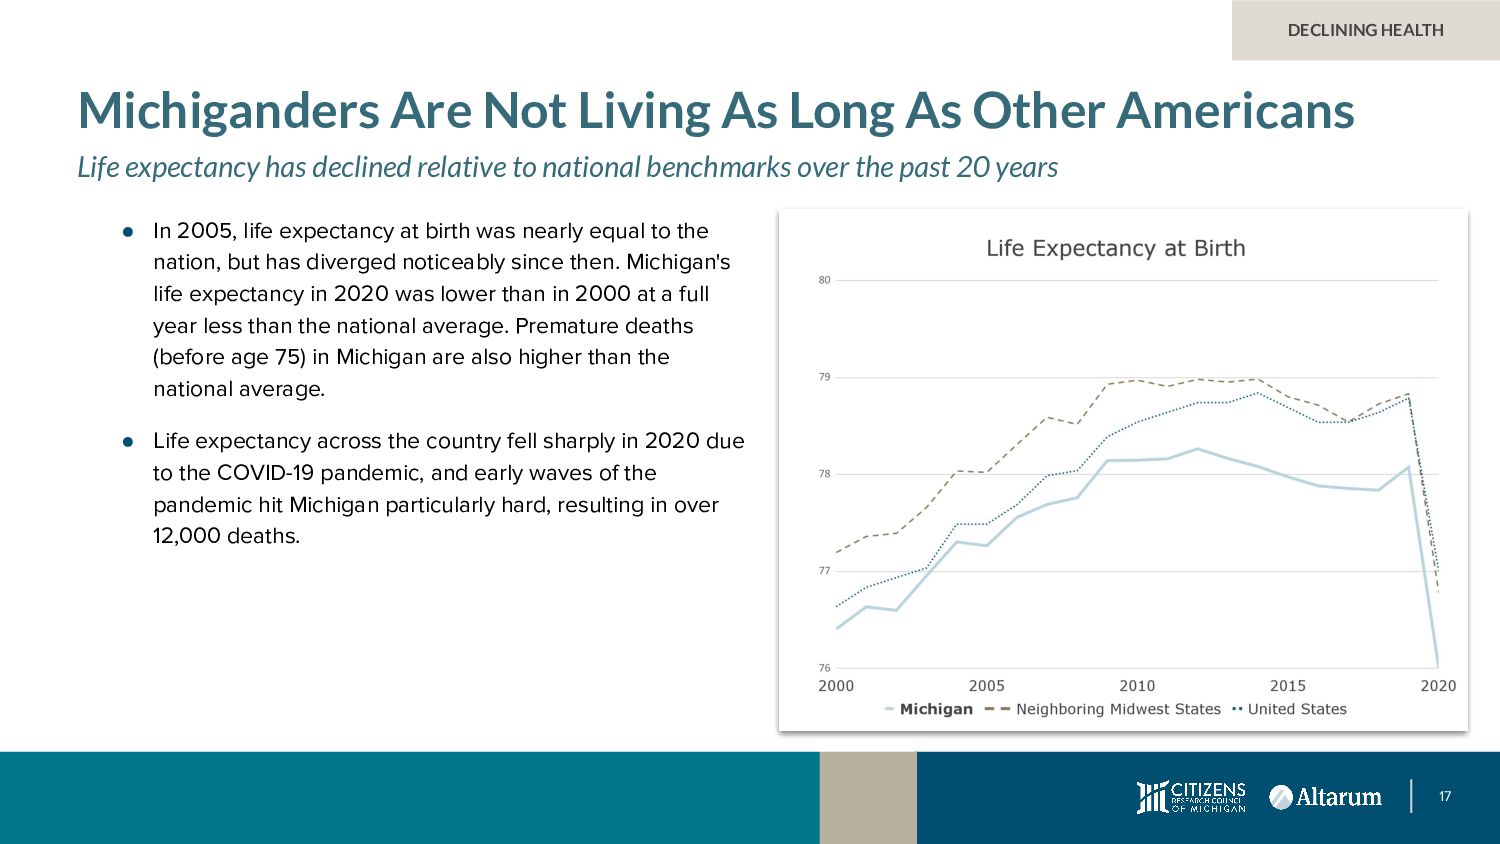
Life expectancy has declined relative to national benchmarks over the past 20 years • In 2005, life expectancy at birth was nearly equal to the nation, but has diverged noticeably since then. Michigan's life expectancy in 2020 was lower than in 2000 at a full year less than the national average. Premature deaths (before age 75) in Michigan are also higher than the national average. • Life expectancy across the country fell sharply in 2020 due to the COVID-19 pandemic, and early waves of the pandemic hit Michigan particularly hard, resulting in over 12,000 deaths. DECLINING HEALTH
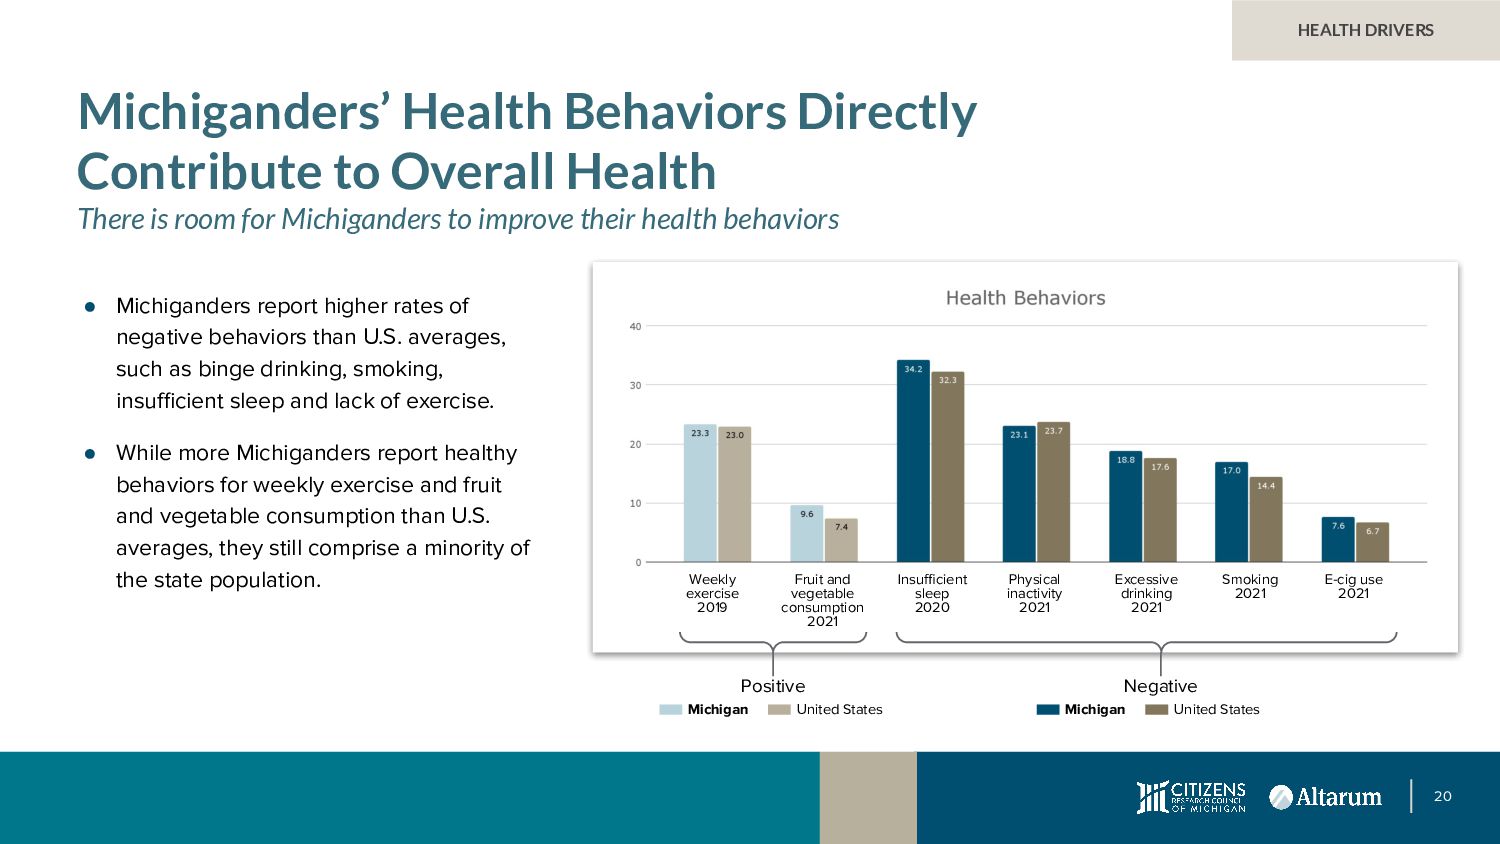
Health There is room for Michiganders to improve their health behaviors • Michiganders report higher rates of negative behaviors than U.S. averages, such as binge drinking, smoking, insufficient sleep and lack of exercise. • While more Michiganders report healthy behaviors for weekly exercise and fruit and vegetable consumption than U.S. averages, they still comprise a minority of the state population. Positive Negative Michigan United States Michigan United States Weekly exercise 2019 Fruit and vegetable consumption 2021 Insufficient sleep 2020 Physical inactivity 2021 Excessive drinking 2021 Smoking 2021 E-cig use 2021
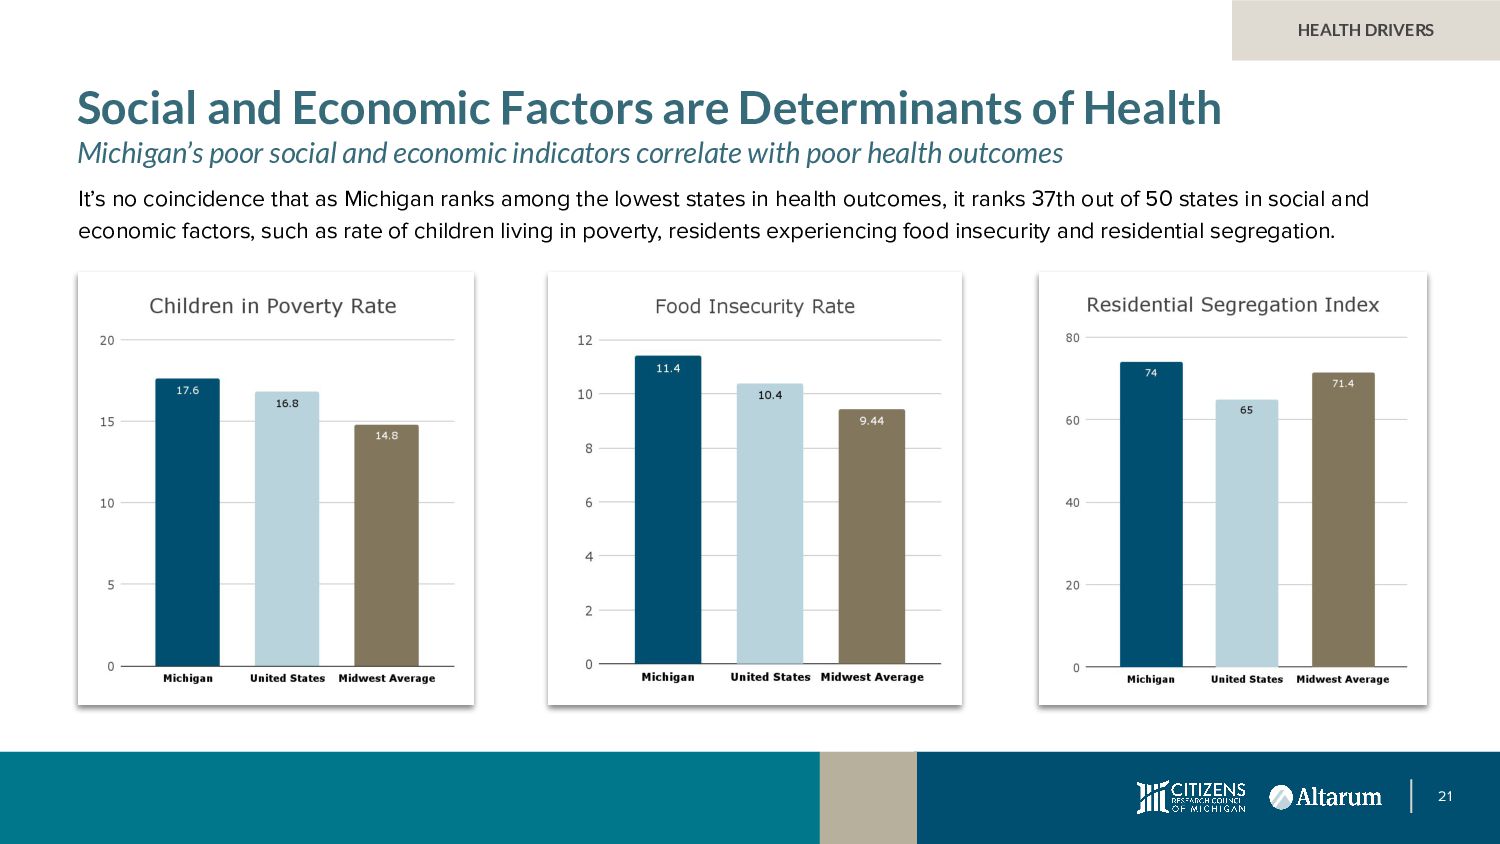
Health Michigan’s poor social and economic indicators correlate with poor health outcomes It’s no coincidence that as Michigan ranks among the lowest states in health outcomes, it ranks 37th out of 50 states in social and economic factors, such as rate of children living in poverty, residents experiencing food insecurity and residential segregation.
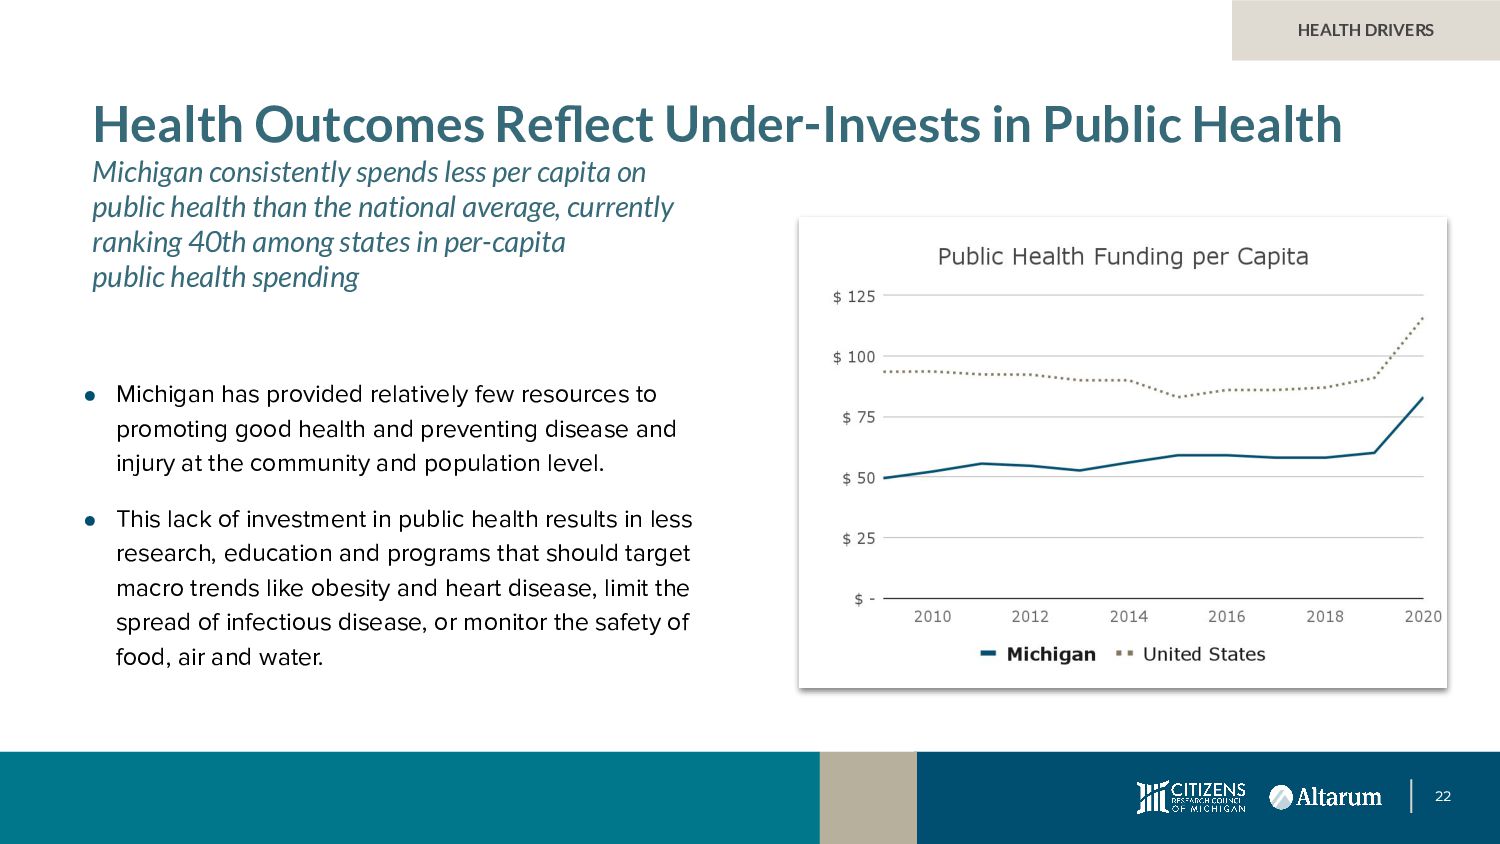
Michigan consistently spends less per capita on public health than the national average, currently ranking 40th among states in per-capita public health spending • Michigan has provided relatively few resources to promoting good health and preventing disease and injury at the community and population level. • This lack of investment in public health results in less research, education and programs that should target macro trends like obesity and heart disease, limit the spread of infectious disease, or monitor the safety of food, air and water.
state trunkline system ranks below peer states and many locally-maintained roads are even worse off • Estimates suggest that Michigan’s transportation system will face a needs gap of $4 billion annually through 2045.* • While proposals for new and increased vehicle and fuel fees would bring in revenue to help close this gap and support improved road conditions, there are multiple opportunities for Michigan to make better use of existing revenue. • Michigan could implement reforms including reducing allowable truck weights, adapting new technologies and methods to improve asset management and for investment decision support, and amending the state’s transportation funding distribution formula to better match needs. INFRASTRUCTURE: TRANSPORTATION Michigan’s percentage of National Highway System (NHS) miles in poor condition are among the nation’s highest * Estimates subject to available data and methodological assumptions.
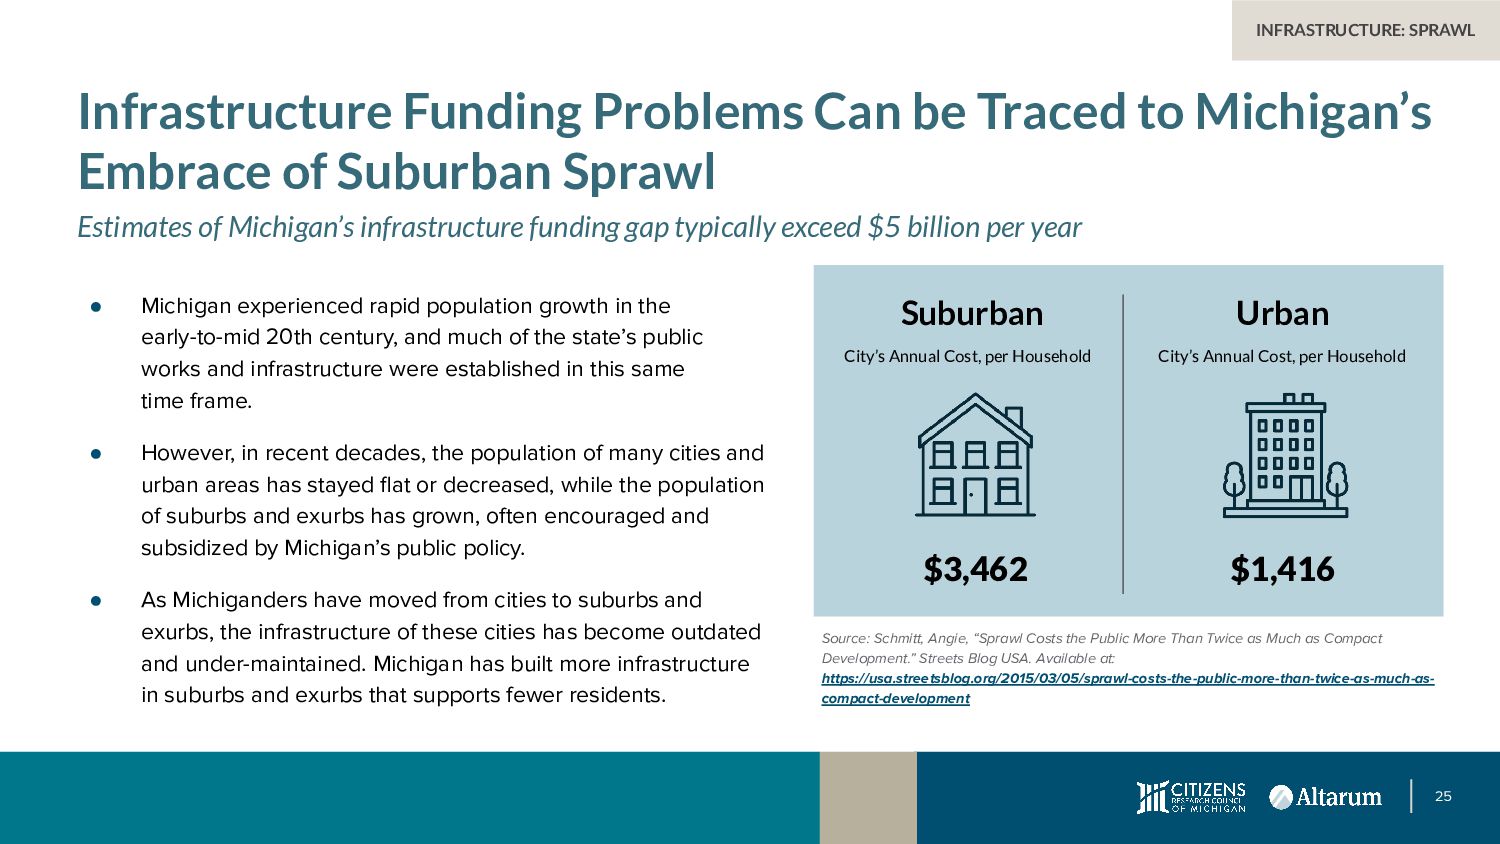
Michigan’s Embrace of Suburban Sprawl Estimates of Michigan’s infrastructure funding gap typically exceed $5 billion per year • Michigan experienced rapid population growth in the early-to-mid 20th century, and much of the state’s public works and infrastructure were established in this same time frame. • However, in recent decades, the population of many cities and urban areas has stayed flat or decreased, while the population of suburbs and exurbs has grown, often encouraged and subsidized by Michigan’s public policy. • As Michiganders have moved from cities to suburbs and exurbs, the infrastructure of these cities has become outdated and under-maintained. Michigan has built more infrastructure in suburbs and exurbs that supports fewer residents. Suburban Urban City’s Annual Cost, per Household City’s Annual Cost, per Household $3,462 $1,416 Source: Schmitt, Angie, “Sprawl Costs the Public More Than Twice as Much as Compact Development.” Streets Blog USA. Available at: https://usa.streetsblog.org/2015/03/05/sprawl-costs-the-public-more-than-twice-as-much-as- compact-development
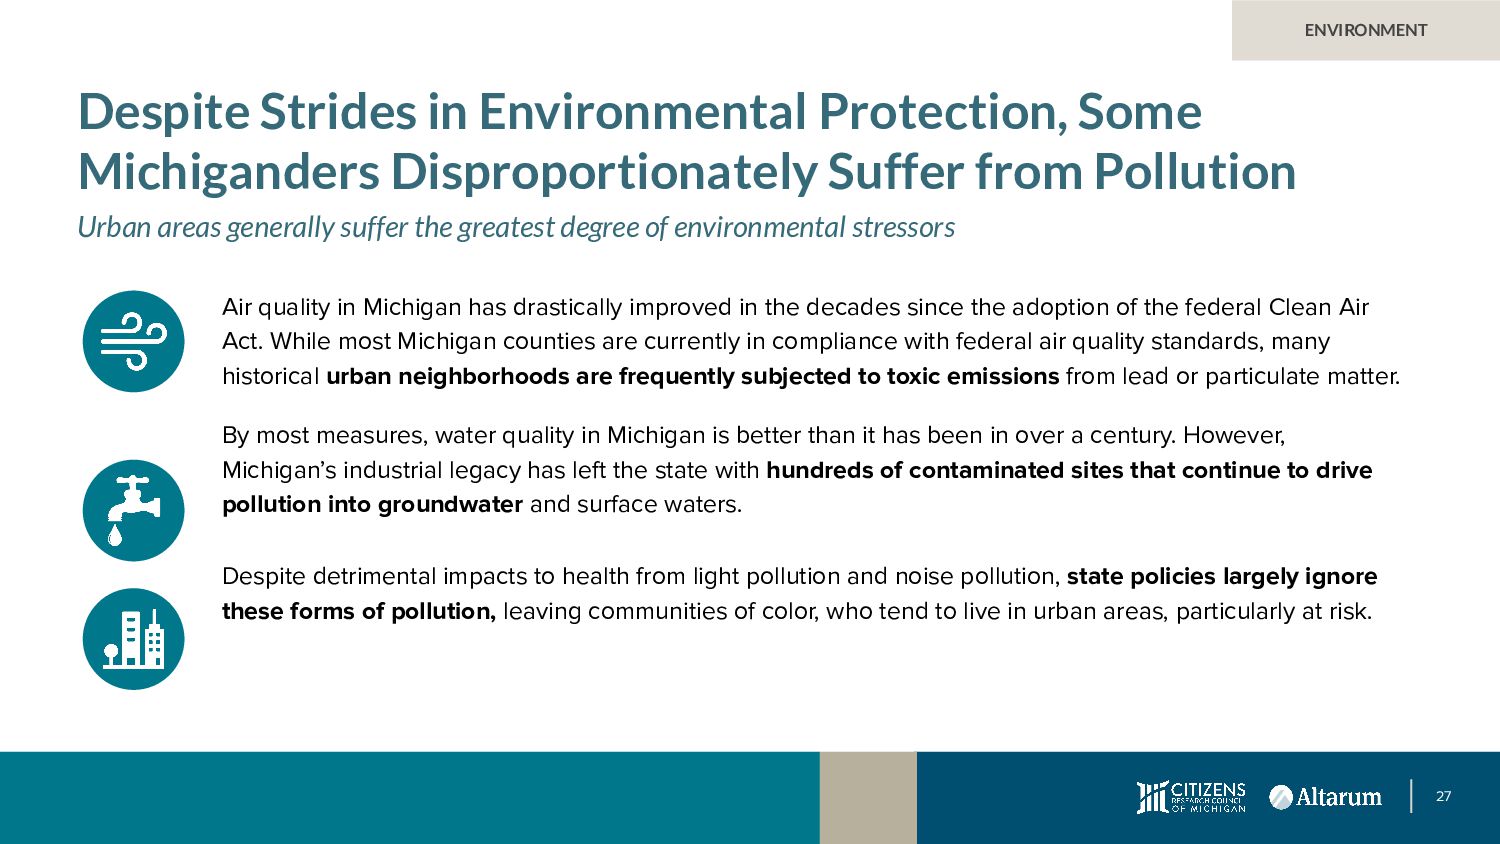
Suffer from Pollution Urban areas generally suffer the greatest degree of environmental stressors Air quality in Michigan has drastically improved in the decades since the adoption of the federal Clean Air Act. While most Michigan counties are currently in compliance with federal air quality standards, many historical urban neighborhoods are frequently subjected to toxic emissions from lead or particulate matter. By most measures, water quality in Michigan is better than it has been in over a century. However, Michigan’s industrial legacy has left the state with hundreds of contaminated sites that continue to drive pollution into groundwater and surface waters. Despite detrimental impacts to health from light pollution and noise pollution, state policies largely ignore these forms of pollution, leaving communities of color, who tend to live in urban areas, particularly at risk.
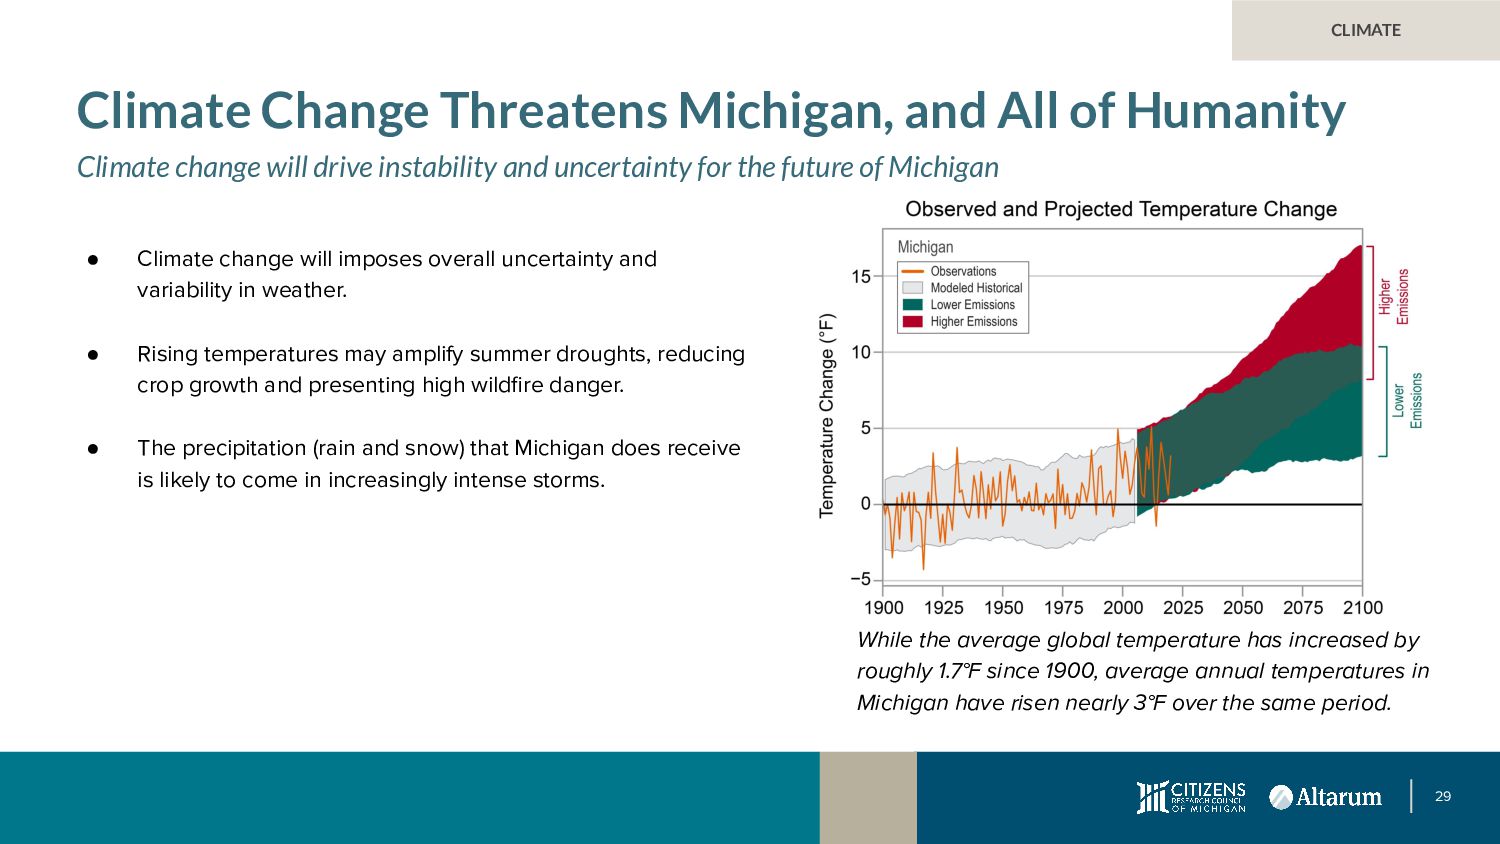
change will drive instability and uncertainty for the future of Michigan • Climate change will imposes overall uncertainty and variability in weather. • Rising temperatures may amplify summer droughts, reducing crop growth and presenting high wildfire danger. • The precipitation (rain and snow) that Michigan does receive is likely to come in increasingly intense storms. CLIMATE While the average global temperature has increased by roughly 1.7°F since 1900, average annual temperatures in Michigan have risen nearly 3°F over the same period.
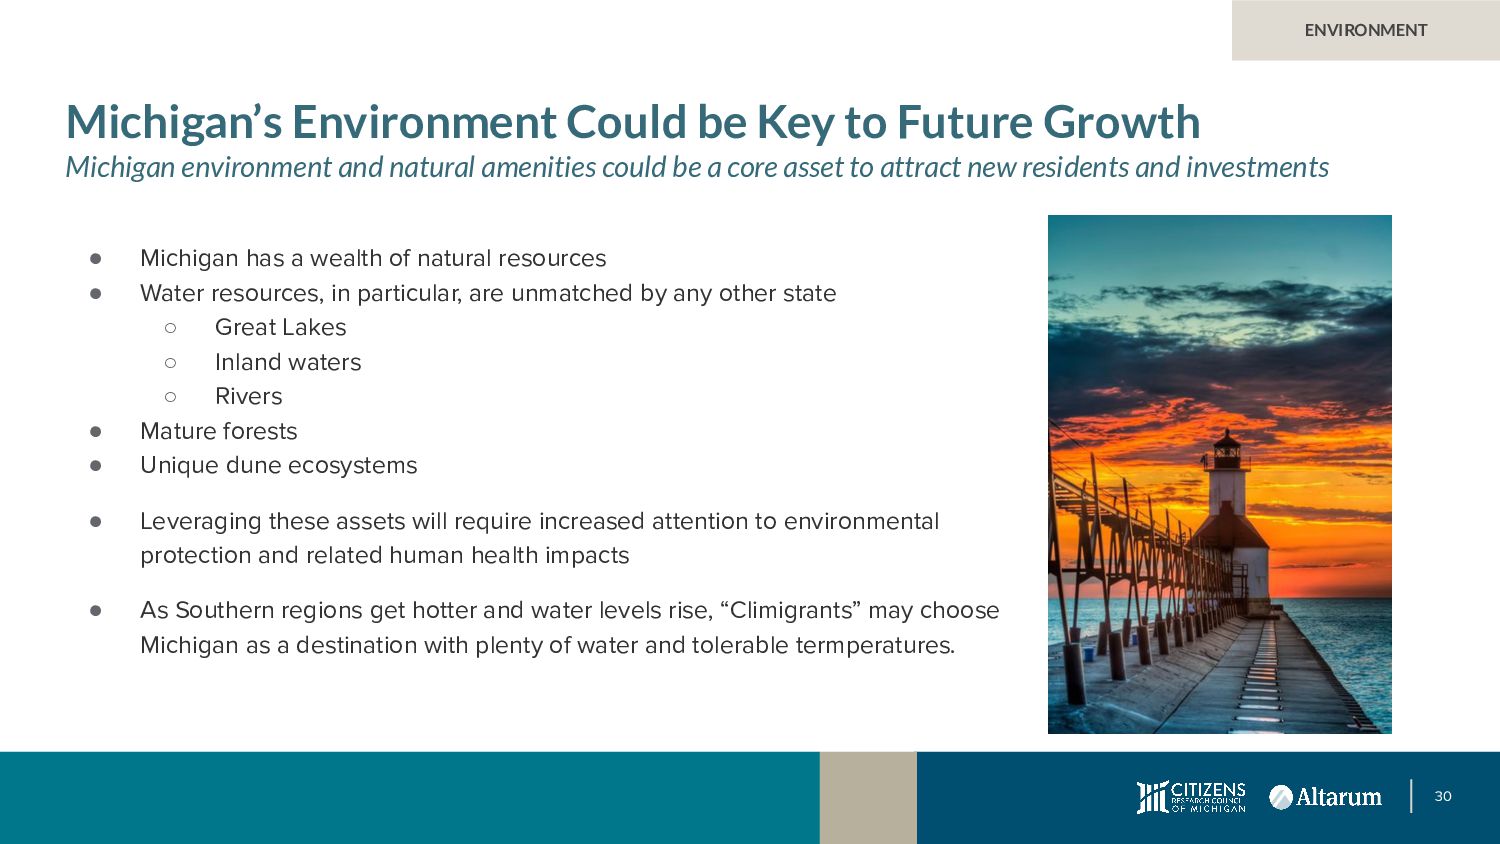
environment and natural amenities could be a core asset to attract new residents and investments • Michigan has a wealth of natural resources • Water resources, in particular, are unmatched by any other state ◦ Great Lakes ◦ Inland waters ◦ Rivers • Mature forests • Unique dune ecosystems • Leveraging these assets will require increased attention to environmental protection and related human health impacts • As Southern regions get hotter and water levels rise, “Climigrants” may choose Michigan as a destination with plenty of water and tolerable termperatures. ENVIRONMENT
adaptation will promote Michiganders’ wellbeing and a sustainable state economy Michigan’s current climate policy emphasizes climate mitigation – reducing carbon emissions. These efforts will not measurably impact the climate change that the state experiences. Climate adaptation must be built into state policies across the board. ◦ Infrastructure planning should include solutions such as routing power lines underground, ensuring stormwater systems can accommodate severe storms, and routinely inspecting and maintaining critical flood control facilities. ◦ Protecting Michigan’s natural resources may include policies and programs that understand, track, and respond to harmful and invasive species and diseases, implementing land-use and forestry practices to reduce the likelihood of destructive wildfires, remediating sites with soil contamination, and managing shoreline areas. Importantly, all policies must ensure that addressing one negative impact does not result in other negative impacts (maladaptation).
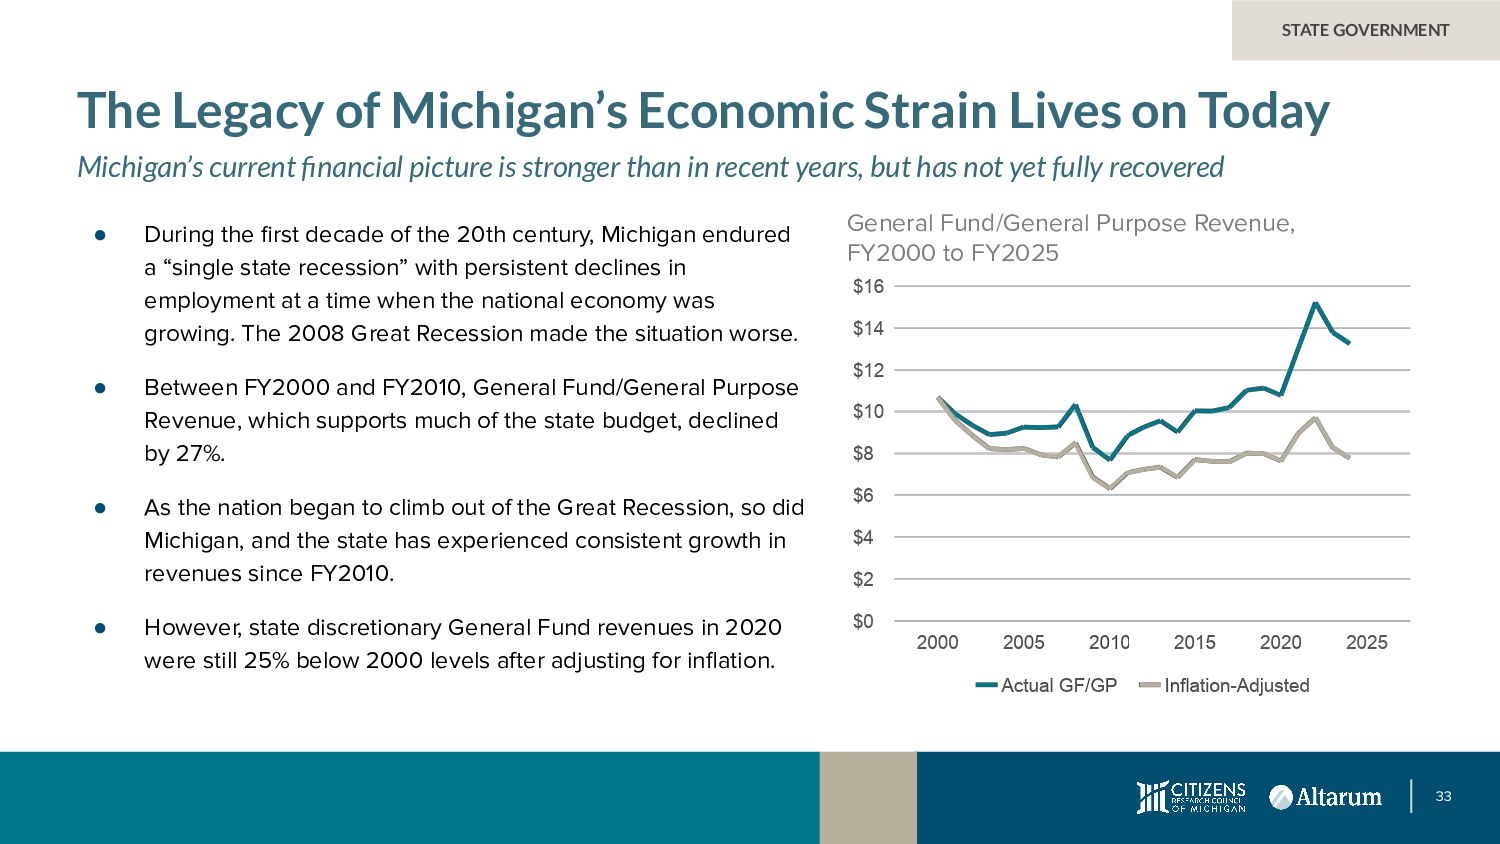
Michigan endured a “single state recession” with persistent declines in employment at a time when the national economy was growing. The 2008 Great Recession made the situation worse. • Between FY2000 and FY2010, General Fund/General Purpose Revenue, which supports much of the state budget, declined by 27%. • As the nation began to climb out of the Great Recession, so did Michigan, and the state has experienced consistent growth in revenues since FY2010. • However, state discretionary General Fund revenues in 2020 were still 25% below 2000 levels after adjusting for inflation. STATE GOVERNMENT The Legacy of Michigan’s Economic Strain Lives on Today Michigan’s current financial picture is stronger than in recent years, but has not yet fully recovered General Fund/General Purpose Revenue, FY2000 to FY2025
Taxing Increasingly Smaller Shares of Income Slow revenue growth has brought state revenue $12 billion below the state’s constitutional revenue limit. Source: House Fiscal Agency, FY 2023-24 Appropriations Summary and Analysis, September 2023 • 1978 Headlee Amendment included provision that state government should not tax more of residents’ personal income than it did in 1978 – 9.49% • Through 1980s, 90s, 00s, state not far below the revenue limit • Since Great Recession, the delta has been widening • Michigan’s per capita personal income has been growing slower than the national average
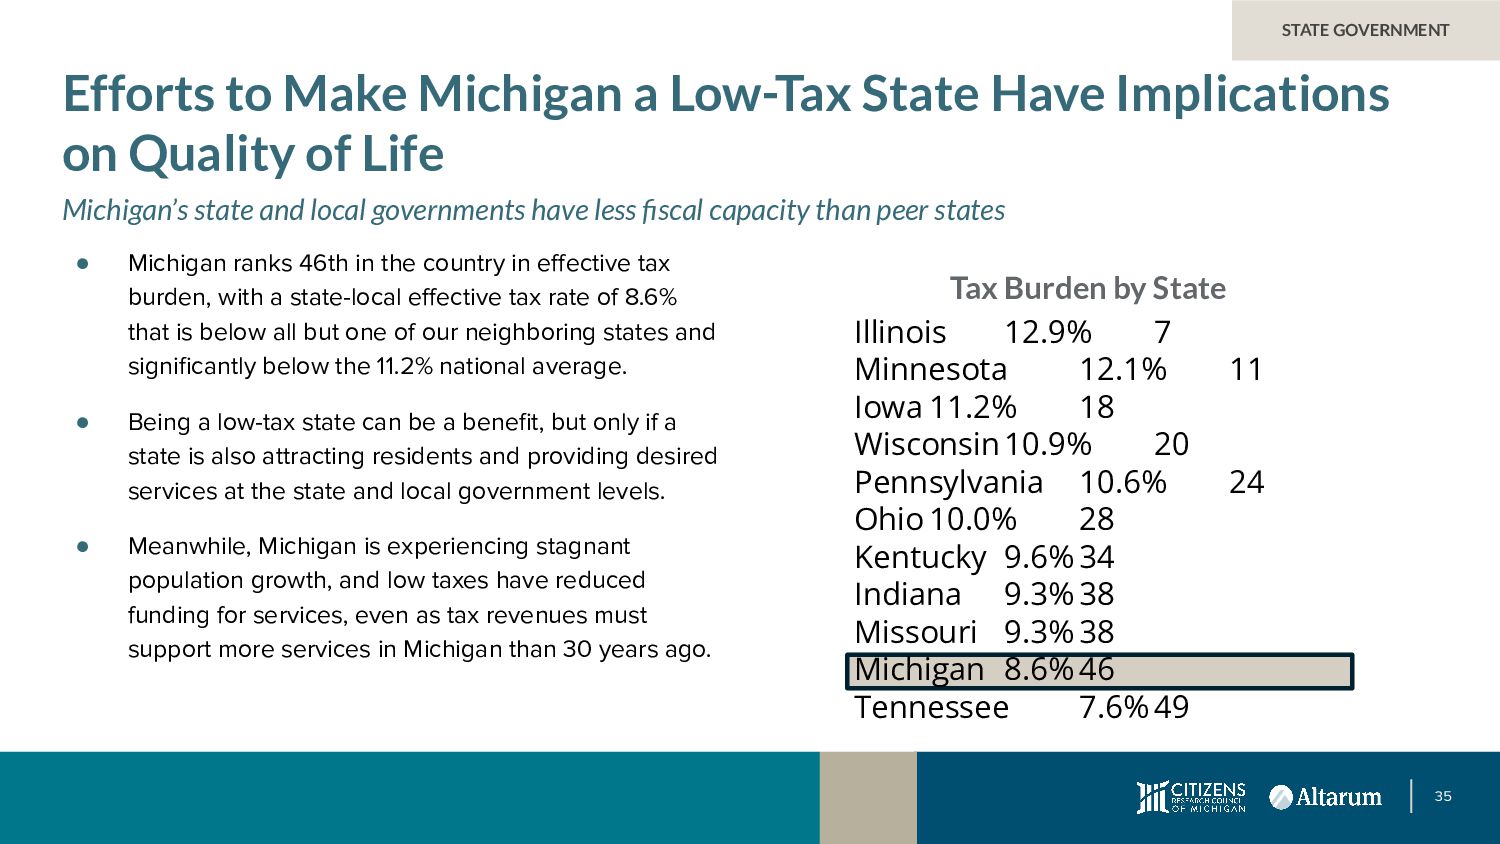
Have Implications on Quality of Life Michigan’s state and local governments have less fiscal capacity than peer states • Michigan ranks 46th in the country in effective tax burden, with a state-local effective tax rate of 8.6% that is below all but one of our neighboring states and significantly below the 11.2% national average. • Being a low-tax state can be a benefit, but only if a state is also attracting residents and providing desired services at the state and local government levels. • Meanwhile, Michigan is experiencing stagnant population growth, and low taxes have reduced funding for services, even as tax revenues must support more services in Michigan than 30 years ago. Tax Burden by State Illinois 12.9% 7 Minnesota 12.1% 11 Iowa 11.2% 18 Wisconsin10.9% 20 Pennsylvania 10.6% 24 Ohio 10.0% 28 Kentucky 9.6% 34 Indiana 9.3% 38 Missouri 9.3% 38 Michigan 8.6% 46 Tennessee 7.6% 49
only self-generated source of revenue. • Because Michigan’s local government’s overlap, the property tax burden in some cities are among the highest in the nation. • Revenue sharing was designed to compensate local governments for revenue lost due to state policy changes that preempted certain local taxes. Over time, it became a revenue stream to supplement property tax revenue and tie local revenue to the strength of the economy. • Drastic cuts to state revenue sharing over the past two decades have balanced the state budget on the backs of these local entities, which do not have the own-source resources to provide quality of life services that will retain residents and attract new ones. Today, revenue sharing, adjusted for inflation, remains 35 percent below its FY2001 peak. LOCAL GOVERNMENT Michigan’s Local Government Finance System Relies on an Inadequate, Burdensome Revenue Source Local governments are more constrained in their tax options than those in many other states
develop, mainly exurbs and rural areas within a commuting distance of a central city, can grow their tax base, while communities like urban and suburban areas have no recourse to keep tax revenue growing alongside the economy. • This system disincentivizes revitalization and investment in existing communities, incentivizes sprawl, and disproportionately impacts low-income communities that are built out and/or not attracting new residents. • This means that Michigan’s poorest people, living in its most struggling communities, pay taxes at much higher rates than their wealthier neighbors, while sometimes receiving fewer services for those taxes paid. LOCAL GOVERNMENT Local Governments’ Property Tax System Drives Inequity, Leaving Some Communities Behind Communities with low property values have few options other than to levy prohibitively high tax rates Tax Base Growth, 1994 to 2020 Allendale Township 552% Oakland Township 345% Grass Lake Township 282% . . . City of Jackson 66% City of Adrian 42% City of Farmington Hills 38% City of Pontiac 8%
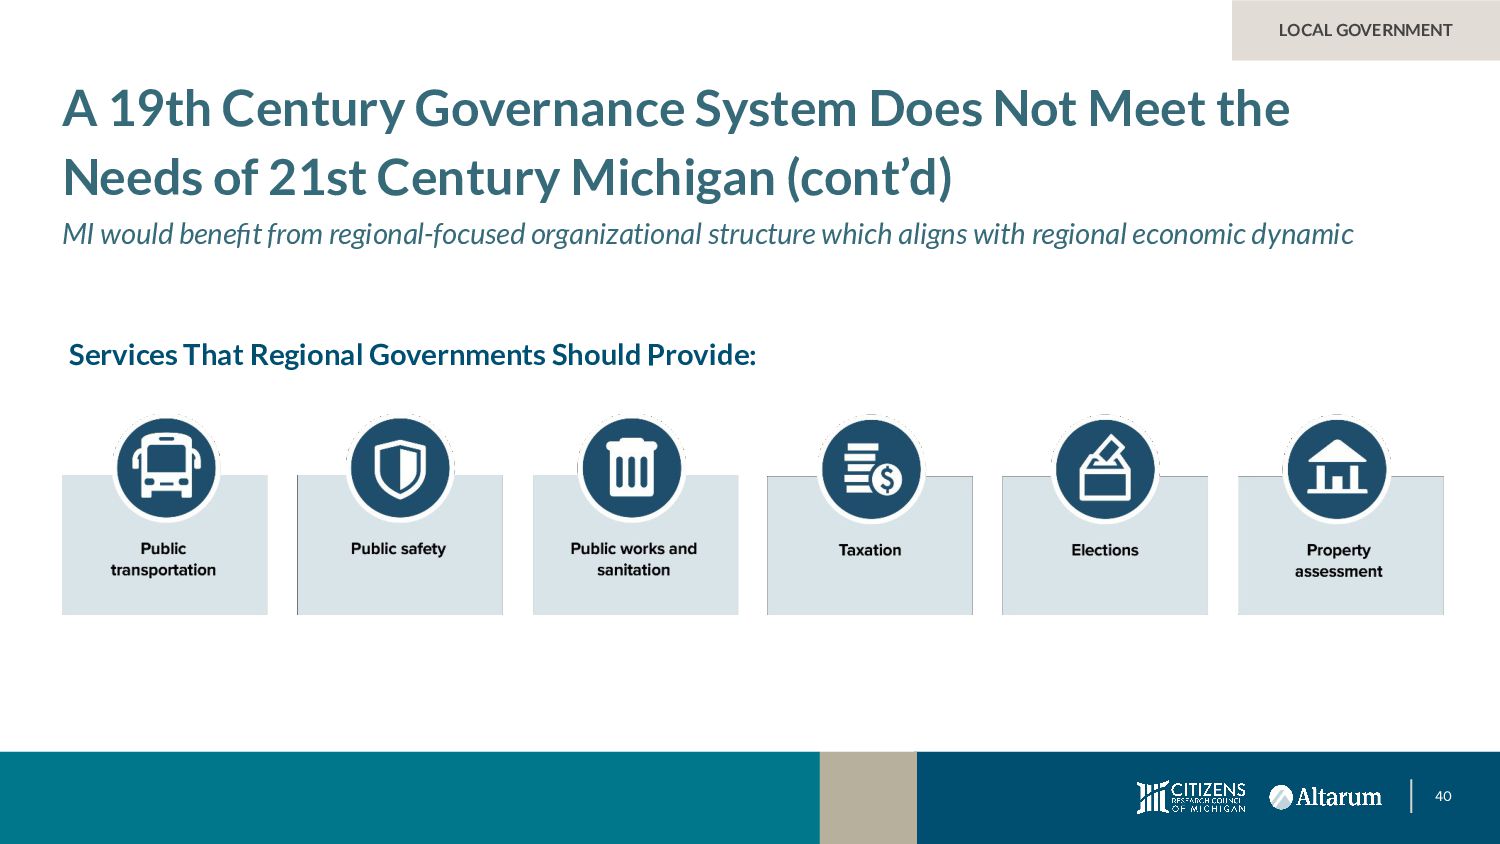
in the 1800s. General-purpose government is organized into 83 counties, 533 cities and villages, and 1,240 townships that provide a broad, and somewhat overlapping, range of services. • Michigan’s organization of county government results in a complex structure with authority heavily diffused and responsibility very difficult to pinpoint. • Advances in communication, technology, and transportation can enable a new model of regional governance that would be more efficient and effective than thousands of small local governments doing things alone. LOCAL GOVERNMENT A 19th Century Governance System Does Not Meet the Needs of 21st Century Michigan MI would benefit from regional-focused organizational structure which aligns with regional economic dynamic
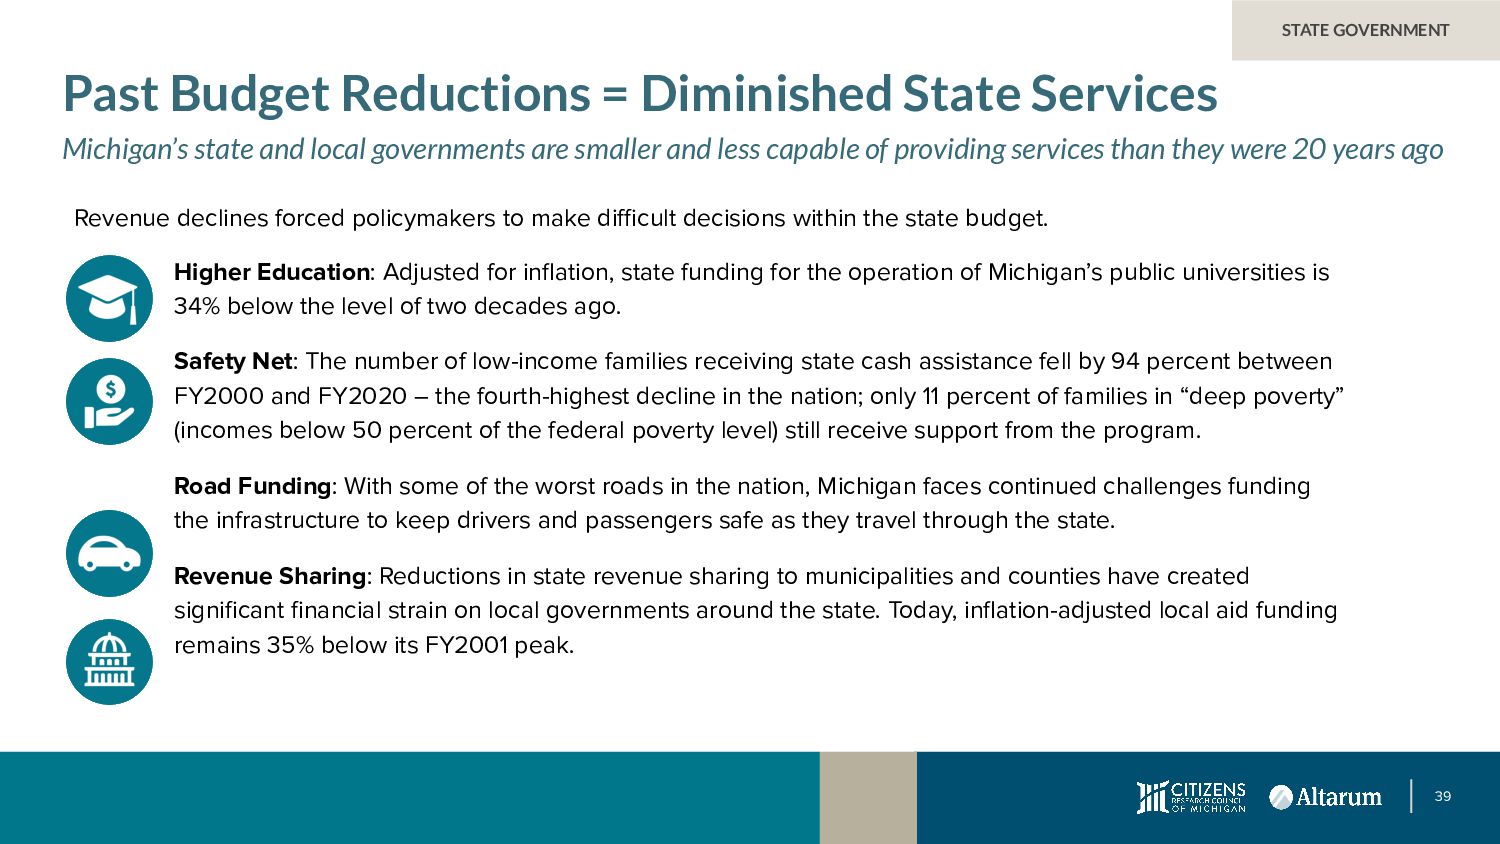
Michigan’s state and local governments are smaller and less capable of providing services than they were 20 years ago Higher Education: Adjusted for inflation, state funding for the operation of Michigan’s public universities is 34% below the level of two decades ago. Safety Net: The number of low-income families receiving state cash assistance fell by 94 percent between FY2000 and FY2020 – the fourth-highest decline in the nation; only 11 percent of families in “deep poverty” (incomes below 50 percent of the federal poverty level) still receive support from the program. Road Funding: With some of the worst roads in the nation, Michigan faces continued challenges funding the infrastructure to keep drivers and passengers safe as they travel through the state. Revenue Sharing: Reductions in state revenue sharing to municipalities and counties have created significant financial strain on local governments around the state. Today, inflation-adjusted local aid funding remains 35% below its FY2001 peak. Revenue declines forced policymakers to make difficult decisions within the state budget.
19th Century Governance System Does Not Meet the Needs of 21st Century Michigan (cont’d) MI would benefit from regional-focused organizational structure which aligns with regional economic dynamic
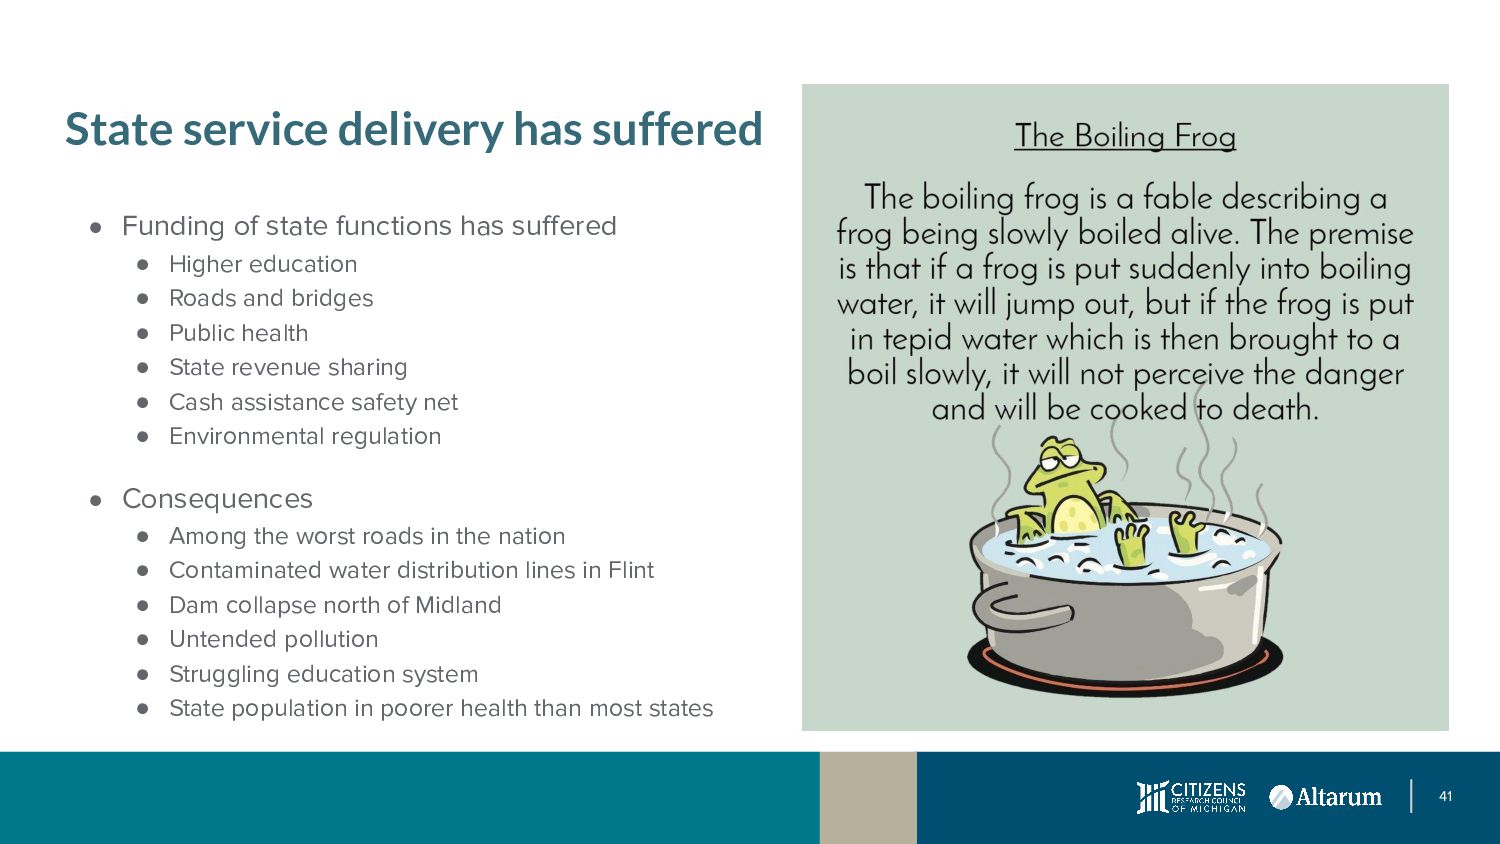
functions has suffered • Higher education • Roads and bridges • Public health • State revenue sharing • Cash assistance safety net • Environmental regulation • Consequences • Among the worst roads in the nation • Contaminated water distribution lines in Flint • Dam collapse north of Midland • Untended pollution • Struggling education system • State population in poorer health than most states
https://crcmich.org/publications/prosperous-future Eric Lupher | President Citizens Research Council of Michigan 38777 Six Mile Road, Suite 208 Livonia, MI 48152 O 734.542.8001 C 734.788.1732 [email protected]