Upgrade to Pro — share decks privately, control downloads, hide ads and more …

From Defects to Excellence: A Roadmap for Globa...

From Defects to Excellence: A Roadmap for Global Manufacturing Integration

To compete in global supply chains, manufacturers must move beyond inspection-based quality to a Zero Defect, system-driven approach. Standardization, error-proofing, and strong maintenance systems help eliminate inconsistencies, reduce costs, and build the reliability global buyers demand.

Avatar for dvbcindia

dvbcindia

April 20, 2026

Other Decks in Business

Transcript

  1. Introduction Preparing Indian Manufacturing Sector for Global Supply- Chain Integration

    The “China Plus One” strategy has positioned India as the epicenter of the global manufacturing sector. As global manufacturers are actively mitigating their supply chain risk away from a single country dependency – this movement is named as China Plus One strategy. For India’s manufacturing sector, this represents a unique opportunity to attract and generate million dollars in new business from within India itself. The global buyers are actively looking for a right partner with exceptional quality. To win this race organizations are rethinking their style to Operational Excellence. To sustain in this competitive environment, MSMEs are required to adopt advanced methodologies such as data-driven quality management, predictive analysis and proper manufacturing system. Drawing on our experience at D&V Business Consulting, we see leading companies prioritizing an integrated framework as a foundation for sustainable growth and global supply chain alignment.
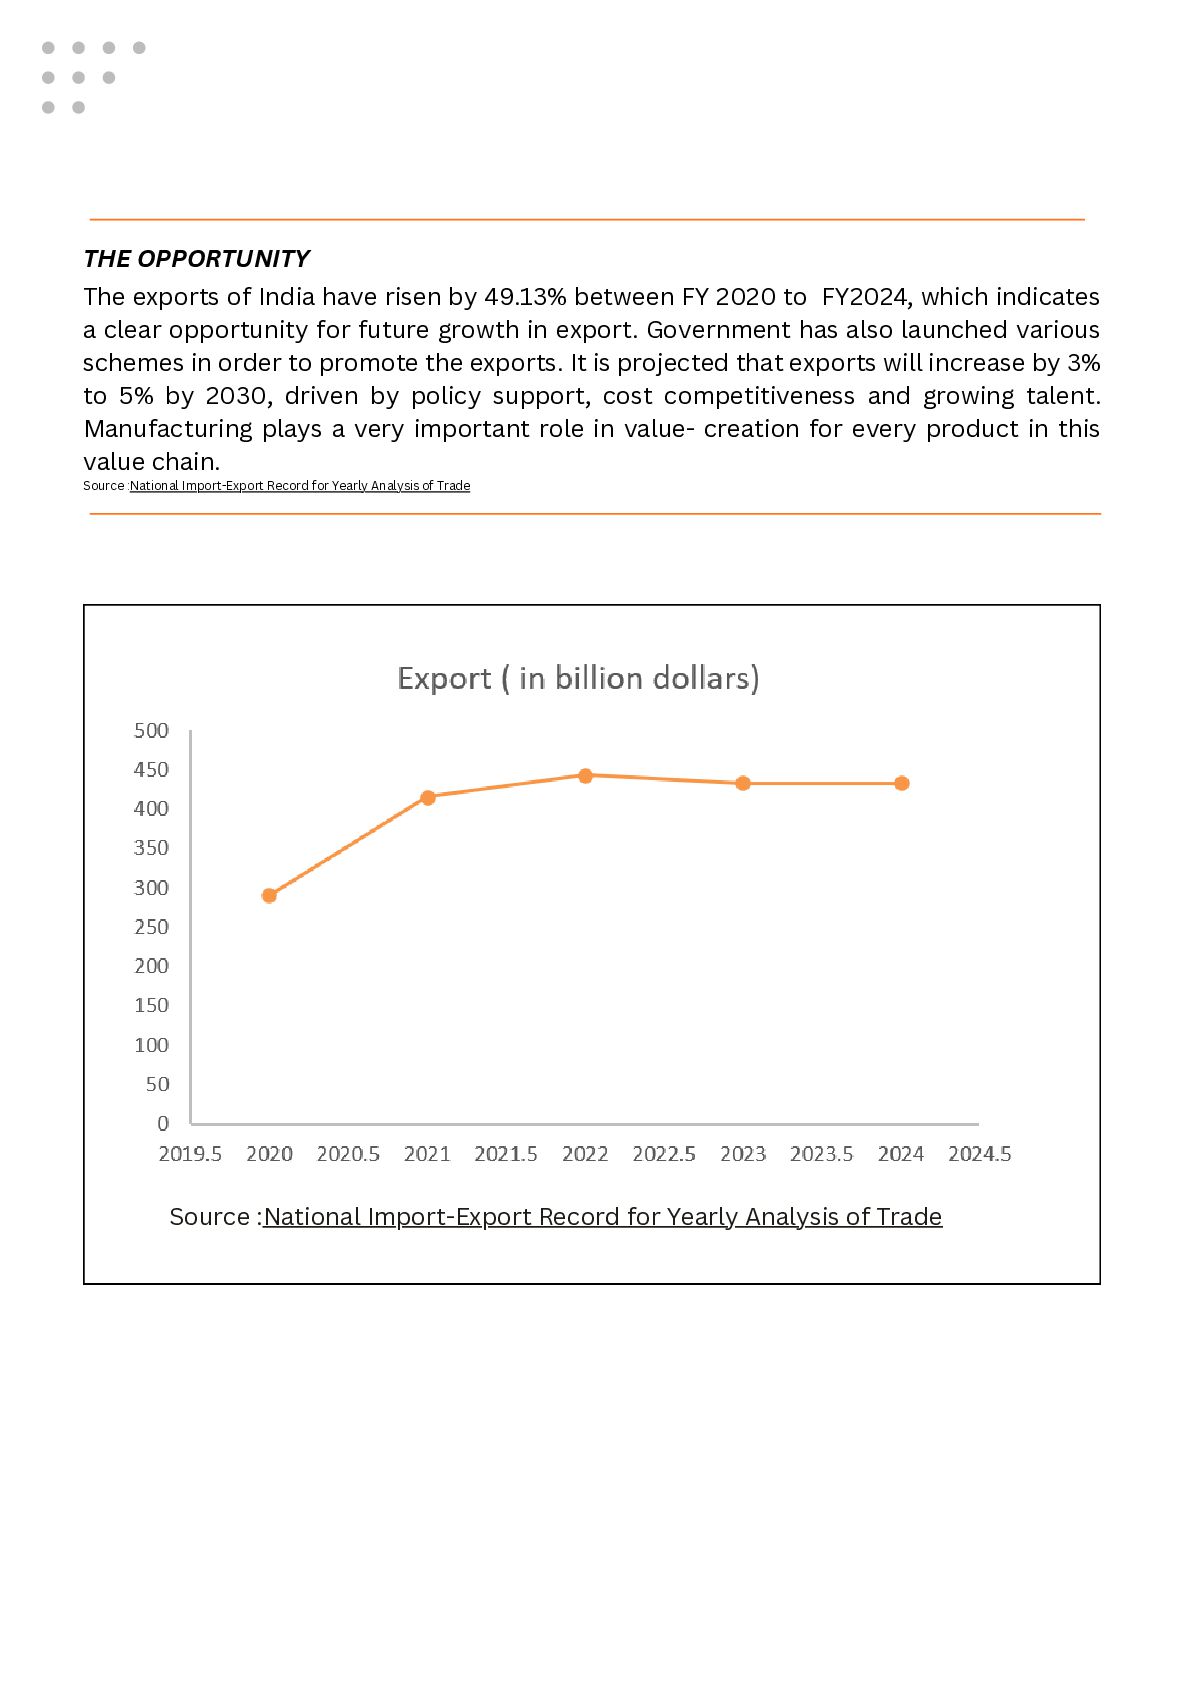
  2. Source :National Import-Export Record for Yearly Analysis of Trade The

    exports of India have risen by 49.13% between FY 2020 to FY2024, which indicates a clear opportunity for future growth in export. Government has also launched various schemes in order to promote the exports. It is projected that exports will increase by 3% to 5% by 2030, driven by policy support, cost competitiveness and growing talent. Manufacturing plays a very important role in value- creation for every product in this value chain. Source :National Import-Export Record for Yearly Analysis of Trade THE OPPORTUNITY
  3. This paper outlines how the Zero Defect Roadmap can help

    manufacturing businesses to align with global supply chain standards. It focuses on shift from reactive quality control to proactive quality, system driven operational excellence focusing on: Understanding AQL and PPM Correct way to measure defect rate Risk Mitigation Strategy The Scaling Wall The Golden Settings Technology used to achieve Operational Excellence Guide to implement operational excellence
  4. The Global Quality Crisis To understand why quality has become

    the primary barrier to enter the global market, we must firstly understand what exactly quality is. The standards that international brands impose are not what was acceptable a decade ago. They represent a fundamentally different paradigm- one where defects are no longer measured in terms of percentage but in parts per million. Quality Standard: AQL or PPM The global chain has moved on. Most of the MNCs especially in food processing, pharmaceutical and consumer goods are now shifted to Parts per million (PPM) approach in order to track defects. PPM is used to quantify the defect rate in manufacturing process. It counts how many finished parts per million are produced. In this method a part with five defect is still considered as just one defective unit. 500 PPM is considered to be the industry standard for FMCG supply and packaging partners of global brands. It reduces to 100 PPM or less when it comes to Pharmaceuticals. The standard of AQL or PPM is not a request – it is a contractual requirement for Vendor Agreement with International buyers. Failing to meet the criteria may attract penalties, Corrective and Preventive Actions (CAPA) and ultimately delisting For decades the Acceptable Quality Level (AQL) system was a reliable quality standard needed for business between buyer and supplier. Under AQL, the defect rate between 1.5% and 4% was considered ‘acceptable’. AQL is the sample-based inspection method used to determine the maximum number of defect or defect rate acceptable before rejecting the complete batch. AQL helps in finding out the defects before the shipment. As per AQL the defect is classified into three categories: Critical: Unacceptable (0%), dangerous to use Major: Unacceptable quality and reduced usability (till 2.5%) Minor: Acceptable or have negligible impact on usability (2.5%-4%) For instance, if there is a batch of 10,000 units and AQL is 1% (i.e. 100 defective units), the entire batch would be rejected.
  5. This is the Trust Gap where International market does not

    doubt capability of Indian suppliers but are uncertain about the consistency. And global chain see this uncertainty as a risk which the procurement team has to eliminate. When an International team visits Indian Industries, they are not evaluating the machinery but the management system. They want to see the documented standardized procedures at every workstation. They believe that the quality comes from the process not only from the presence of the skilled operator. They want to see that the production at night is of the same quality as during the day. The Trust Gap: Why MSMEs Lose Long Term Contracts What they find in Indian MSMEs is the complete opposite: quality depends on the experience of operators, machine settings written informally on the board and the reactive quality control approach where the product is examined at the end to find out the defect not at the beginning or during the process to prevent it. THE TRUST GAP INSIGHT Risk Mitigation: The Business Case for Zero Defect Status From a buyer’s perspective, the packaging partner is not just a vendor – he is a risk management strategy. From the commercial perspective , a single quality failure can result in: A product recall in a developed market can cost a brand between ₹50 crores to ₹500 crores, collecting products from stores, logistics, consumer compensation, legal fee and reputational damage. A failure that causes the production line stoppage at an MNC’s bottling and filling facility. Every hour of stoppage can cost ₹15- ₹40 lakh in lost production. If the product does not meet the regulatory compliance of country like EU or US, they can impose ban on imports. Fixing this issue can cost 12-24 months which would cause a huge revenue loss and lost market access.
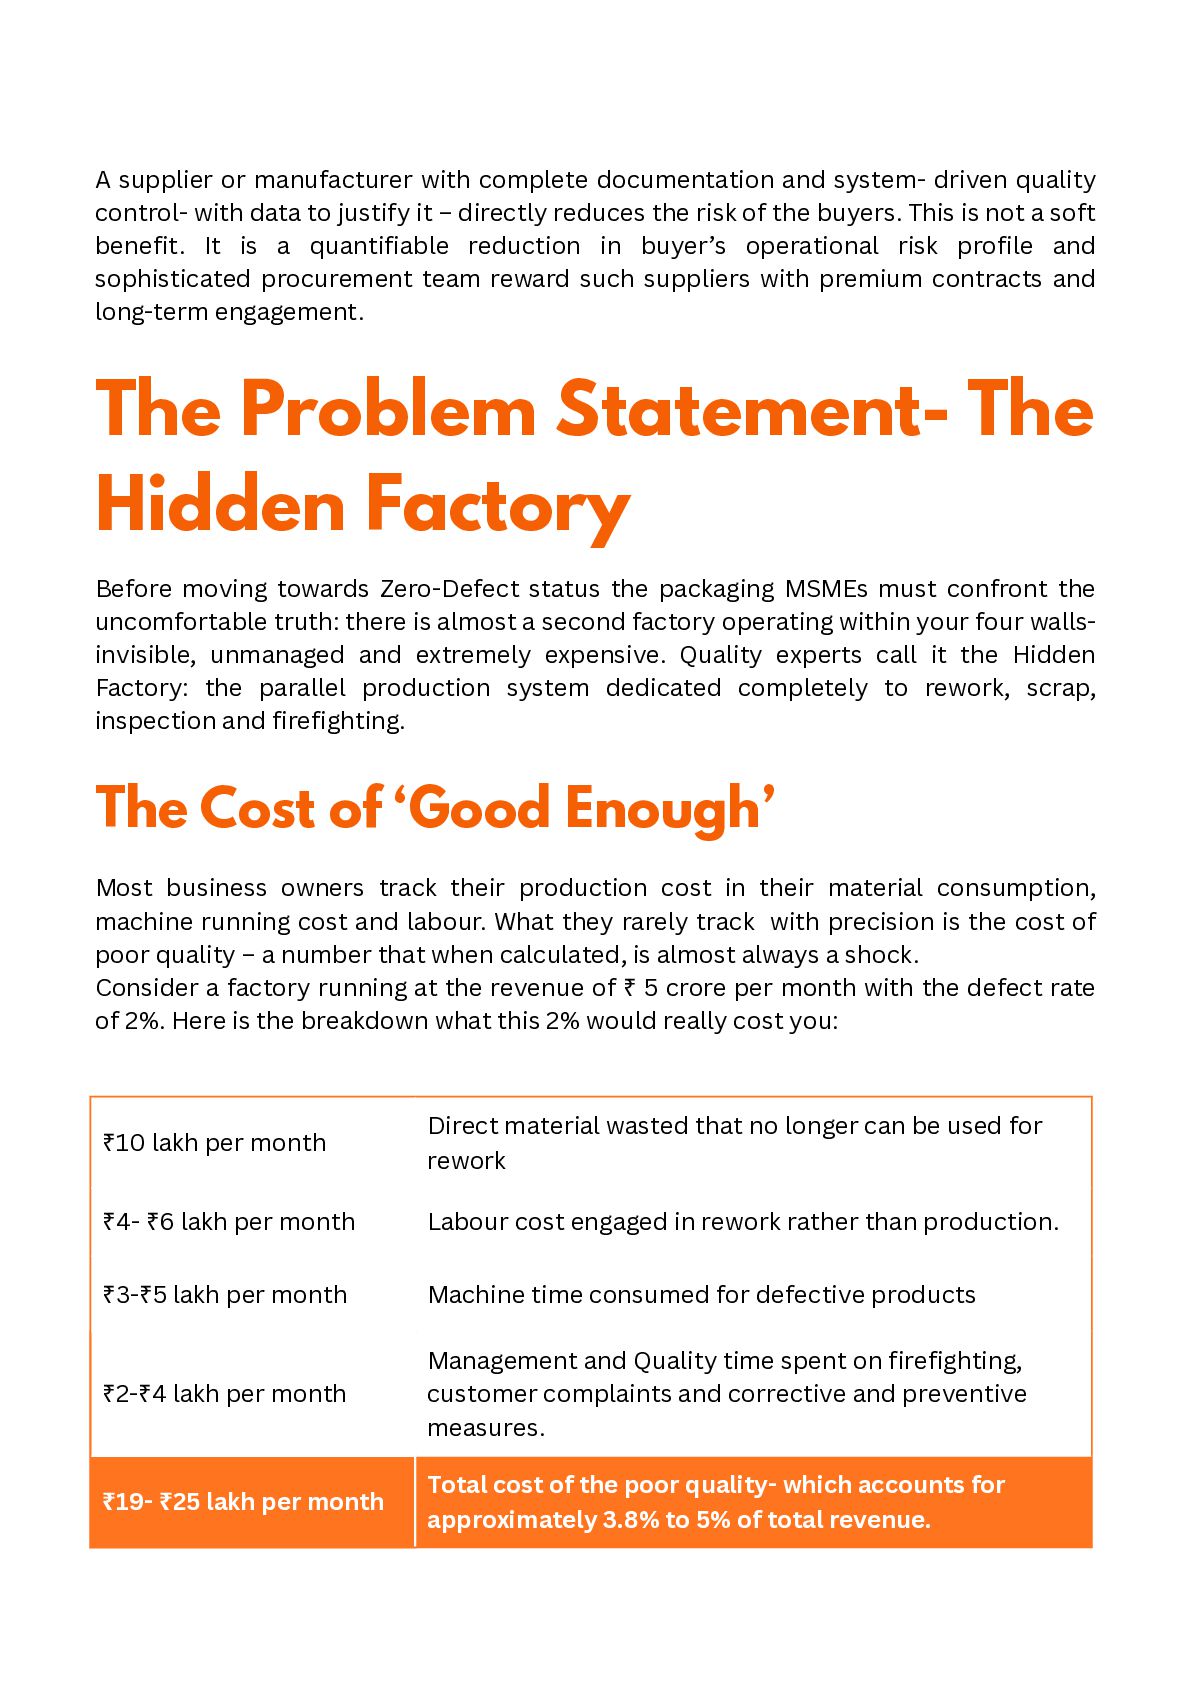
  6. ₹10 lakh per month Direct material wasted that no longer

    can be used for rework ₹4- ₹6 lakh per month Labour cost engaged in rework rather than production. ₹3-₹5 lakh per month Machine time consumed for defective products ₹2-₹4 lakh per month Management and Quality time spent on firefighting, customer complaints and corrective and preventive measures. ₹19- ₹25 lakh per month Total cost of the poor quality- which accounts for approximately 3.8% to 5% of total revenue. The Problem Statement- The Hidden Factory Before moving towards Zero-Defect status the packaging MSMEs must confront the uncomfortable truth: there is almost a second factory operating within your four walls- invisible, unmanaged and extremely expensive. Quality experts call it the Hidden Factory: the parallel production system dedicated completely to rework, scrap, inspection and firefighting. A supplier or manufacturer with complete documentation and system- driven quality control- with data to justify it – directly reduces the risk of the buyers. This is not a soft benefit. It is a quantifiable reduction in buyer’s operational risk profile and sophisticated procurement team reward such suppliers with premium contracts and long-term engagement. The Cost of ‘Good Enough’ Most business owners track their production cost in their material consumption, machine running cost and labour. What they rarely track with precision is the cost of poor quality – a number that when calculated, is almost always a shock. Consider a factory running at the revenue of ₹ 5 crore per month with the defect rate of 2%. Here is the breakdown what this 2% would really cost you:
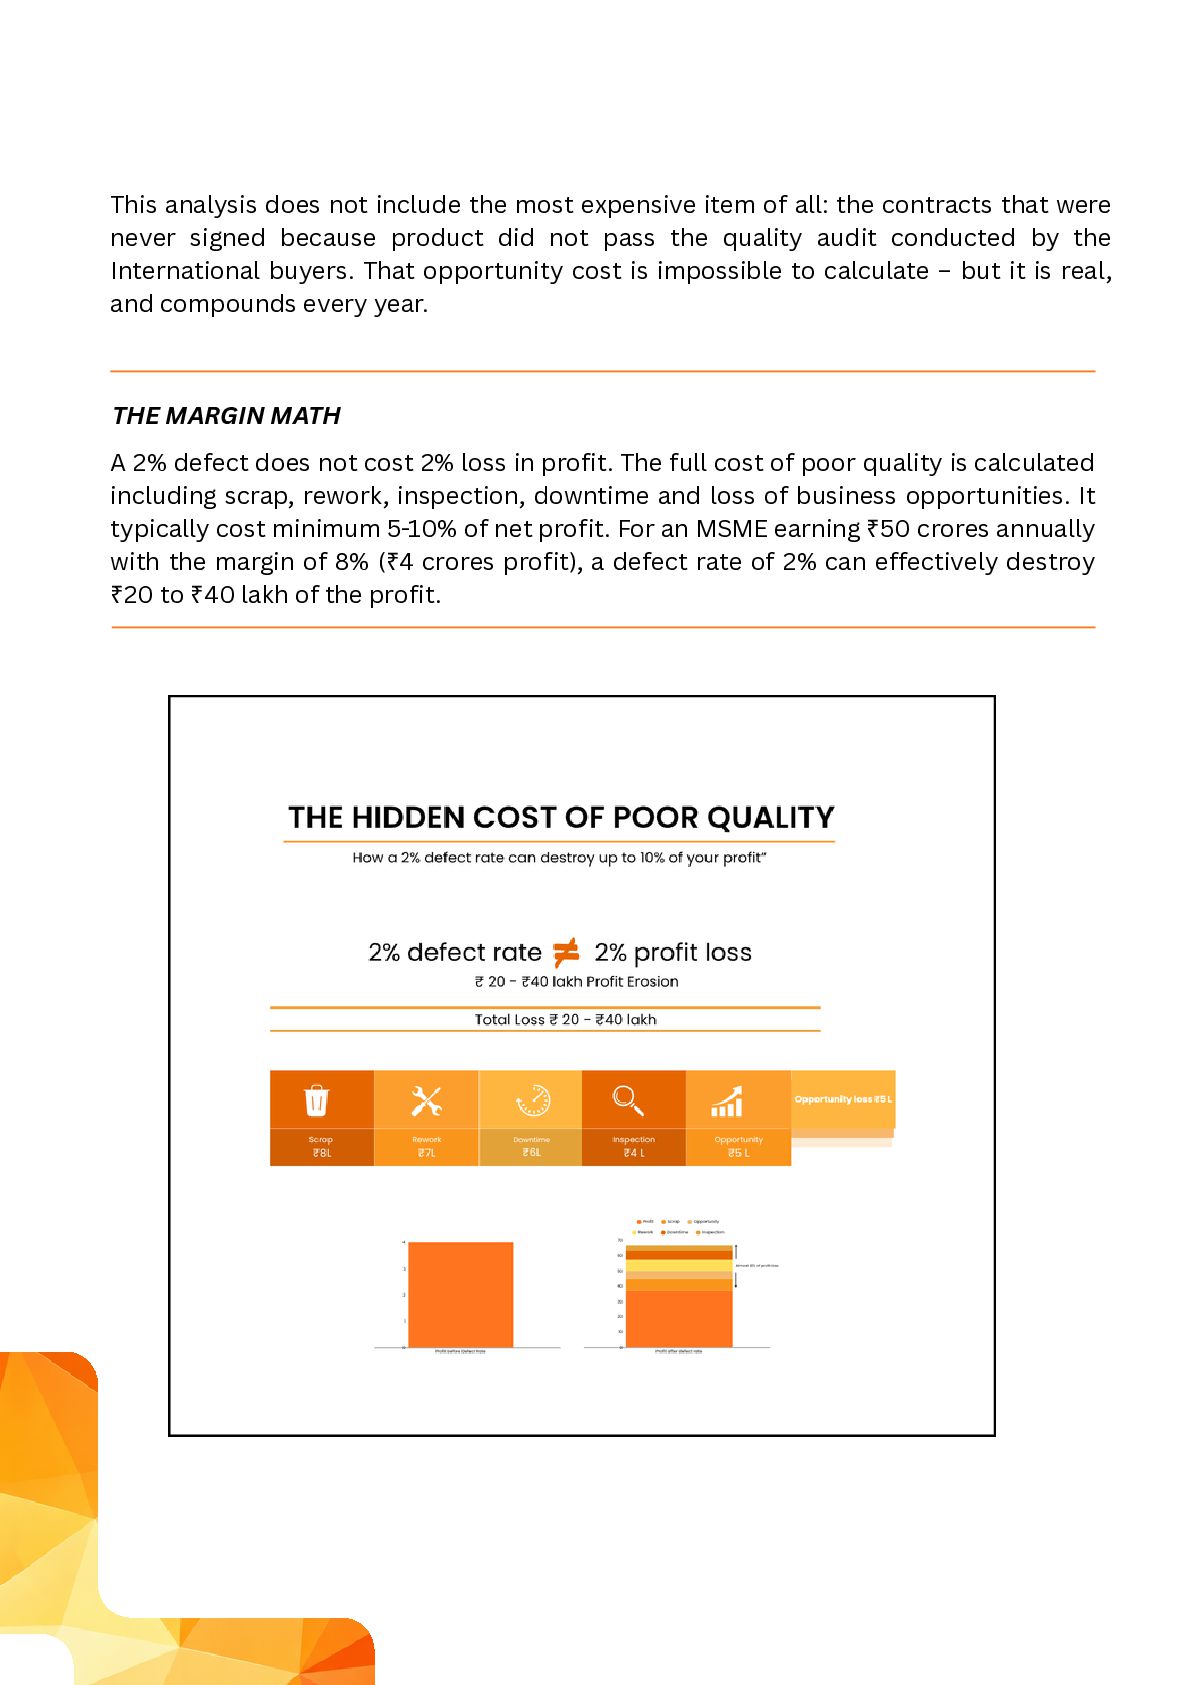
  7. A 2% defect does not cost 2% loss in profit.

    The full cost of poor quality is calculated including scrap, rework, inspection, downtime and loss of business opportunities. It typically cost minimum 5-10% of net profit. For an MSME earning ₹50 crores annually with the margin of 8% (₹4 crores profit), a defect rate of 2% can effectively destroy ₹20 to ₹40 lakh of the profit. This analysis does not include the most expensive item of all: the contracts that were never signed because product did not pass the quality audit conducted by the International buyers. That opportunity cost is impossible to calculate – but it is real, and compounds every year. THE MARGIN MATH
  8. The Scaling Wall: Why Traditional Management Fails at Volume There

    is a critical production brink- typically when production volume doubles or SKU complexity increases significantly- beyond which a traditional, personality driven management system begins to collapse. Decisions that were manageable with one shift and 20 workers becomes unmanageable with three shifts and 60 workers. Quality systems that worked through proximity and personal oversight fails when owner or the production manager is not present at every crucial step of production. This is the scaling wall. It is the point where the manufacturing unit fails even after having excellent machinery and capable people due to inconsistent output, missed delivery commitments and loss of confidence of buyers who had once trust them. Crossing Scaling Wall requires replacing human dependency with system dependency- and that is precisely what Operational Excellence provides. Human Dependency: The Expert Operator Trap The most common response to quality problem in traditional packaging is to rely on expertise- a specific person who has years of experience, knows exactly how to coax consistent output from a particular machine or unit. This expertise is valuable but also not scalable. The Expert Operator Trap is demonstrated in several costly ways: Knowledge hoarding: critical process stays in the memory of the limited people and are lost once they resign, fall ill or take leave. Shift-to-shift variation: the quality of production of morning shift may vary from the quality of night shift due to change in operator. Due to which buyer receives mixed product and lose trust. Resistance to documentation: skilled operators resist to share their knowledge or formalize it into SOPs, as their expertise is their job security. Scaling impossibility: when planning to increase the production volume, hiring two experts with same quality is not possible. The expertise does not replicate.
  9. The Three Pillars of Zero- Defect Operational Excellence Operational Excellence

    in packaging industry rests on three interlinking pillars. Each pillar independently improves quality. Together, they create self-reinforcing system of consistent output that International buyers demand. These are not sequential initiatives- they are concurrent disciplines that must be developed in parallel and maintained permanently Pillar 1: Standardized Work Standardized work is the foundation for Operational Excellence. It is the systematic documentation and enforcement of the efficient and best method for every step of the production process. This is not about increasing paperwork – it is about transferring quality from operator’s mind to the workstation itself. Visual SOPs at Every Station A Standard Operating Procedure is only effective if used on regular basis. Traditional SOPs – a dense text document in quality manager’s desk – are rarely used. Visual SOPs are used. A visual SOPs uses diagrams, photographs, color-coded decision trees and concise text to communicate the correct procedure, the critical parameters and common failure modes in a format that any fresher can understand in 30 seconds. Every workstation in a Zero- Defect packaging facility must have a laminated, machine- specific Visual SOPs that covers: Machine setup parameter for each SKUs (must include temperature, speed, seal time) Raw material acceptance criteria (film thickness, ink quality, roll dimensions) In – process quality check frequency and pass/fail criteria. Common defects photos with cause and corrective actions. Solution when output deviates from specifications.
  10. Eliminating Shift to Shift Deviation The most effective way to

    check the Standardized work system – does the night shift produce the same quality as the day shift produce? Mostly the answer is no- the gap is clearly visible in daily quality reports, customer complaint patters and rework data. Shift-to-shift variation is eliminated through ‘Golden Settings’- a documented, verified and locked set of factors for every machine SKU combination. So, when the shift changes the next operator does not need to reset the machine from estimation. They can refer the Golden Settings sheet to verify each parameter against the documented value before commencing production. Any variation requires supervisor approval and proper documentation. Our consultants at D&V Business Consulting have noticed that factories implementing Visual SOPs and Golden Settings consistently report around a 30-40% reduction in defect rate without any additional investment on new machinery. Consultant’s View Pillar 2: Poka- Yoke Poka- Yoke is a Japanese concept that literally means ‘mistake-proofing’. The philosophy is very clear, rather than relying on human attention, skills and caution to prevent errors, design the system where physical errors are impossible, or at minimum, immediately visible before it transmits through the production lifecycle. In packaging context, Poka- Yoke moves quality control from end-of-line inspection prevention to in-process prevention. In simple words it moves defect detection after they have been made to making it impossible to produce in the first place. Sensor-Based Error Prevention Poka- Yoke devices can be as simple as a physical jig that prevents a label from being misaligned or as sophisticated as machine- integrated vision system that rejects the output with print defects at line itself. The key principle is that the error-proofing mechanism must be automatic -it must not depend on an operator choosing to verify.
  11. The objective of error proofing is not to find the

    errors- it is to create an environment where mistakes are impossible. If a defect is detected at end of line it has already consumed material, time and labor. At the same time defect detected at source would cost nothing. Practical applications of Poka-Yoke in packaging industry include: In-line check weighing – every finished package passes through automatic weighing scale set to reject units outside the tolerance level. Under-fill cannot pass. Over- fill cannot pass. Legal and commercial compliance is automatic. Sealing Integrity detection- pressure or temperature sensors at sealing jaws alert the control system if parameters deviate beyond the validated range, pausing the line before the batch of defected seals is produced. Flap Detection- sensor verify that every carton is sealed and folded prior to palletising process. Code verification- bar code scanner to verify that every printed code, batch number, manufacturing details and bar code present, is legible and accurate before the product is packed into the cases. Colour mark registration- photocell sensors ensures that the packaging film is correctly registered so the artwork is centered on every pack. POKA-YOKE PRINCIPLE Pillar 3: Total Productive Maintenance (TPM) Quality and delivery reliability are impossible without reliable machinery. A packaging unit running at 75% uptime because of unplanned slowdown, long changeovers and minor faults cannot consistently meet the fill rates, delivery schedules and quality levels that global partners demand. Total Productive Maintenance (TPM) is the system that transforms machine reliability from possibility to outcome of the process. During D&V Business Consulting’s survey in 2025 with various businesses it was reported that 90% of the MSMEs do not have proper maintenance plan due to which they face frequent machine breakdown and greater inconsistency in production volume.
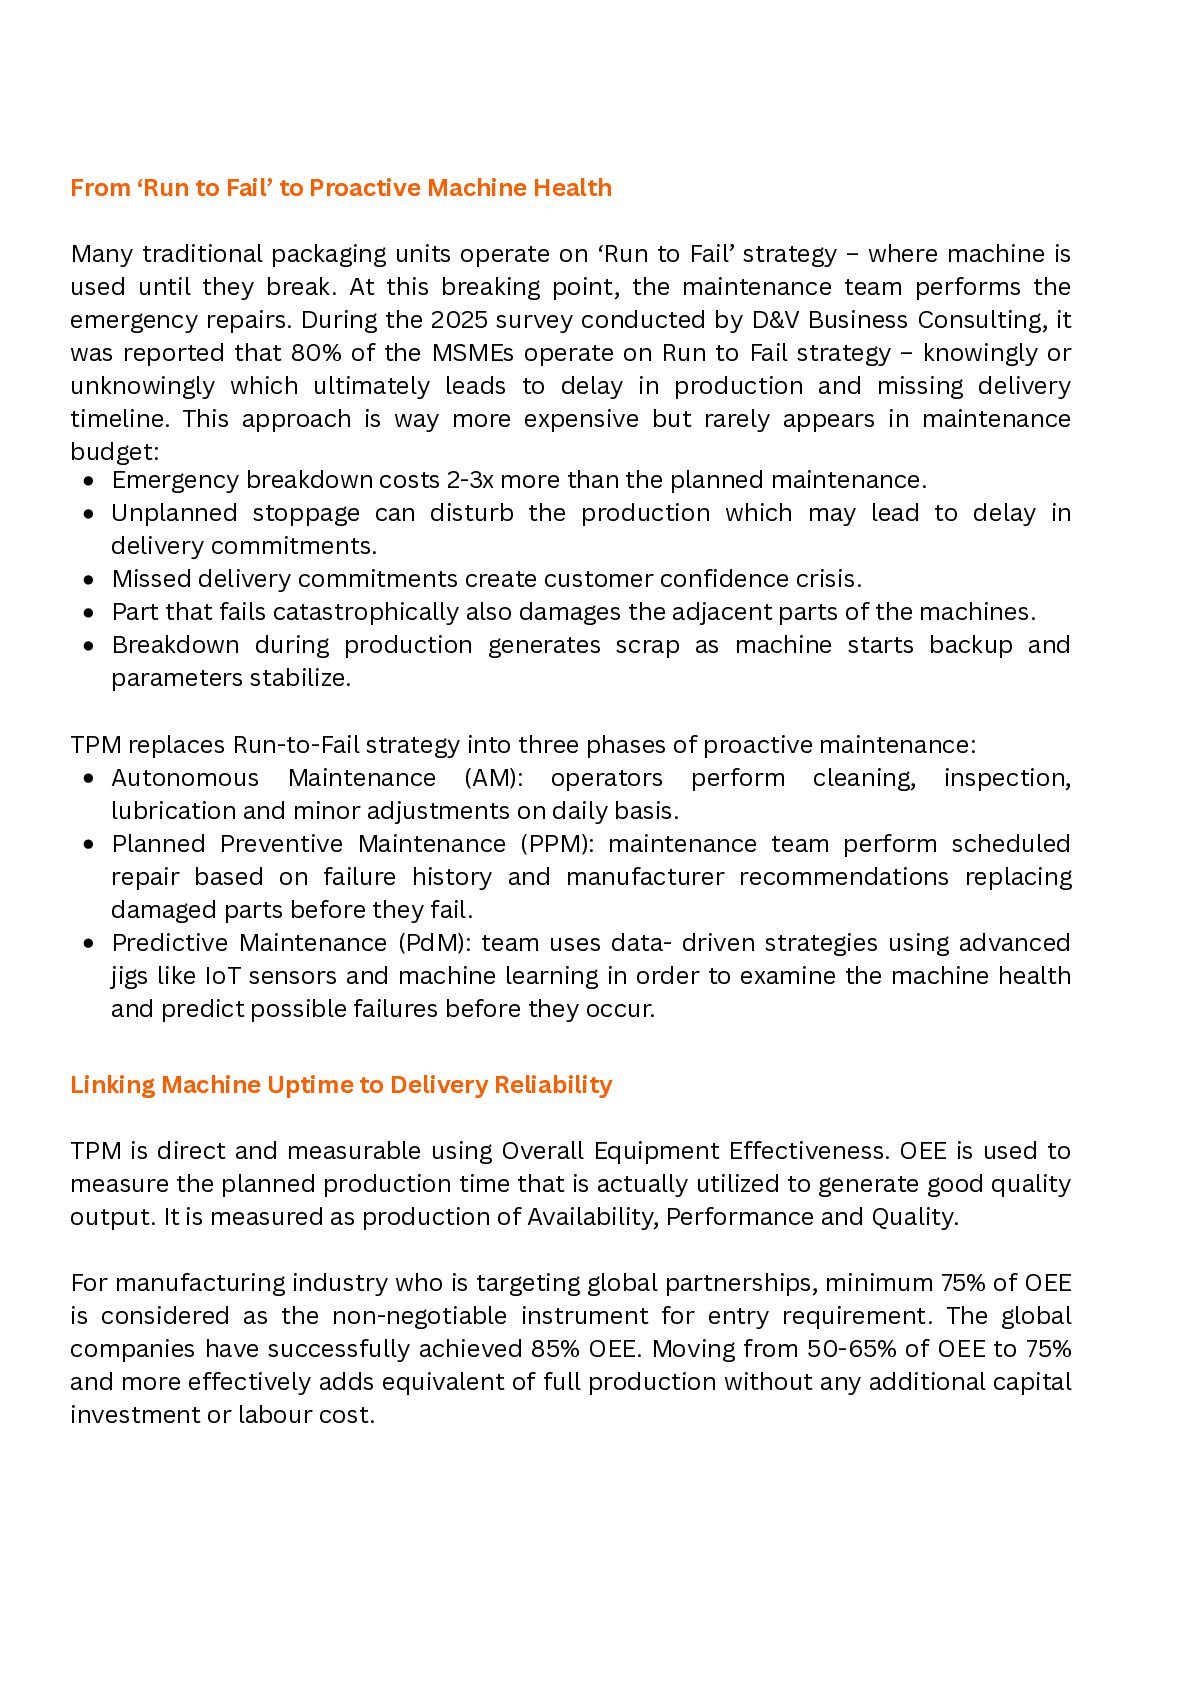
  12. TPM replaces Run-to-Fail strategy into three phases of proactive maintenance:

    Autonomous Maintenance (AM): operators perform cleaning, inspection, lubrication and minor adjustments on daily basis. Planned Preventive Maintenance (PPM): maintenance team perform scheduled repair based on failure history and manufacturer recommendations replacing damaged parts before they fail. Predictive Maintenance (PdM): team uses data- driven strategies using advanced jigs like IoT sensors and machine learning in order to examine the machine health and predict possible failures before they occur. From ‘Run to Fail’ to Proactive Machine Health Many traditional packaging units operate on ‘Run to Fail’ strategy – where machine is used until they break. At this breaking point, the maintenance team performs the emergency repairs. During the 2025 survey conducted by D&V Business Consulting, it was reported that 80% of the MSMEs operate on Run to Fail strategy – knowingly or unknowingly which ultimately leads to delay in production and missing delivery timeline. This approach is way more expensive but rarely appears in maintenance budget: Emergency breakdown costs 2-3x more than the planned maintenance. Unplanned stoppage can disturb the production which may lead to delay in delivery commitments. Missed delivery commitments create customer confidence crisis. Part that fails catastrophically also damages the adjacent parts of the machines. Breakdown during production generates scrap as machine starts backup and parameters stabilize. Linking Machine Uptime to Delivery Reliability TPM is direct and measurable using Overall Equipment Effectiveness. OEE is used to measure the planned production time that is actually utilized to generate good quality output. It is measured as production of Availability, Performance and Quality. For manufacturing industry who is targeting global partnerships, minimum 75% of OEE is considered as the non-negotiable instrument for entry requirement. The global companies have successfully achieved 85% OEE. Moving from 50-65% of OEE to 75% and more effectively adds equivalent of full production without any additional capital investment or labour cost.
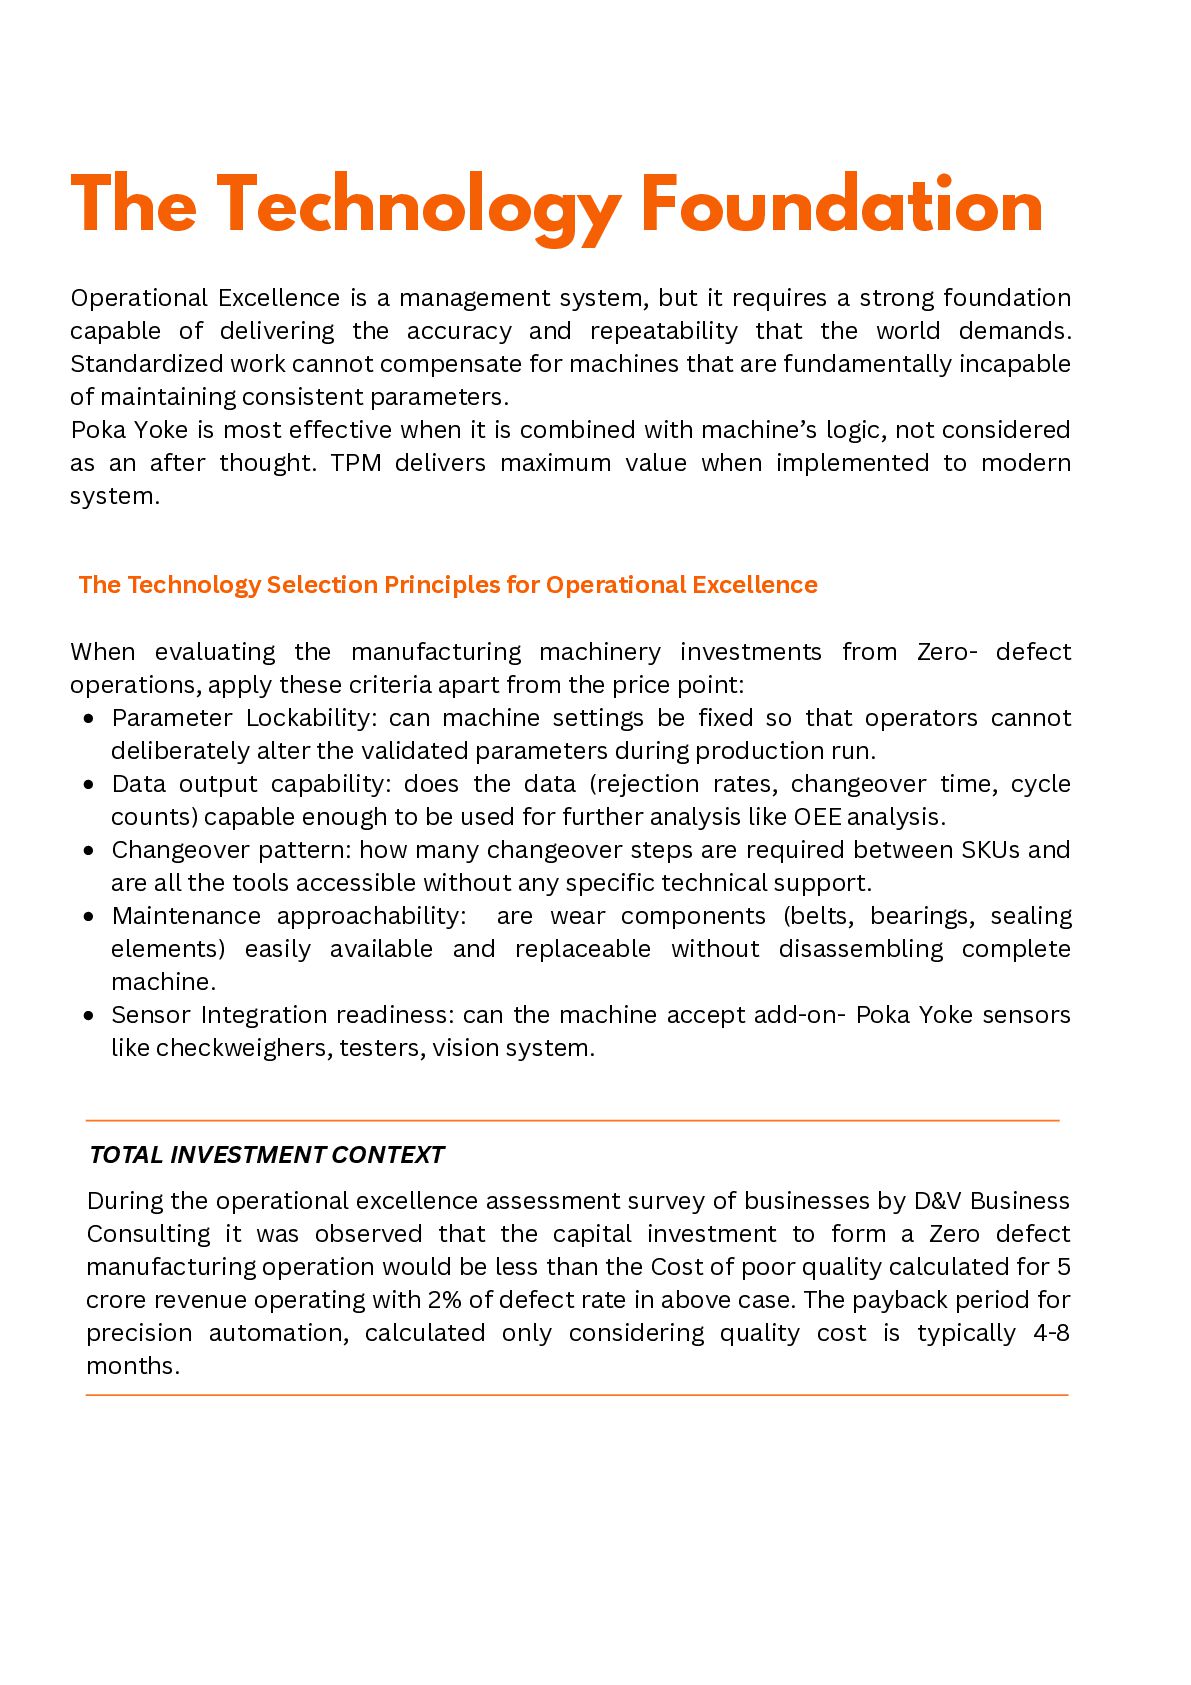
  13. The Technology Foundation Operational Excellence is a management system, but

    it requires a strong foundation capable of delivering the accuracy and repeatability that the world demands. Standardized work cannot compensate for machines that are fundamentally incapable of maintaining consistent parameters. Poka Yoke is most effective when it is combined with machine’s logic, not considered as an after thought. TPM delivers maximum value when implemented to modern system. The Technology Selection Principles for Operational Excellence When evaluating the manufacturing machinery investments from Zero- defect operations, apply these criteria apart from the price point: Parameter Lockability: can machine settings be fixed so that operators cannot deliberately alter the validated parameters during production run. Data output capability: does the data (rejection rates, changeover time, cycle counts) capable enough to be used for further analysis like OEE analysis. Changeover pattern: how many changeover steps are required between SKUs and are all the tools accessible without any specific technical support. Maintenance approachability: are wear components (belts, bearings, sealing elements) easily available and replaceable without disassembling complete machine. Sensor Integration readiness: can the machine accept add-on- Poka Yoke sensors like checkweighers, testers, vision system. During the operational excellence assessment survey of businesses by D&V Business Consulting it was observed that the capital investment to form a Zero defect manufacturing operation would be less than the Cost of poor quality calculated for 5 crore revenue operating with 2% of defect rate in above case. The payback period for precision automation, calculated only considering quality cost is typically 4-8 months. TOTAL INVESTMENT CONTEXT
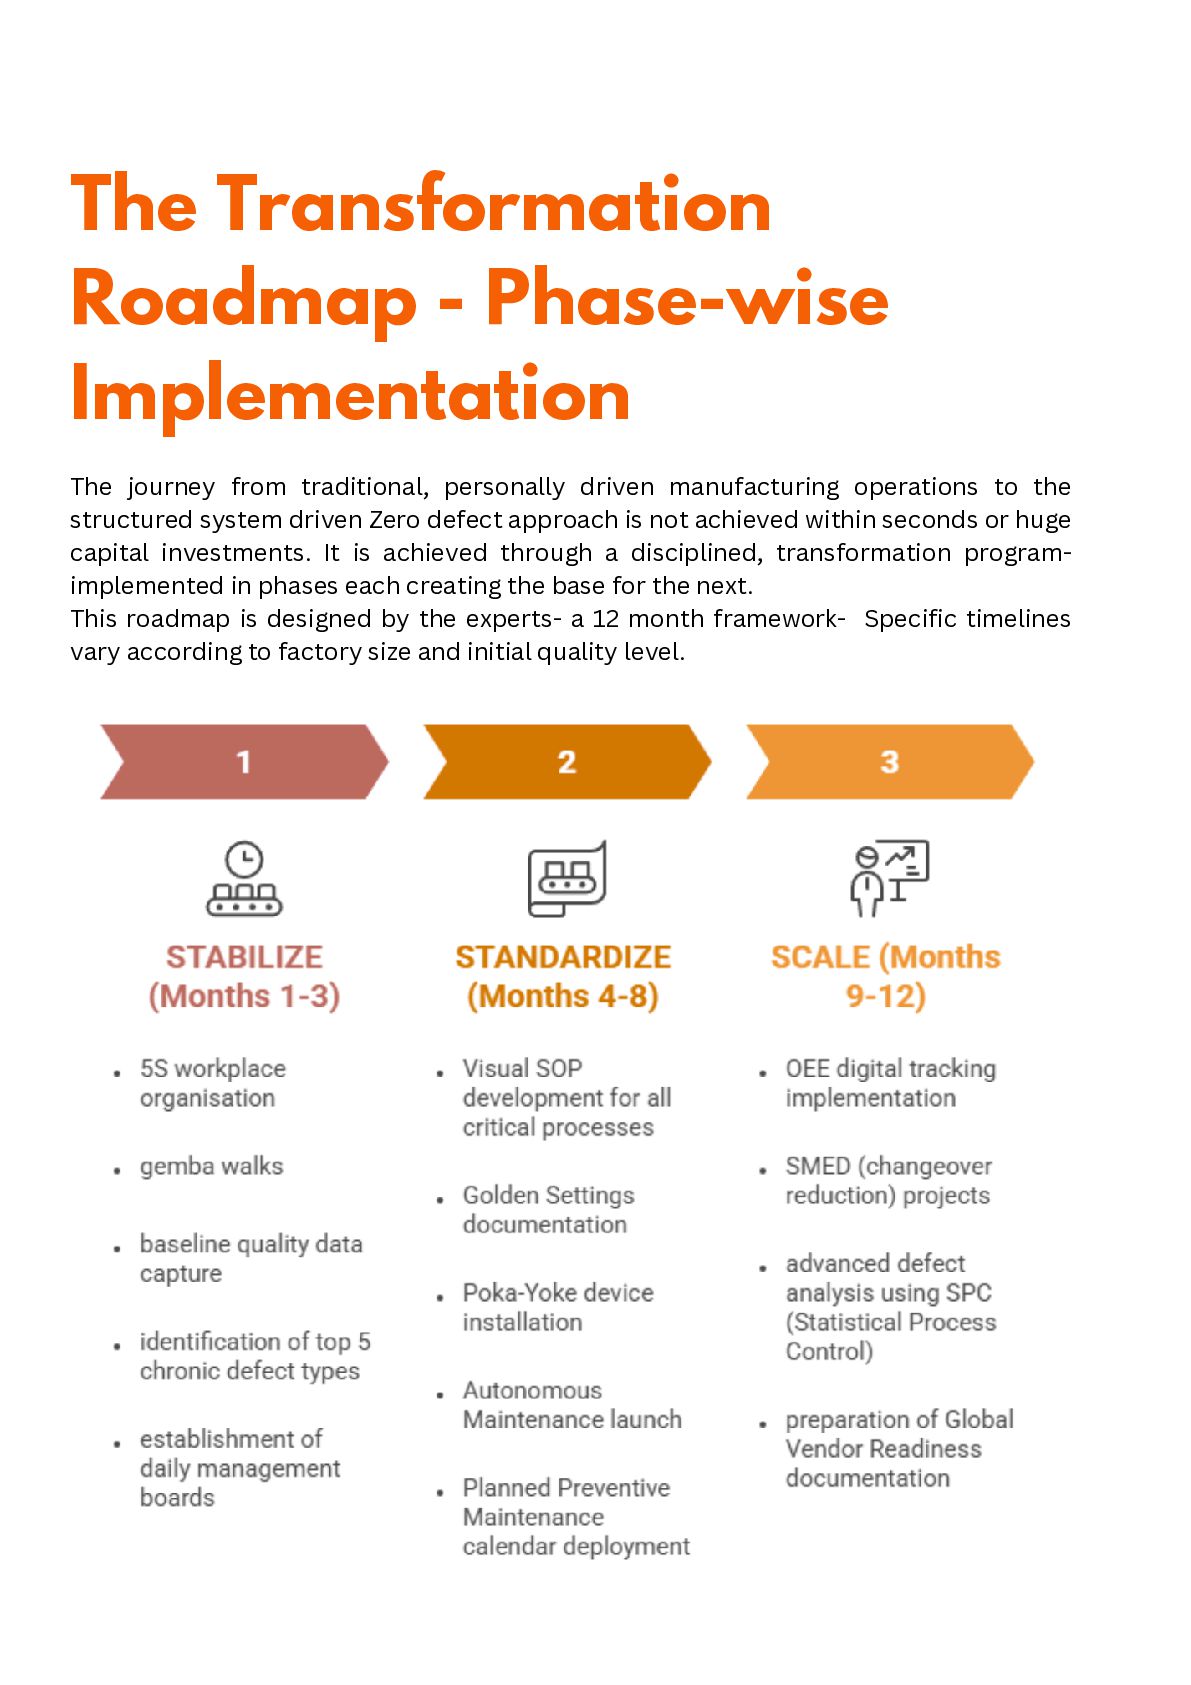
  14. The Transformation Roadmap - Phase-wise Implementation The journey from traditional,

    personally driven manufacturing operations to the structured system driven Zero defect approach is not achieved within seconds or huge capital investments. It is achieved through a disciplined, transformation program- implemented in phases each creating the base for the next. This roadmap is designed by the experts- a 12 month framework- Specific timelines vary according to factory size and initial quality level.
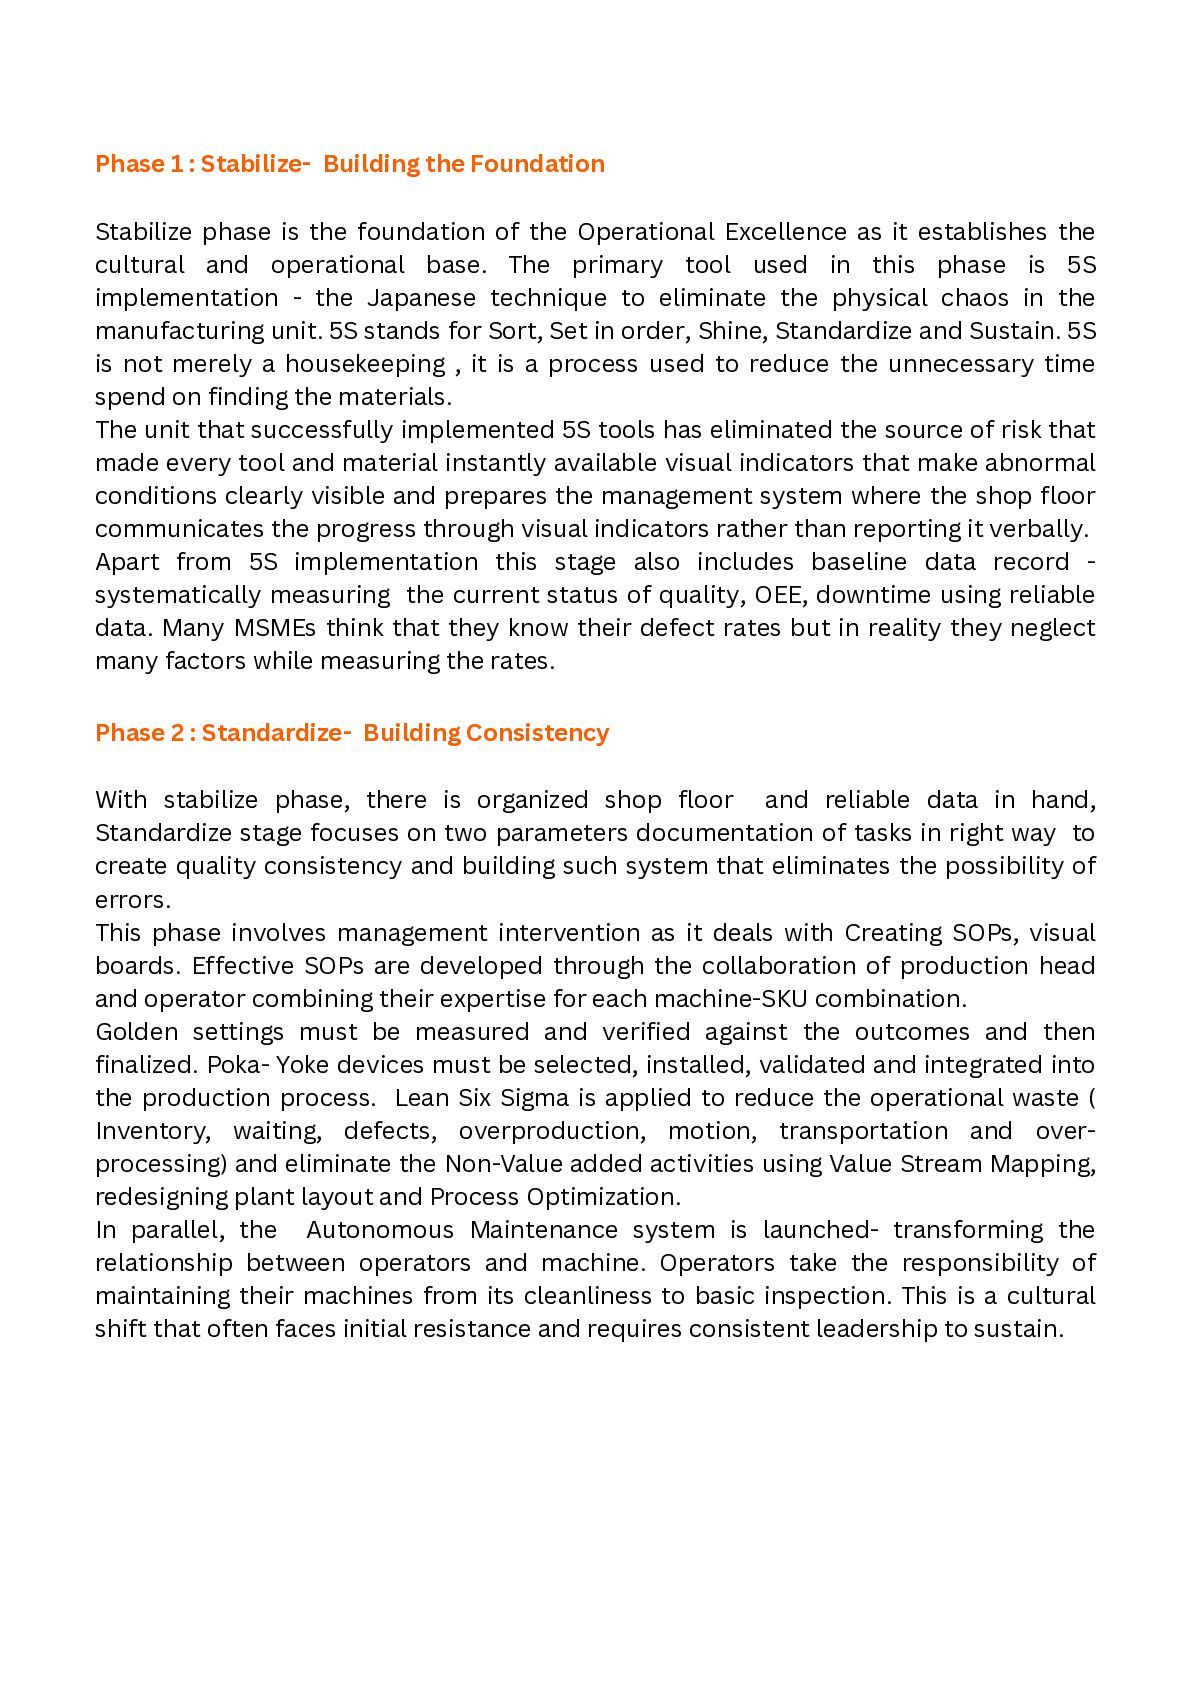
  15. Phase 1 : Stabilize- Building the Foundation Stabilize phase is

    the foundation of the Operational Excellence as it establishes the cultural and operational base. The primary tool used in this phase is 5S implementation - the Japanese technique to eliminate the physical chaos in the manufacturing unit. 5S stands for Sort, Set in order, Shine, Standardize and Sustain. 5S is not merely a housekeeping , it is a process used to reduce the unnecessary time spend on finding the materials. The unit that successfully implemented 5S tools has eliminated the source of risk that made every tool and material instantly available visual indicators that make abnormal conditions clearly visible and prepares the management system where the shop floor communicates the progress through visual indicators rather than reporting it verbally. Apart from 5S implementation this stage also includes baseline data record - systematically measuring the current status of quality, OEE, downtime using reliable data. Many MSMEs think that they know their defect rates but in reality they neglect many factors while measuring the rates. Phase 2 : Standardize- Building Consistency With stabilize phase, there is organized shop floor and reliable data in hand, Standardize stage focuses on two parameters documentation of tasks in right way to create quality consistency and building such system that eliminates the possibility of errors. This phase involves management intervention as it deals with Creating SOPs, visual boards. Effective SOPs are developed through the collaboration of production head and operator combining their expertise for each machine-SKU combination. Golden settings must be measured and verified against the outcomes and then finalized. Poka- Yoke devices must be selected, installed, validated and integrated into the production process. Lean Six Sigma is applied to reduce the operational waste ( Inventory, waiting, defects, overproduction, motion, transportation and over- processing) and eliminate the Non-Value added activities using Value Stream Mapping, redesigning plant layout and Process Optimization. In parallel, the Autonomous Maintenance system is launched- transforming the relationship between operators and machine. Operators take the responsibility of maintaining their machines from its cleanliness to basic inspection. This is a cultural shift that often faces initial resistance and requires consistent leadership to sustain.
  16. Phase 3: Global Partnership Ready This stage redefines the operations

    into well documented and data- driven format positioned to meet the audit requirements of Global brands. The central tool is digital transformation where OEE is tracked not through manual whiteboards but real-time data, shift production data in such a way that losses are defined categorically and drives planned improvement projects. SMED( Single Minute Exchange of Die) projects here focuses on reducing machine changeover time between SKUs. In manufacturing, changeover time directly defines MOQ (minimum order quantity) feasibility and ability to respond to customer requirement - the two parameters that international buyers prioritize while selecting the right vendor. The end result of this phase is the preparation of the Global Vendor Readiness documentation: the quality manual, SOPs , process capability study FMEA( Failure Mode and Effect Analysis) for critical processes and audit ready system that allows global procurement team to assess the quality system effectively. Case Study: How Packaging MSME reduced the Defect Rates without Additional Capital Investment A mid-sized engineering unit was struggling with 4% defect rate that was fluctuated between day and night. The defect was due to problems like distortion, uneven coating or paint , unexpected machinery breakdown. Quality was entirely dependent upon the few operators who were handling the critical process. The production was completely disturbed in their absence. This lead to frequent customer complaints, inconsistent quality and ‘Hidden Factory’ cost that was eating upto 10% of the profit. After assessing the company, instead of recommending additional capital investment, the consultants of D&V recommended to fix the system by following Zero- Defect Strategy. Phase 1: 5S Workplace Organization- It was observed that the manufacturing unit was not organized. Result- Search time was high as there was no defined place for tools and raw materials. Firstly our consultants implemented 5S to reduce waste, ensure safety at workplace, enhance quality, increase productivity and improve machinery maintenance. Phase 2: Standardization and Golden Settings- The consultants later worked on creating a system by standardizing the procedures- Laminated Visual SOPs were place at every machine along with the quality manual. Golden Settings were fixed in order to ensure quality consistency across shifts.
  17. Phase 3: Later on Poka Yoke devices such as high

    speed cameras to identify surface pores, color- coded tooling to prevent wrong tool grade and interlock system to prevent distortion were installed. The Results: Within 8 months, the factory crossed the scaling wall, the overall defect rate dropped by 35% without any big investment. Process optimization was achieved using only existing machinery and workforce. The unit successfully passed the quality audit by global company and became the strategic partner. Conclusion: Building Global Presence The global companies are looking for new supply partners . The era of price-driven vendor selection is over. Today every serious buyer wants the system and quality driven vendor qualification. International buyers are not interested in cheapest manufacturing suppliers - they want the reliable one who offers the quality that is worth the price. The scaling and consistency that the global partners demand, it cannot be delivered by the talented operators working in an unstructured system. It can only be delivered through documented and continuous improving management system - which is what Operational Excellence for. From Vendor to Partner In global procurement , ‘vendor’ and ‘partner’ represent two distinct roles. A vendor relationship is built on short term , transaction based relationship completely dependent on price, terms and disposable. On contrary Partner is a strategic relationship which is long-term - built on shared risk, documentation and mutual investment in quality outcomes.
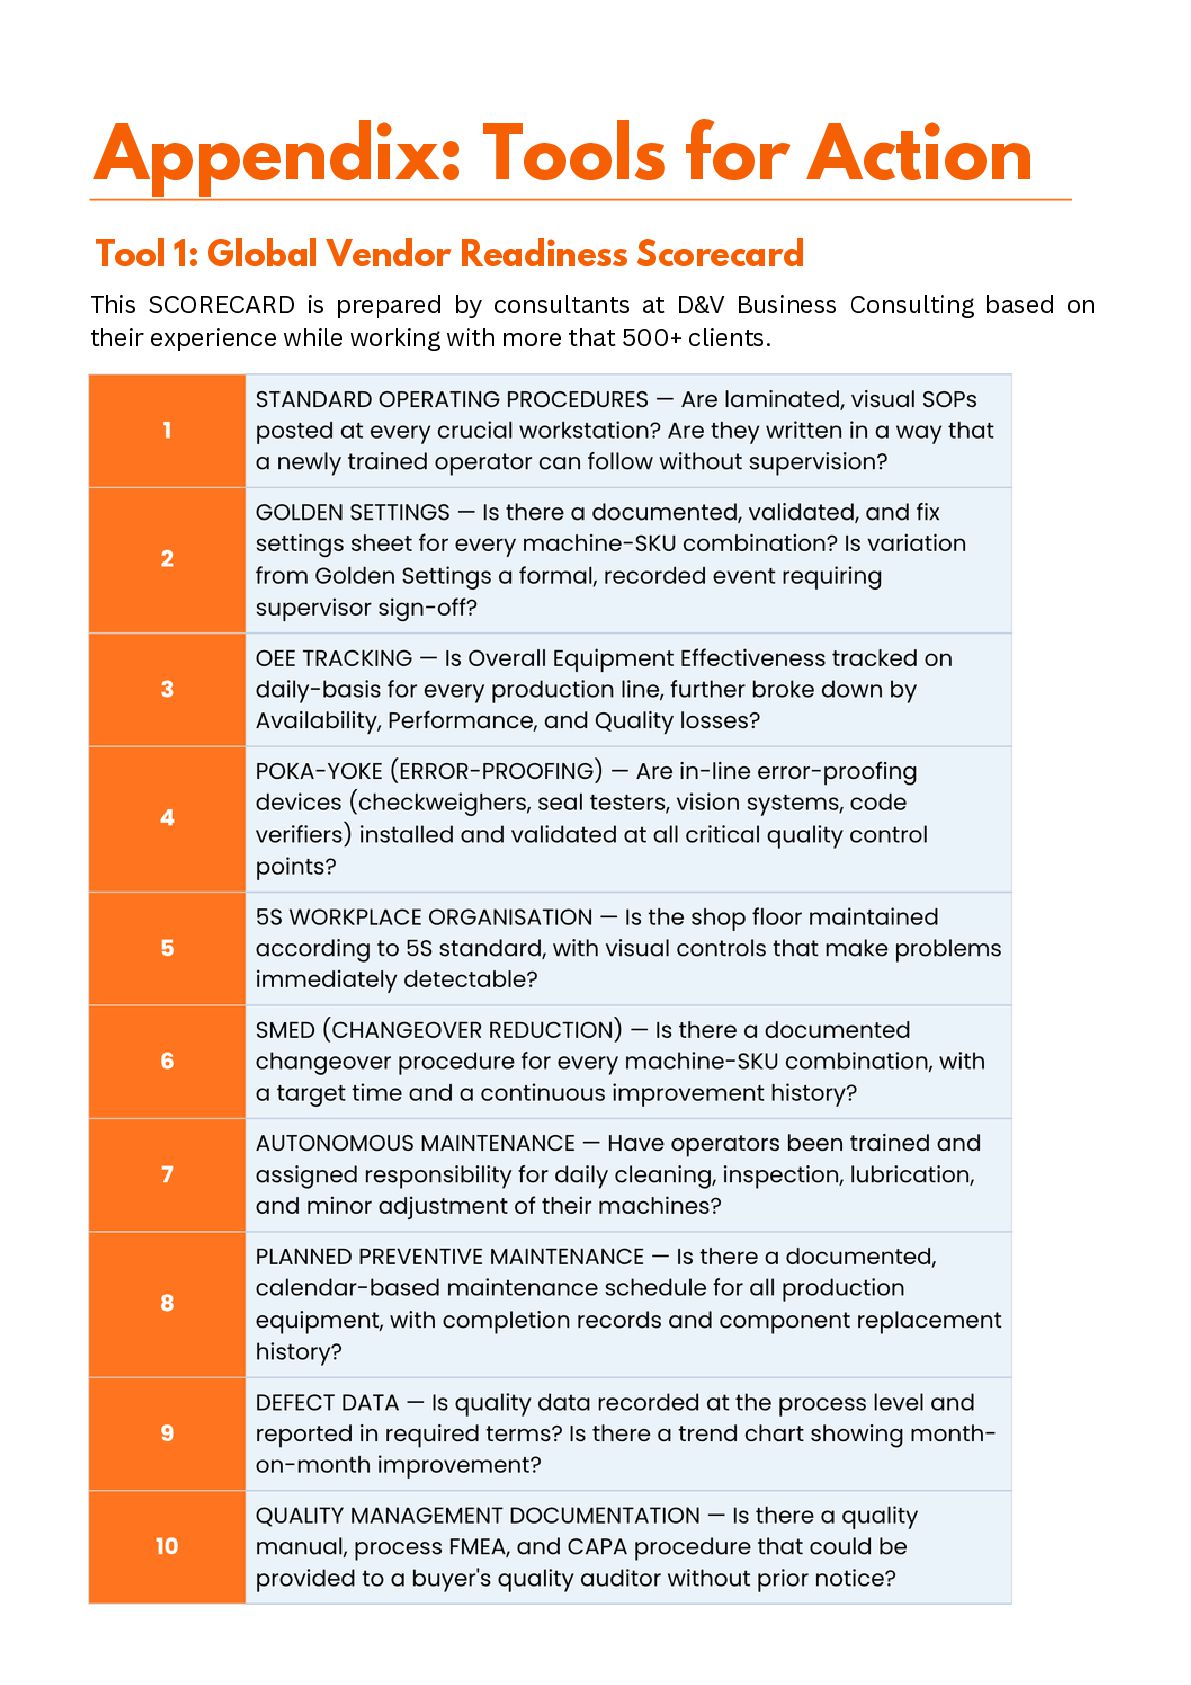
  18. Appendix: Tools for Action Tool 1: Global Vendor Readiness Scorecard

    This SCORECARD is prepared by consultants at D&V Business Consulting based on their experience while working with more that 500+ clients.
  19. Tool 2: 1 Day Zero- Defect Diagnostic The structured on-site

    diagnostic provides true and fair picture of the product’s current quality than any self- assessment. It is the structured audit of the production system against the 10 point scorecard above, delivering: A scored assessment of all readiness criteria, with evidences and findings. Identification of top 3 improvement area - majorly to move the quality needle on and buyer’s confidence on short-time. A benchmark comparison of your current OEE and PPM performance against industry standard. A true assessment to find out readiness to organize an international buyer’s audit - list out the specific gaps to close before one is scheduled.
  20. Get in touch We’ve seen that D&V Business Consulting is

    well‑positioned to help mid -sized MSMEs to become eligible for global supply chain integration as well as improving quality and productivity using the Operational Excellence. If you are seeking to formalize the operational systems that would support a significant volume scale-up, the roadmap in this paper is the starting point. Ready to get started? Contact us and we’ll be happy to help you start unlocking the path toward the operational excellence for your business In fact, in most cases the offering from D&V Business Consulting is more efficient and effective for companies as it provides expert guidance and act as the companion for your growth. D&V Business Consulting means the consulting dedicated to empower micro, small and medium enterprise with tailored outcome oriented solutions. It would assist you with the process to become the global brand. About the Authors: Dharmesh Parikh Anupam Chandra Partner and Implementer D&V Business Consulting [email protected] Co-Founder and Partner D&V Business Consulting [email protected]
  21. References: [1] Ministry of Commerce & Industry, Government of India.

    (2024). Annual Report 2023–24. Department for Promotion of Industry and Internal Trade (DPIIT). [2] India Brand Equity Foundation (IBEF). (2024). Indian Manufacturing Sector Report 2024. New Delhi: IBEF. Retrieved from, https://www.ibef.org/industry/manufacturing- sector-india [3] McKinsey & Company. (2023). India's turning point: An economic agenda to spur growth and jobs. McKinsey Global Institute. New York: McKinsey & Company. [4] International Organisation for Standardisation. (1999). ISO 2859-1:1999 — Sampling procedures for inspection by attributes. Part 1: Sampling schemes indexed by acceptance quality limit (AQL) for lot-by-lot inspection. Geneva: ISO. [5] American Society for Quality (ASQ). (2023). Cost of Quality: What Is It and Why Is It Important? Retrieved from https://asq.org/quality-resources/cost-of-quality [6] Crosby, P. B. (1979). Quality is Free: The Art of Making Quality Certain. New York: McGraw-Hill. [7] Shingo, S. (1986). Zero Quality Control: Source Inspection and the Poka-Yoke System. Cambridge, MA: Productivity Press. [8] Nakajima, S. (1988). Introduction to TPM: Total Productive Maintenance. Cambridge, MA: Productivity Press. [9] Womack, J. P., & Jones, D. T. (2003). Lean Thinking: Banish Waste and Create Wealth in Your Corporation (2nd ed.). New York: Free Press. [10] Ministry of Micro, Small and Medium Enterprises, Government of India. (2024). Annual Report 2023–24. New Delhi: MSME Publications. Retrieved from https://msme.gov.in/annual-report [11] Confederation of Indian Industry (CII). (2023). India Manufacturing Competitiveness Report 2023: Pathways to Global Integration. New Delhi: CII National Headquarters. [12] Juran, J. M., & Godfrey, A. B. (Eds.). (1998). Juran's Quality Handbook (5th ed.). New York: McGraw-Hill. [13] National Import-Export Record for Yearly Analysis of Trade https://niryat.gov.in/
  22. About D&V Business Consulting D&V Business Consulting is a leading

    business consulting firm, dedicated to helping MSMEs unlock their full potential and achieve sustainable growth. With the industry experts in team, we offer tailored solutions across the four main domains of the business - Operations, Sales and marketing, Human Resources and Finance Consulting. We streamline the operations in order to improve efficiency, build strong organizational structure, create effective sales strategies and design structured marketing and distribution framework. Our digital solutions enable to scale business with the data-driven approach. By resolving key problems like cost control, workforce alignment, productivity, quality control and revenue consistency, we deliver practical, result- oriented consulting, helping businesses grow with clarity, planning and confidence.