See how Goldman Sachs leverages Elasticsearch to solve business problems and manages Elasticsearch usages centrally. Deep dive into a business use case that tracks trade flow across multiple systems in real time.
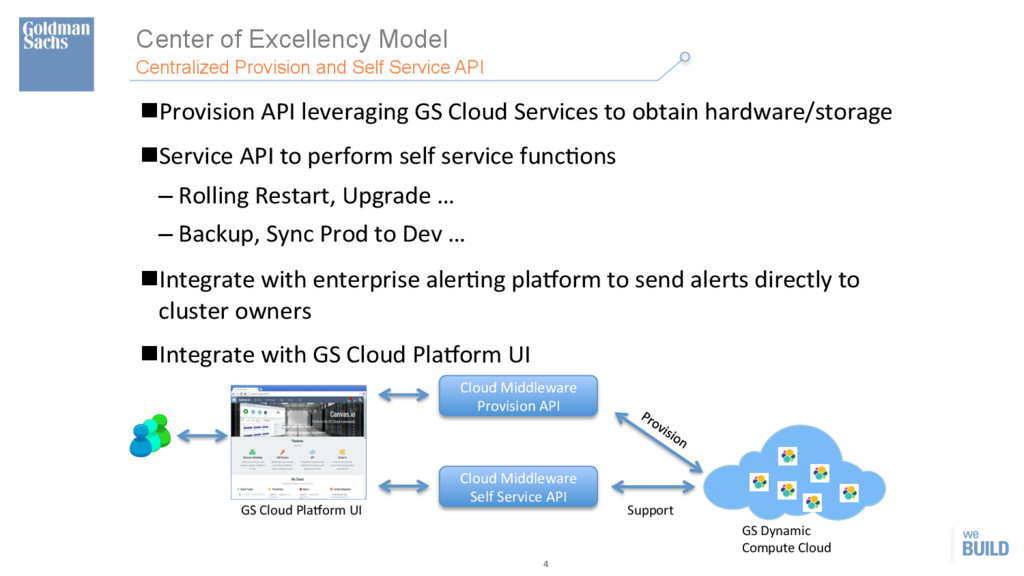
Service API n Provision API leveraging GS Cloud Services to obtain hardware/storage n Service API to perform self service funcHons – Rolling Restart, Upgrade … – Backup, Sync Prod to Dev … n Integrate with enterprise alerHng plaXorm to send alerts directly to cluster owners n Integrate with GS Cloud PlaXorm UI GS Cloud PlaXorm UI GS Dynamic Compute Cloud Cloud Middleware Provision API Cloud Middleware Self Service API Support
n Centralized monitoring and metrics n Governance on proper usages n ElasHc Vendor Support – Global support – Design review – Performance tuning – Patching
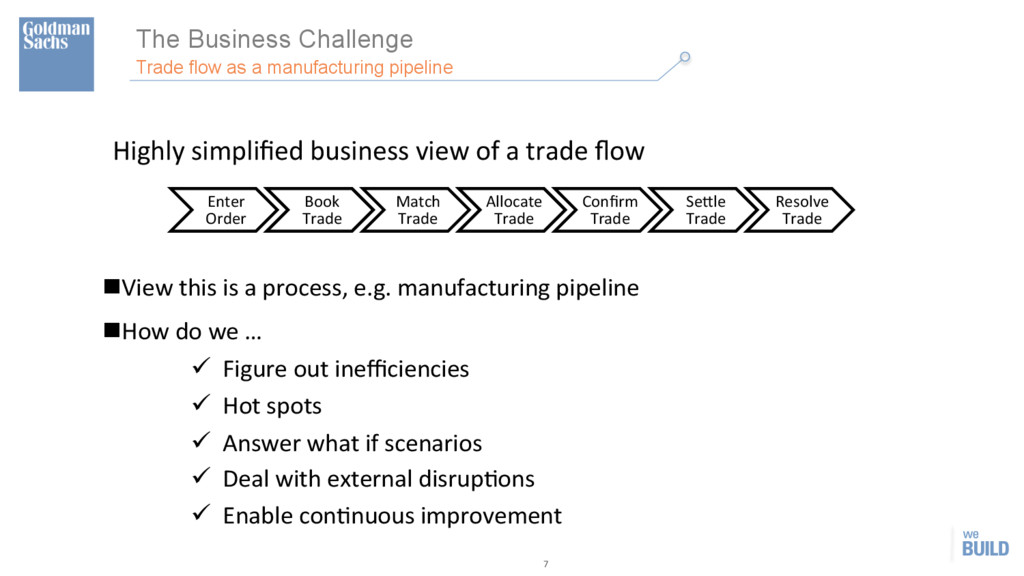
pipeline Highly simplified business view of a trade flow Enter Order Book Trade Match Trade Allocate Trade Confirm Trade Se]le Trade Resolve Trade n View this is a process, e.g. manufacturing pipeline n How do we … ü Figure out inefficiencies ü Hot spots ü Answer what if scenarios ü Deal with external disrupHons ü Enable conHnuous improvement
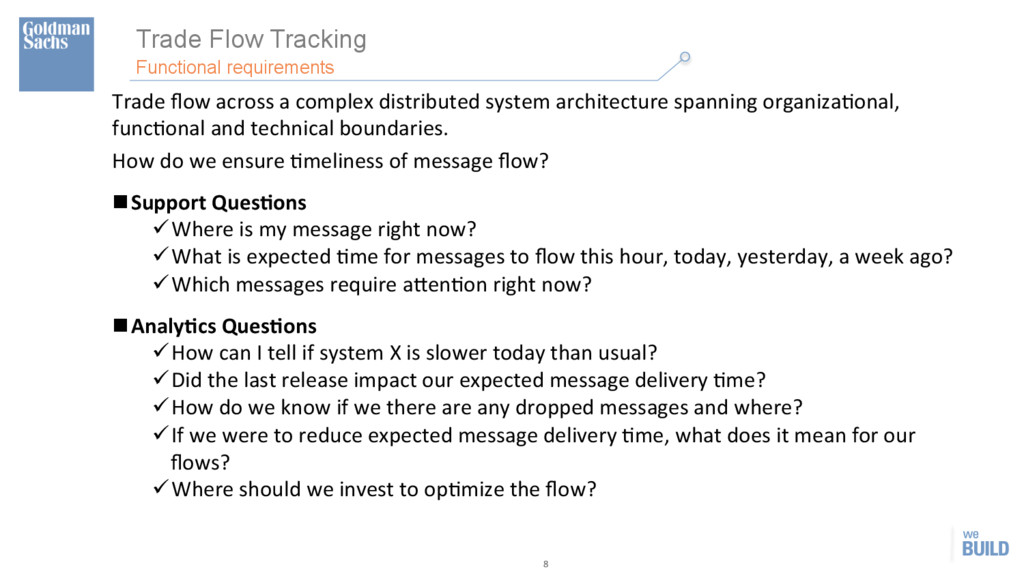
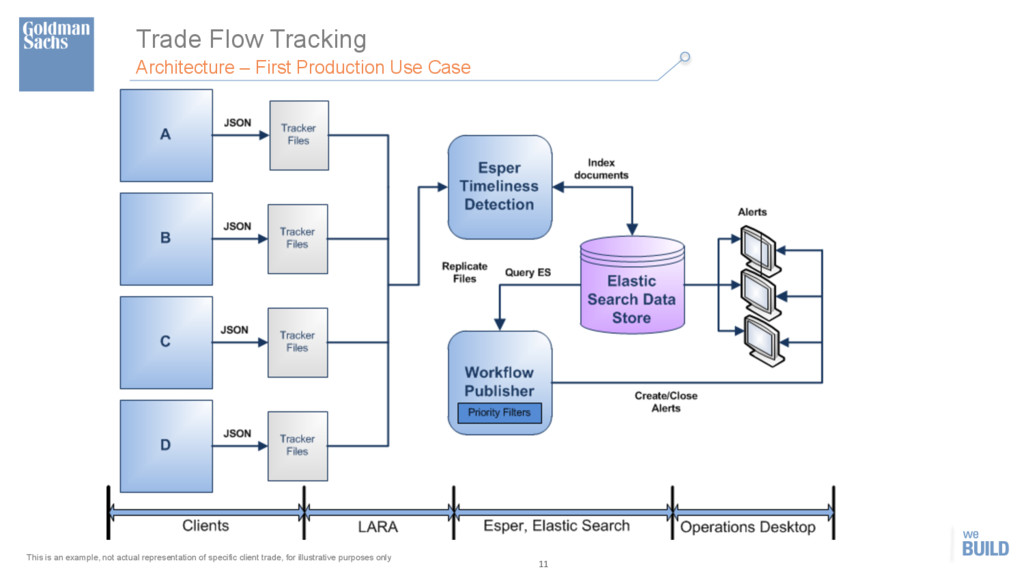
a complex distributed system architecture spanning organizaHonal, funcHonal and technical boundaries. How do we ensure Hmeliness of message flow? n Support Ques7ons ü Where is my message right now? ü What is expected Hme for messages to flow this hour, today, yesterday, a week ago? ü Which messages require a]enHon right now? n Analy7cs Ques7ons ü How can I tell if system X is slower today than usual? ü Did the last release impact our expected message delivery Hme? ü How do we know if we there are any dropped messages and where? ü If we were to reduce expected message delivery Hme, what does it mean for our flows? ü Where should we invest to opHmize the flow?
ü Ability to track trade messages across a distributed system stack in real Hme ü Real-‐Hme monitoring between systems to ensure any flow delays are detected n Advanced Search Capabili7es ü Extensible infrastructure to support searching by variety of a]ributes ü SophisHcated filtering and prioriHzaHon of alerts n Interoperability ü Reasonably low barrier to instrument any exisHng system in the flow (Slang, C++, Java, etc.) n Independent control ü Not on the criHcal path of the systems themselves n Customizable ü Allow for flexibility in defining expected Hmeliness criteria depending on type of trade messages
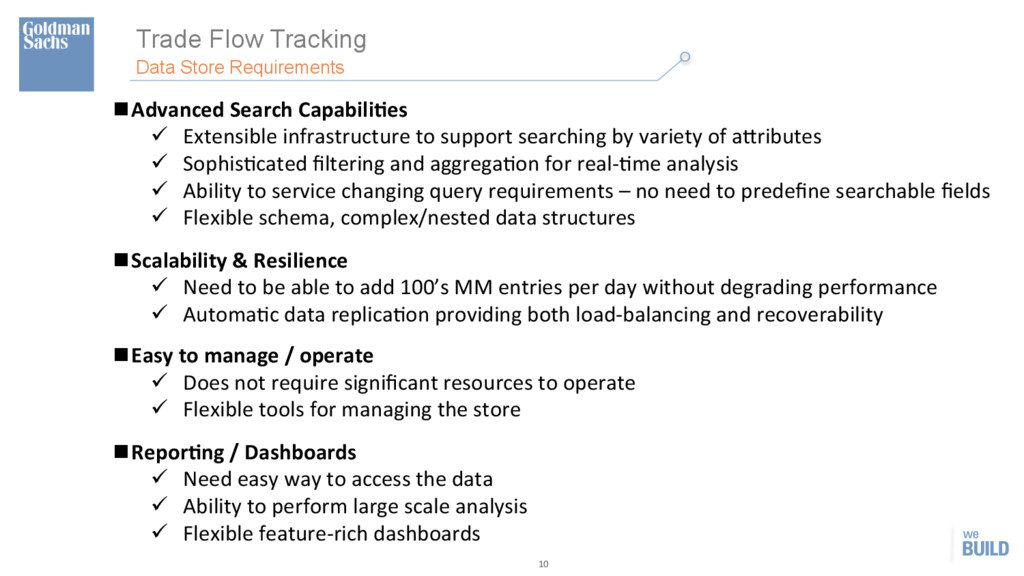
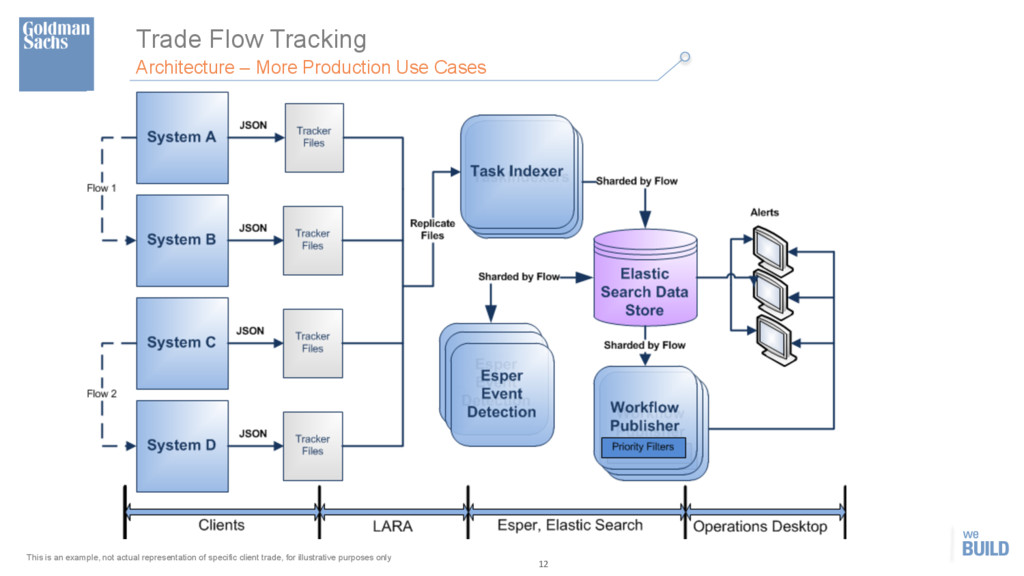
Capabili7es ü Extensible infrastructure to support searching by variety of a]ributes ü SophisHcated filtering and aggregaHon for real-‐Hme analysis ü Ability to service changing query requirements – no need to predefine searchable fields ü Flexible schema, complex/nested data structures n Scalability & Resilience ü Need to be able to add 100’s MM entries per day without degrading performance ü AutomaHc data replicaHon providing both load-‐balancing and recoverability n Easy to manage / operate ü Does not require significant resources to operate ü Flexible tools for managing the store n Repor7ng / Dashboards ü Need easy way to access the data ü Ability to perform large scale analysis ü Flexible feature-‐rich dashboards
LARA Apache Kafka KafkaCons 1 KafkaCons 2 KafkaCons 3 KafkaCons N Elasticsearch Clients – Flow 1 ·∙ Clients produce log files using Trade Tracker API. ·∙ Clients host LARA v2 replicator agents to push the log files to Kafka. ·∙ Client log messages contain a single unique flow identifier per message. ·∙ Hosted Kafka transport layer for file movement. ·∙ All flows move through this layer. ·∙ Consumers shard messages by flow identifier, bulk index into Elasticsearch and send batches to flow specific Data Providers. ·∙ Data Providers are sharded by flow. Implemented as Redis queues. ·∙ The Data Providers act as fast flow-‐specific queues for optional CEP. ·∙ Esper engines are sharded by flow.. ·∙ The Esper state is maintained in Redis. ·∙ They register alert conditions into the ES store. ·∙ The alerters are sharded by flow. ·∙ They consume alert conditions from the ES data store and process them as required. Client N TT API Recovery Info Flow specific Queues & State Redis Flow 1 Alerter Flow 2 Alerter Flow N Alerter Web Services ·∙ Lightweight web service layer allows controlled ES queries. Fabric Workflow Services ·∙ Alerters can publish to a variety of firm infrastructures such as WFS & Fabric. ·∙ Kibana dashboards for analytics on real-‐time data. Clients – Flow N Client 1 TT API Client N TT API Client 1 TT API Flow 1 Esper Flow 2 Esper Flow N Esper DA Notifications 10 flows (+5 in pipeline) 512 indices (5136 shards) ~6 billion docs 4 TB primary (8 TB total) 22 nodes (4core, 32G RAM, 2TB) Daily volumes 45 million docs This is an example, not actual representation of specific client trade, for illustrative purposes only