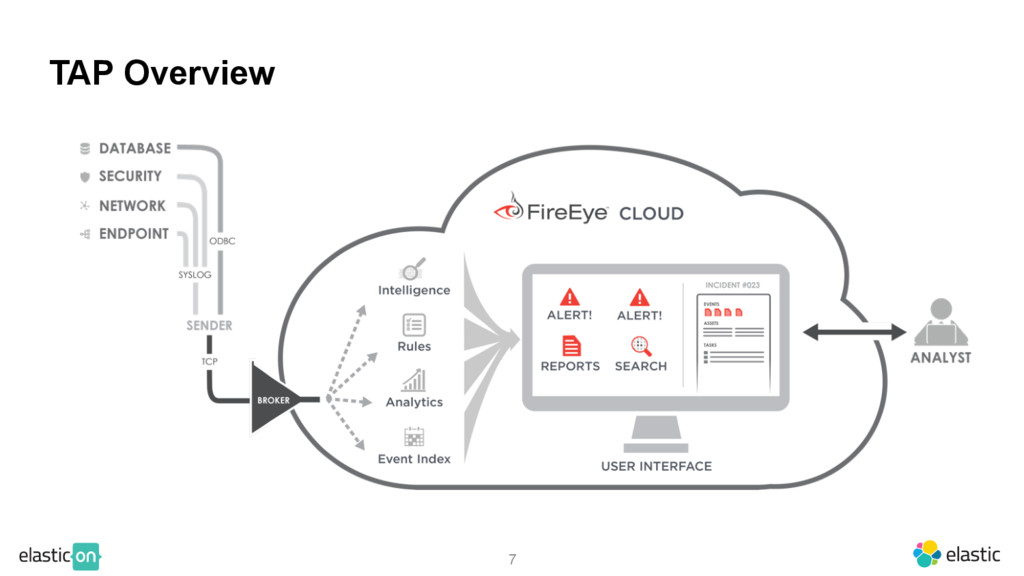
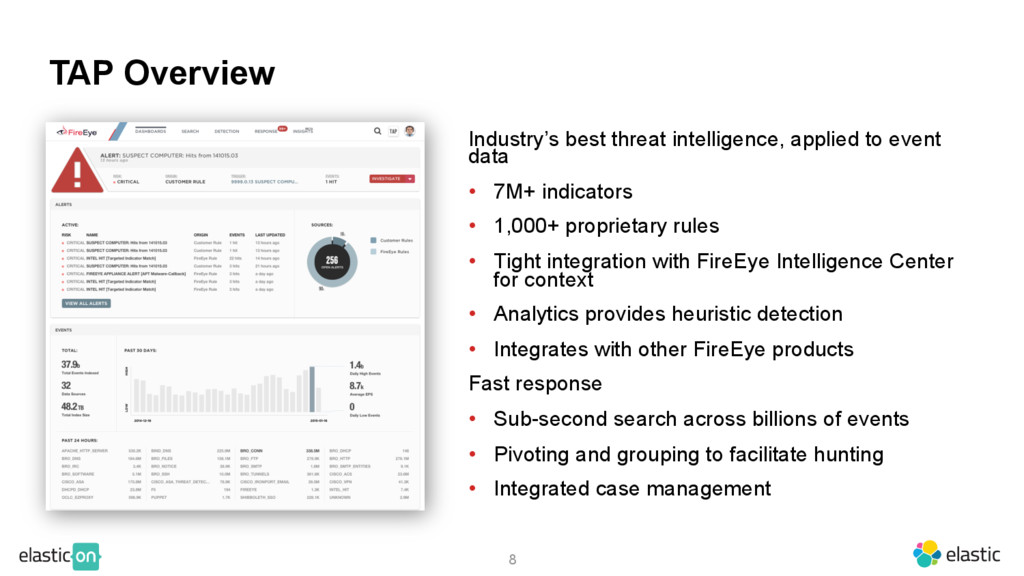
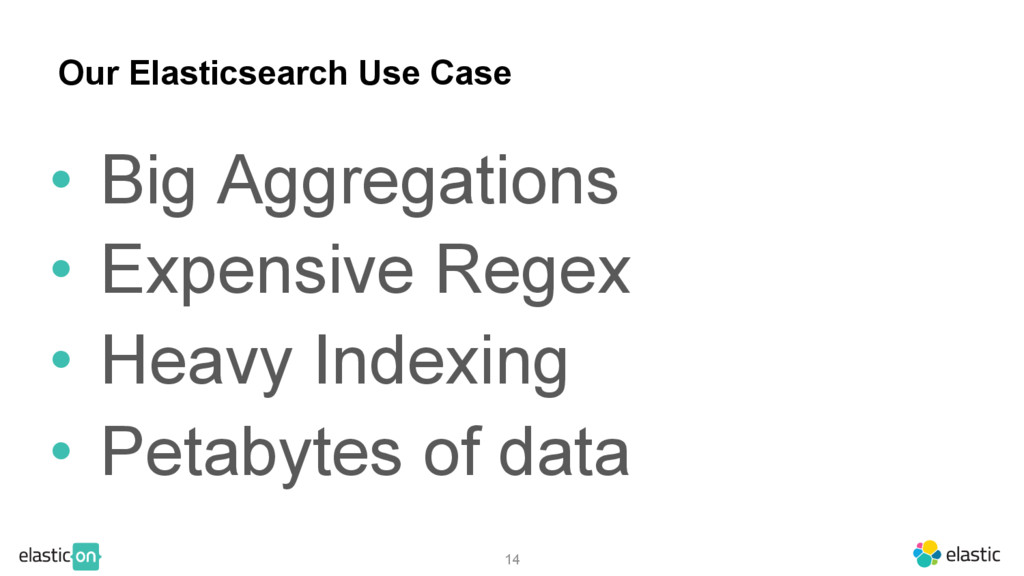
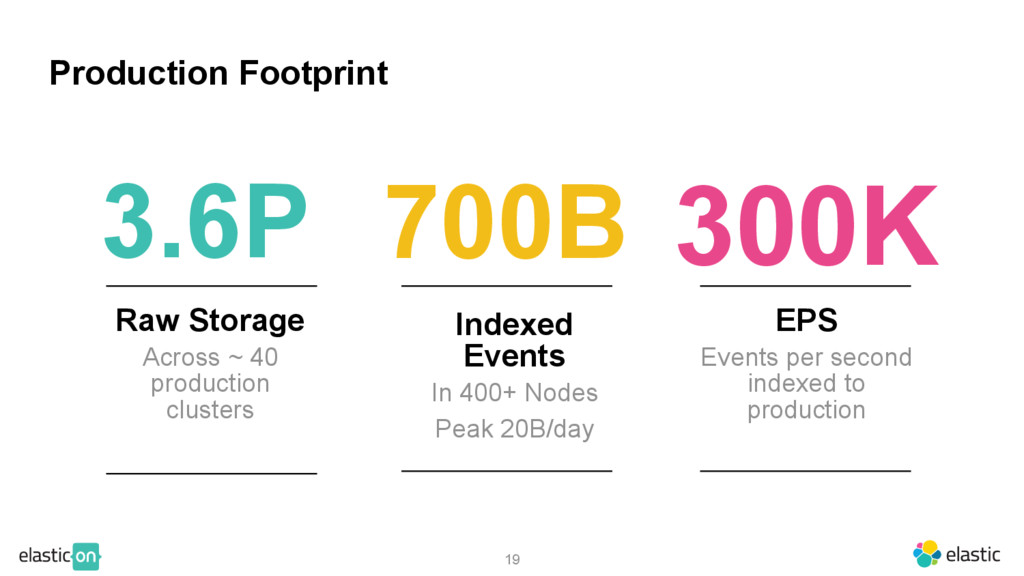
FireEye’s Threat Analytics Platform (TAP) leverages Elasticsearch to index hundreds of thousands of events per second and maintain more than a petabyte of data. Learn what the security hunting use case is and how FireEye built a platform to allow its enterprise customers to find evil in their organizations.
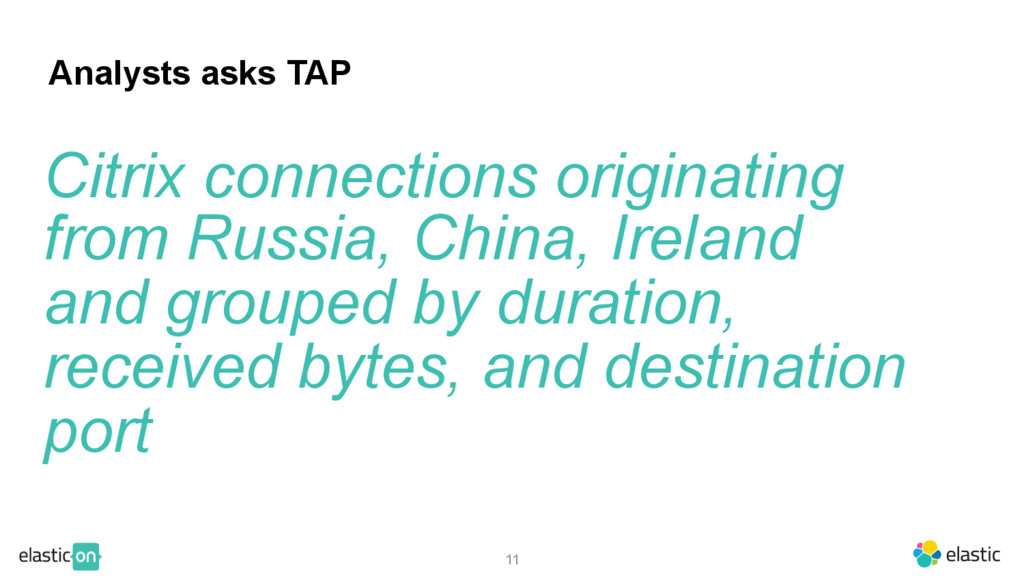
![12 Query Language class:bro_conn dstipv4:$external_citrix_serve rs srccountrycode:[ru,cn,ir] connstate:sf | groupby](https://files.speakerdeck.com/presentations/7dac2cf54c0444fd8ea599b700c10f82/slide_11.jpg)
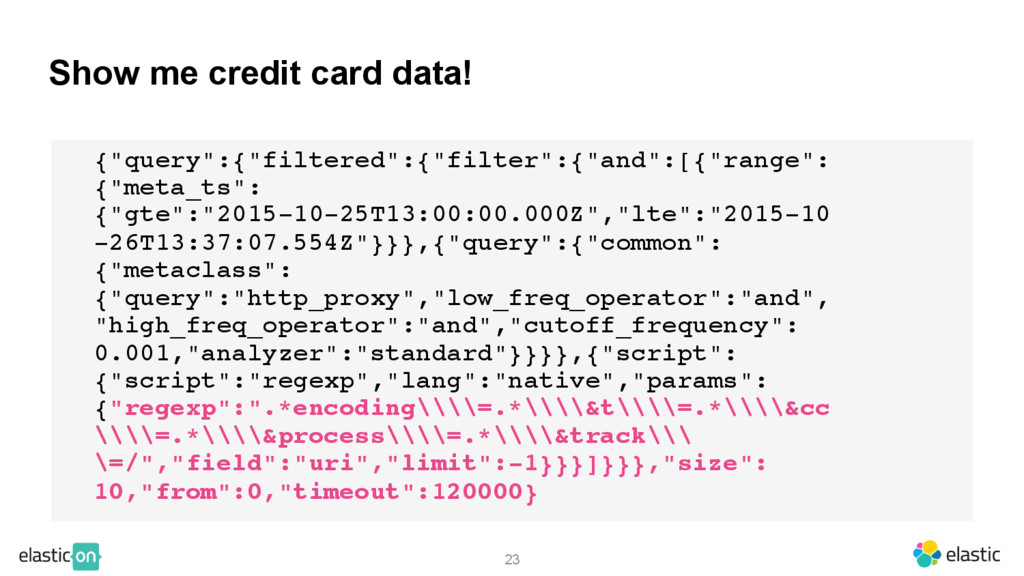
![13 Elasticsearch DSL {"query":{"filtered":{"filter":{"and":[{"range":{"meta_ts": {"gte":"2016-01-26T17:00:00.000Z","lte":"2016-02-02T17:10:20. 478Z"}}},{"term":{"class":"bro_conn"}},{"terms":{"dstipv4": {"index":"lists","type":"indicator","id":"external_citrix_s ervers","path":"values","cache":false}}},{"terms": {"srccountrycode":["ru","cn","ir"],"execution":"or"}}, {"term":{"connstate":"sf"}},{"limit":{"value":](https://files.speakerdeck.com/presentations/7dac2cf54c0444fd8ea599b700c10f82/slide_12.jpg)