When monitoring met alerting, the average time spent to troubleshoot went down and the average sleep time went up. True story.
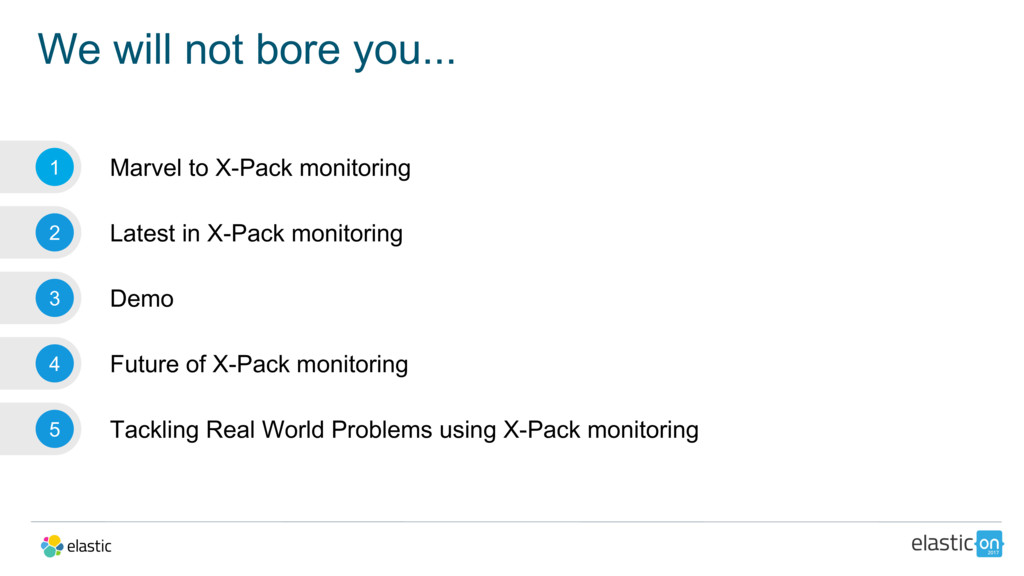
X-Pack, which made its first debut with the 5.0 release of the Elastic Stack, brings monitoring and alerting features together to enable built-in cluster alerts. Chris and Bohyun will go over the latest in monitoring and management in the first portion of the talk, then Antonio will talk about how to solve real-world problems using monitoring data based on customer scenarios he's helped with as part of the Elastic support team.
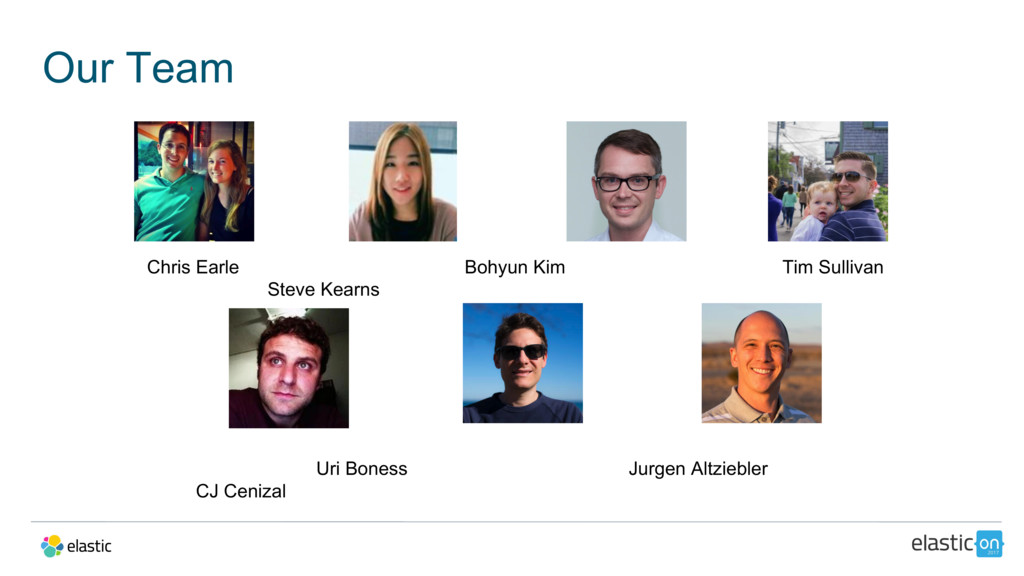
Antonio Bonuccelli l Support Engineer l Elastic
Chris Earle l Monitoring Lead l Elastic
Bohyun Kim l Senior Product Manager l Elastic
![filter { if [type] == "my_monitored_type" { metrics { meter](https://files.speakerdeck.com/presentations/1c5fc0bc266e4ca284c8382df044bdb6/slide_37.jpg)
![output { if "metric" in [tags] { stdout { codec](https://files.speakerdeck.com/presentations/1c5fc0bc266e4ca284c8382df044bdb6/slide_38.jpg)
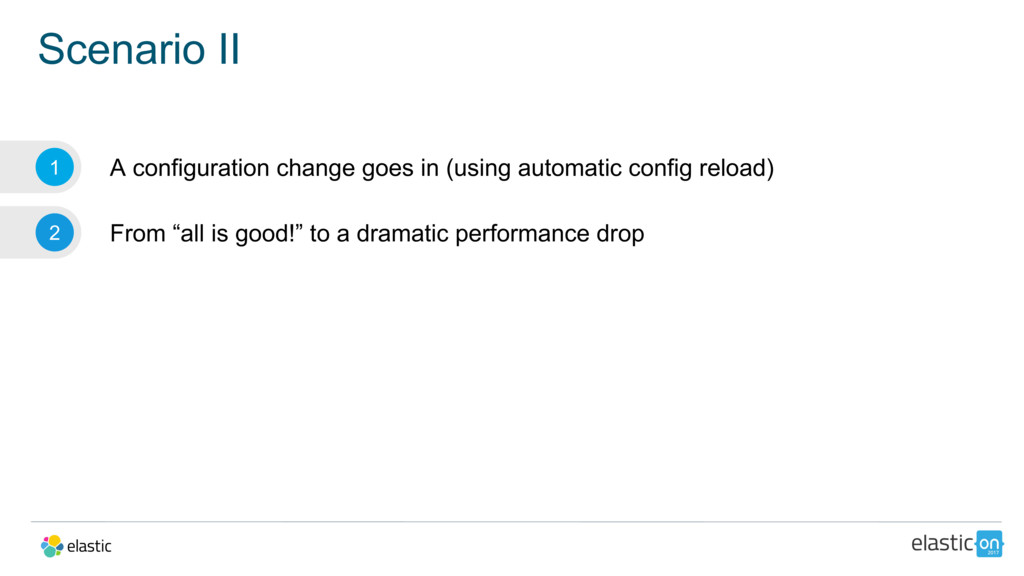
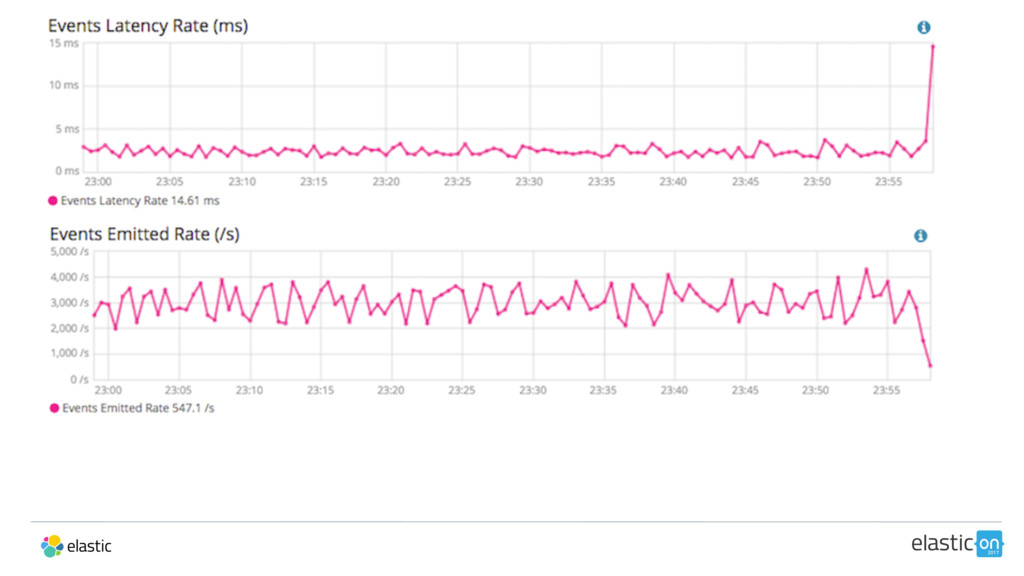
![[2017-02-28T23:58:13,479][WARN ][logstash.agent] fetched new config for pipeline. upgrading.. Scenario II](https://files.speakerdeck.com/presentations/1c5fc0bc266e4ca284c8382df044bdb6/slide_51.jpg)
![[2017-02-28T23:58:13,479][WARN ][logstash.agent] fetched new config for pipeline. upgrading.. Scenario II](https://files.speakerdeck.com/presentations/1c5fc0bc266e4ca284c8382df044bdb6/slide_52.jpg)