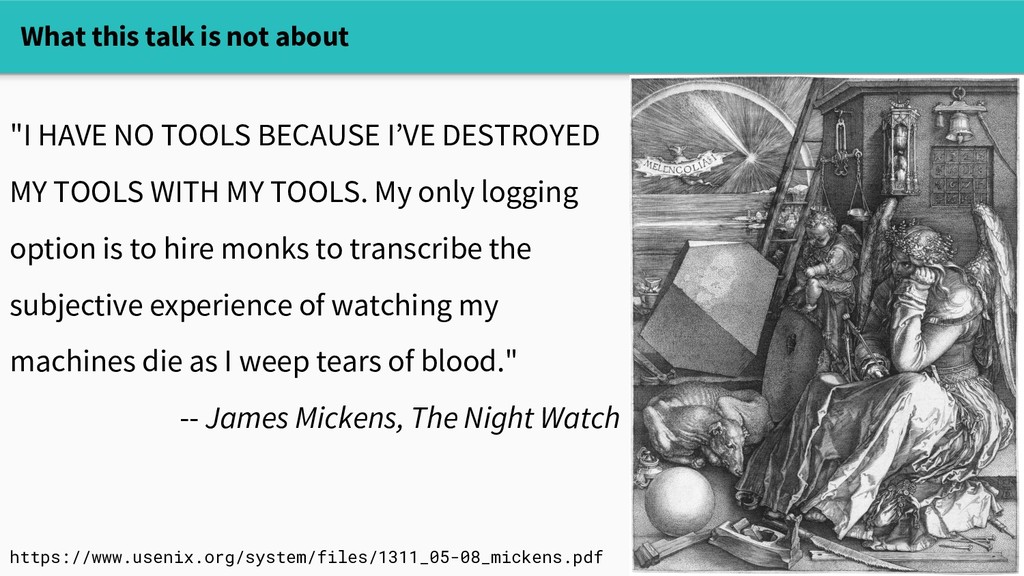
BECAUSE I’VE DESTROYED MY TOOLS WITH MY TOOLS. My only logging option is to hire monks to transcribe the subjective experience of watching my machines die as I weep tears of blood." -- James Mickens, The Night Watch https://www.usenix.org/system/files/1311_05-08_mickens.pdf
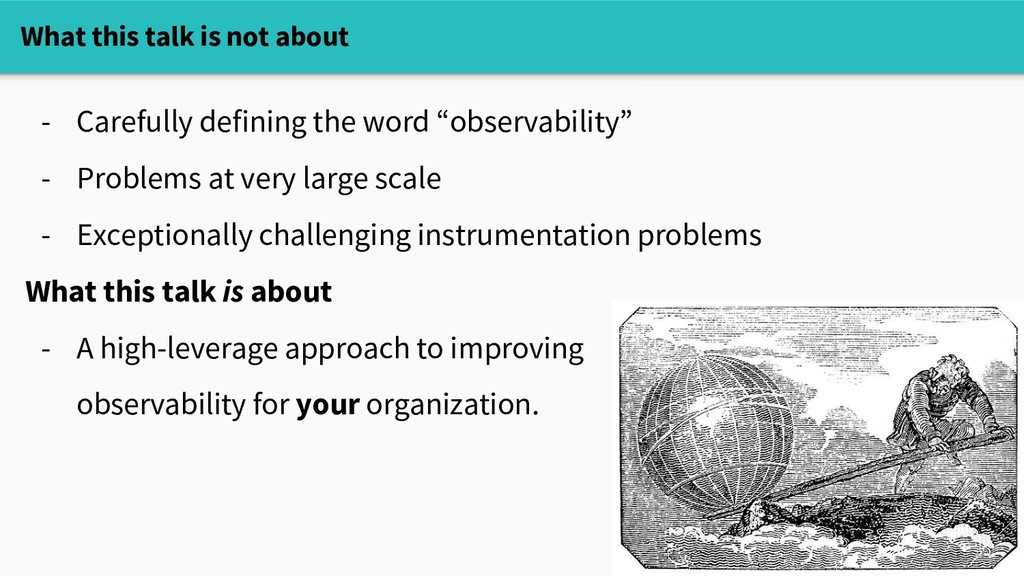
word “observability” - Problems at very large scale - Exceptionally challenging instrumentation problems What this talk is about - A high-leverage approach to improving observability for your organization.
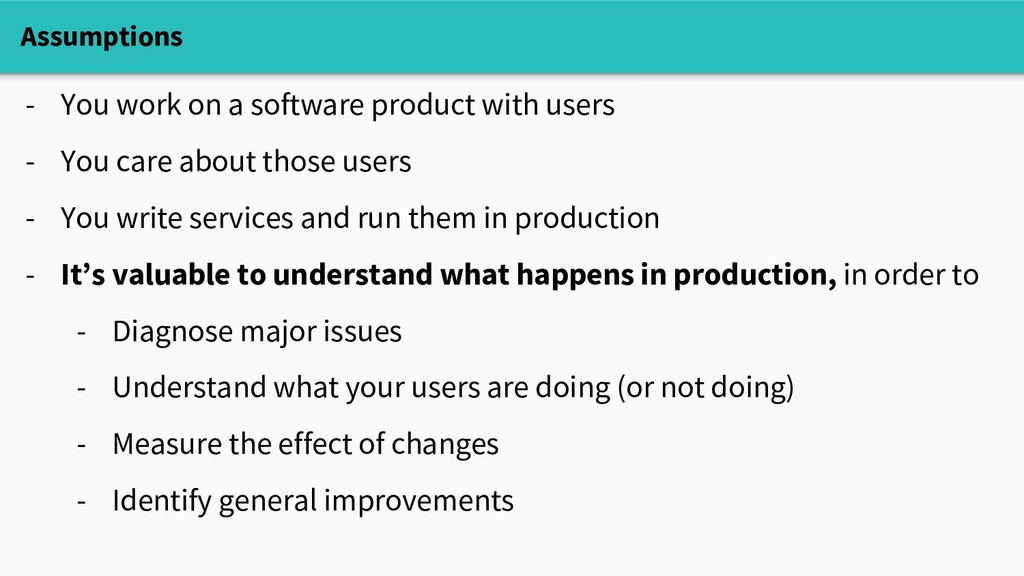
- You care about those users - You write services and run them in production - It’s valuable to understand what happens in production, in order to - Diagnose major issues - Understand what your users are doing (or not doing) - Measure the effect of changes - Identify general improvements
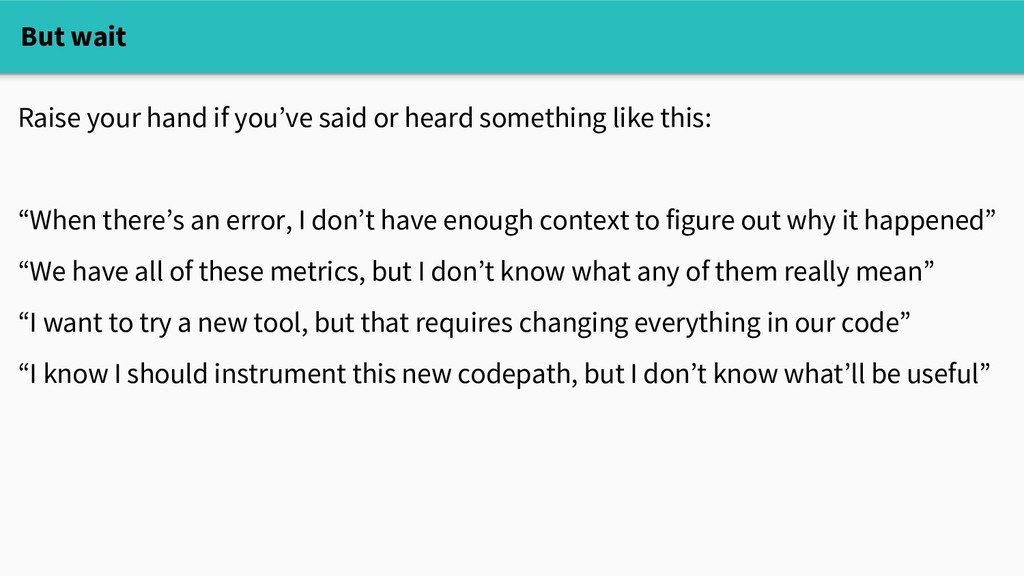
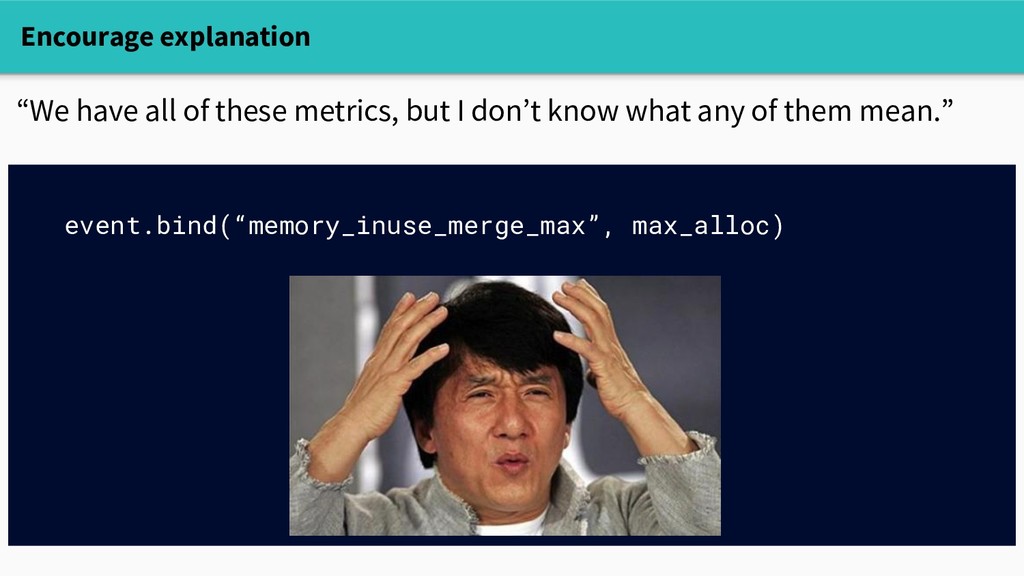
something like this: “When there’s an error, I don’t have enough context to figure out why it happened” “We have all of these metrics, but I don’t know what any of them really mean” “I want to try a new tool, but that requires changing everything in our code” “I know I should instrument this new codepath, but I don’t know what’ll be useful”
something like this: “When there’s an error, I don’t have enough context to figure out why it happened” “We have all of these metrics, but I don’t know what any of them really mean” “I want to try a new tool, but that requires changing everything in our code” “I know I should instrument this new codepath, but I don’t know what’ll be useful” These are essentially cultural problems, not intrinsically hard problems in computer science.
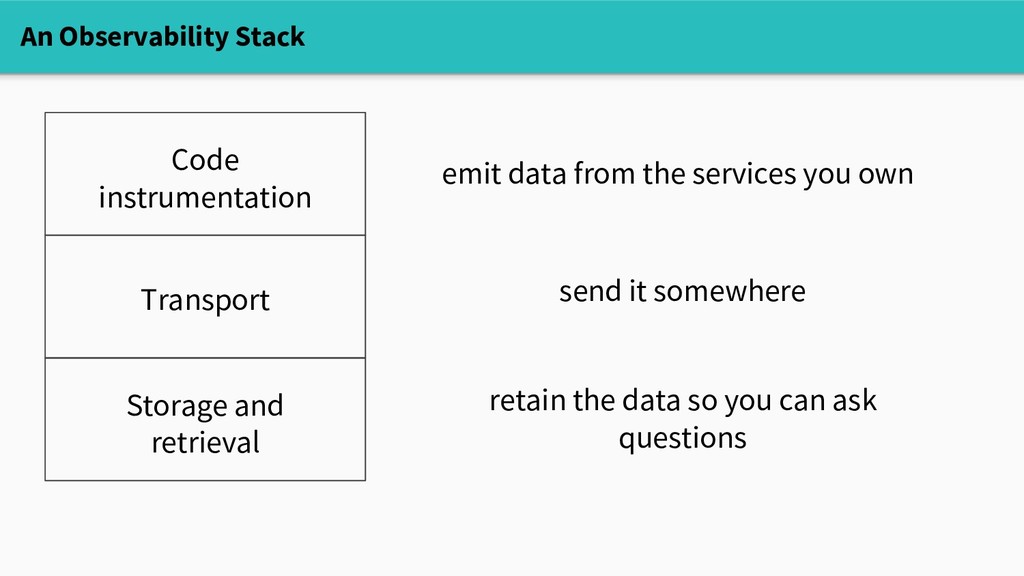
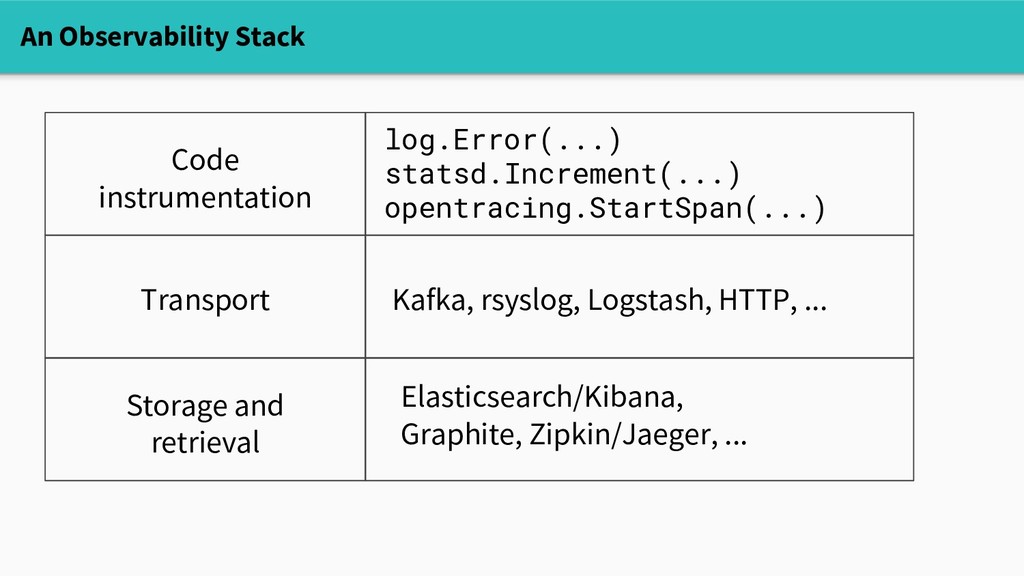
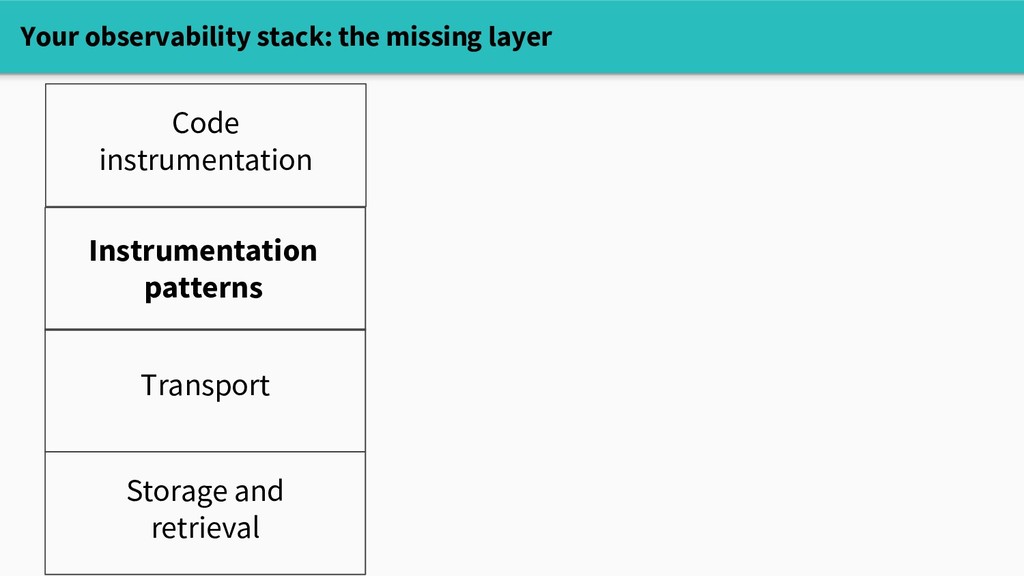
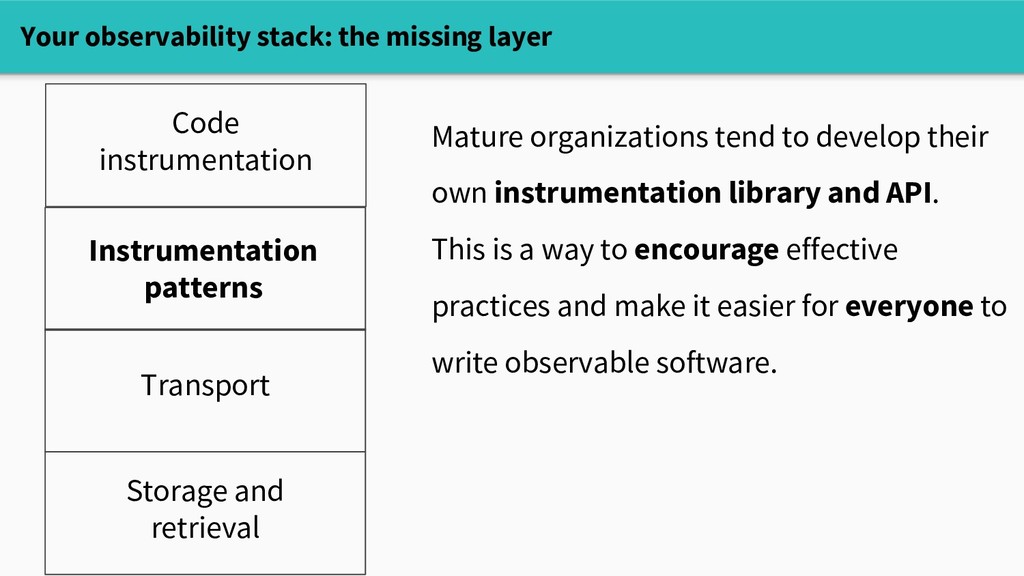
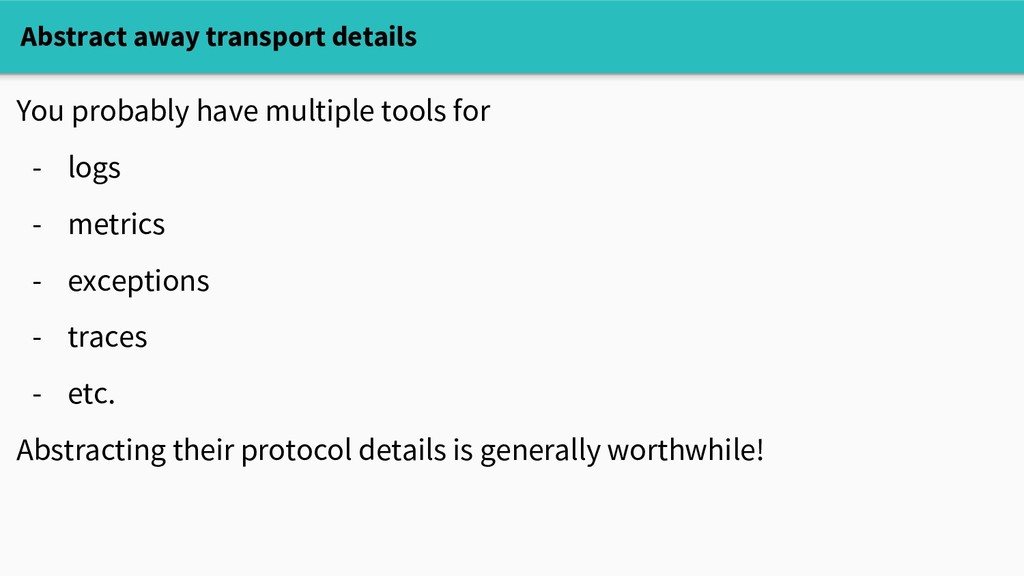
API. This is a way to encourage effective practices and make it easier for everyone to write observable software. Your observability stack: the missing layer Code instrumentation Transport Storage and retrieval Instrumentation patterns
others to follow - Ensure that instrumentation captures the right context - Make it easier to evolve your observability over time. Your observability stack: the missing layer
To a point! - It's generally easier to adopt and evolve an internal API - The authors of these projects may not have perfectly anticipated your needs - Wrapping / adapting existing frameworks is arguably most effective! Hang on opentracing.io opencensus.io github.com/stripe/veneur
but you do have your own schema - write your own HTTP router -- but you do have your own handlers - write your own Javascript framework -- but you do have your own UI components. What you build on top of foundations embodies what matters to you: - Your data model, your service, your visual style This work deserves thought and attention Some elements of your system are necessarily bespoke
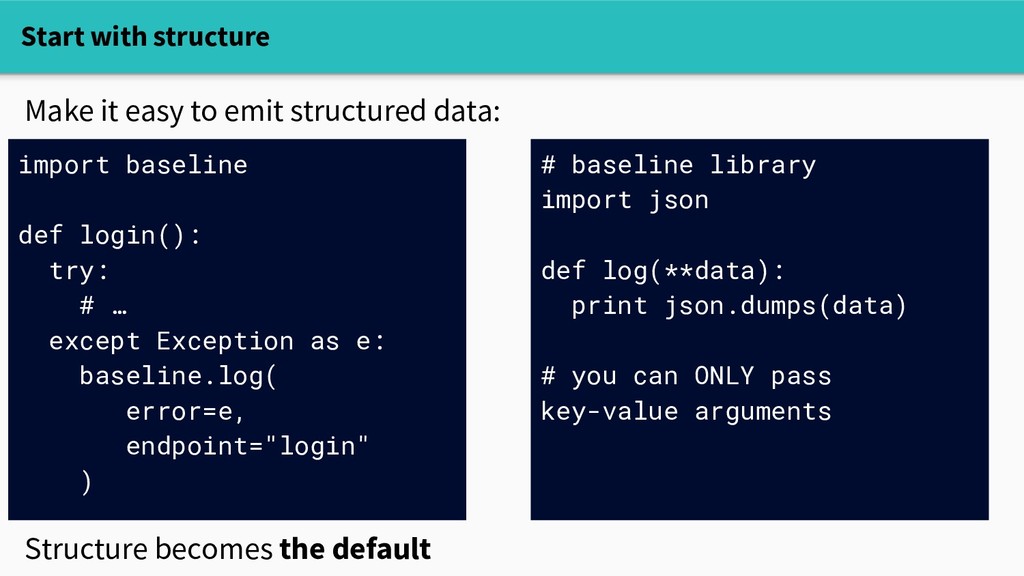
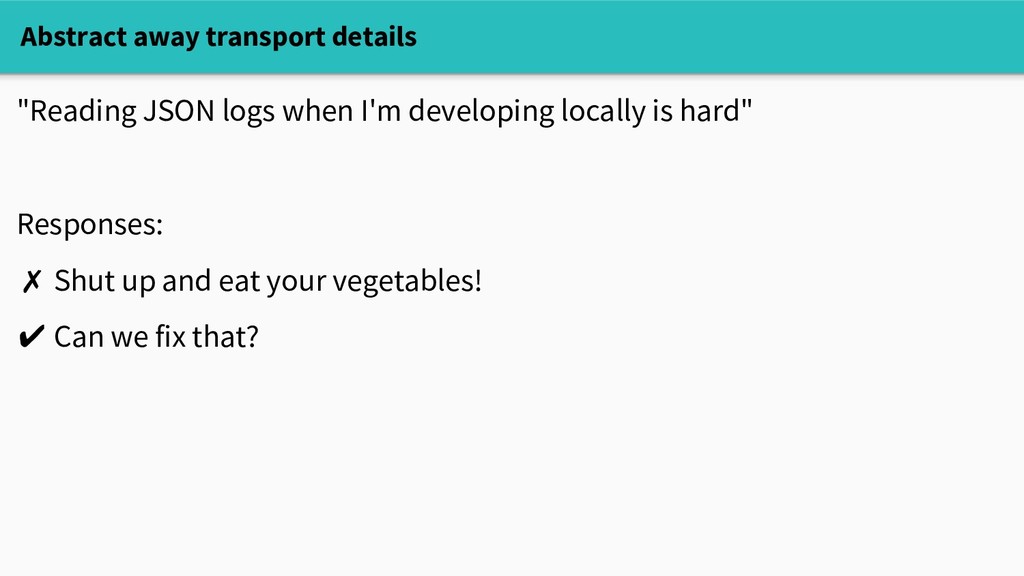
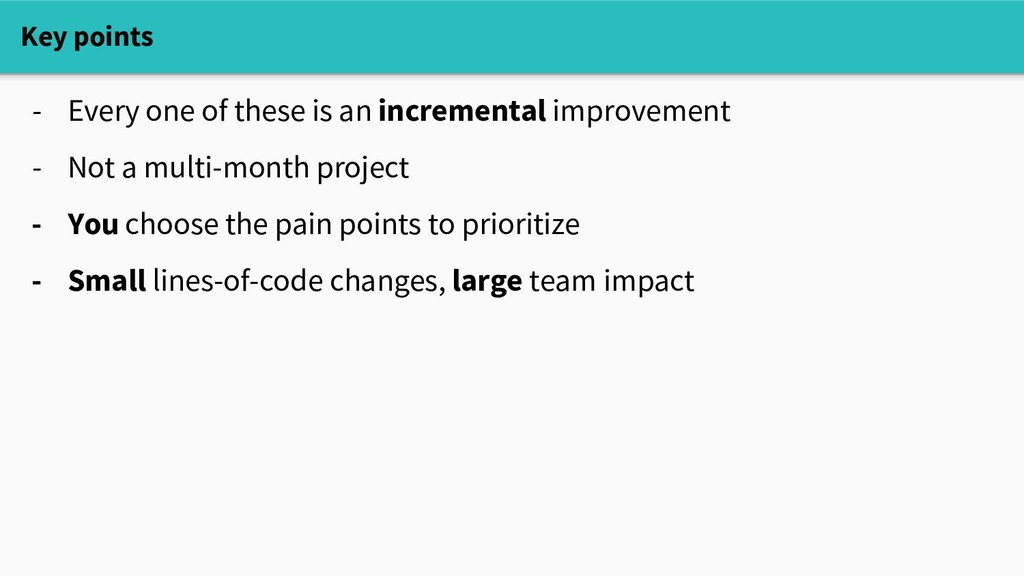
with structure - Add context - Encourage explanation - Abstract transport - Embrace pragmatism Five examples of ways to help your team < 10 lines of code each Instrumentation Patterns
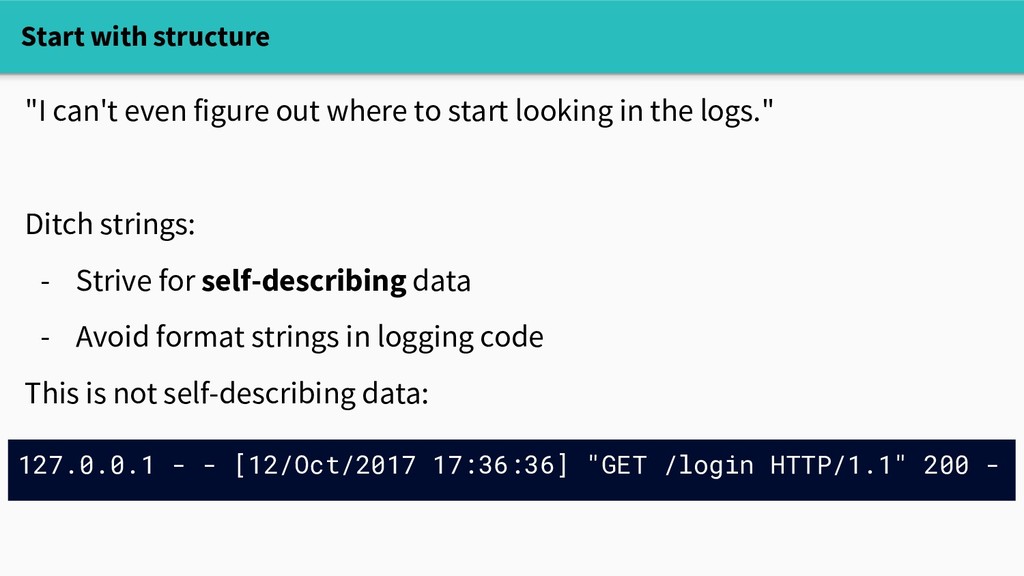
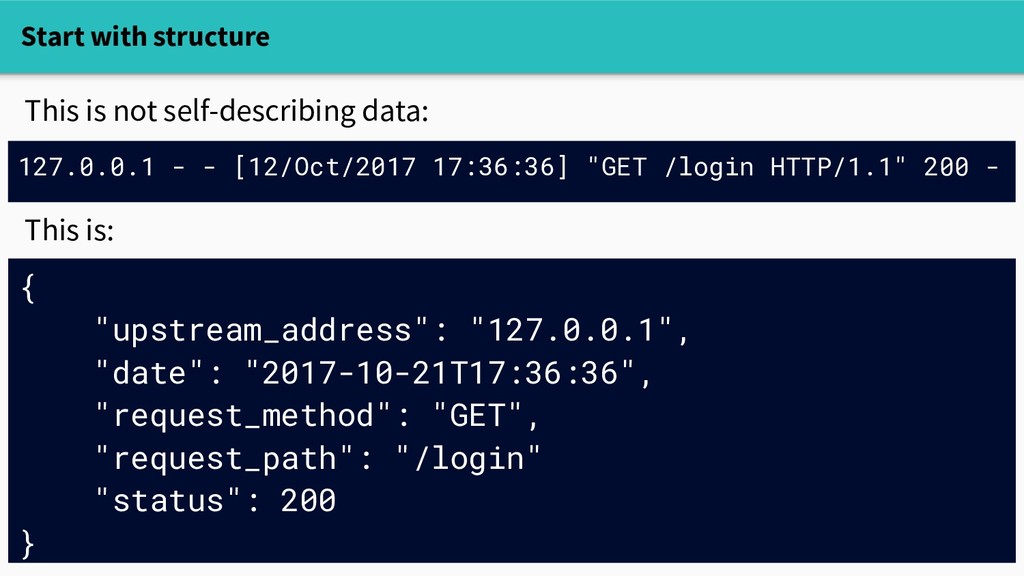
start looking in the logs." Ditch strings: - Strive for self-describing data - Avoid format strings in logging code This is not self-describing data: 127.0.0.1 - - [12/Oct/2017 17:36:36] "GET /login HTTP/1.1" 200 -
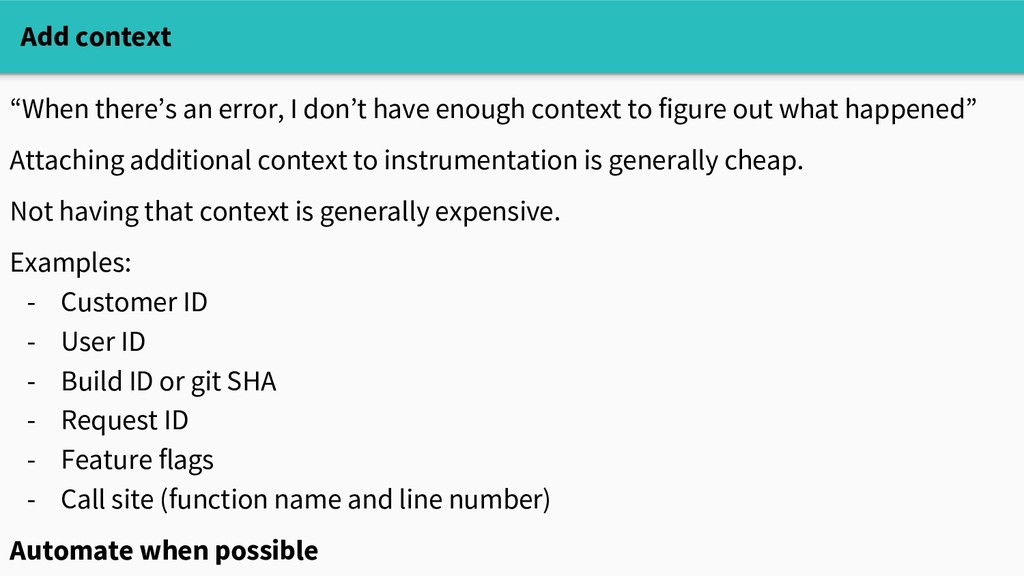
figure out what happened” Attaching additional context to instrumentation is generally cheap. Not having that context is generally expensive. Examples: - Customer ID - User ID - Build ID or git SHA - Request ID - Feature flags - Call site (function name and line number) Automate when possible Add context
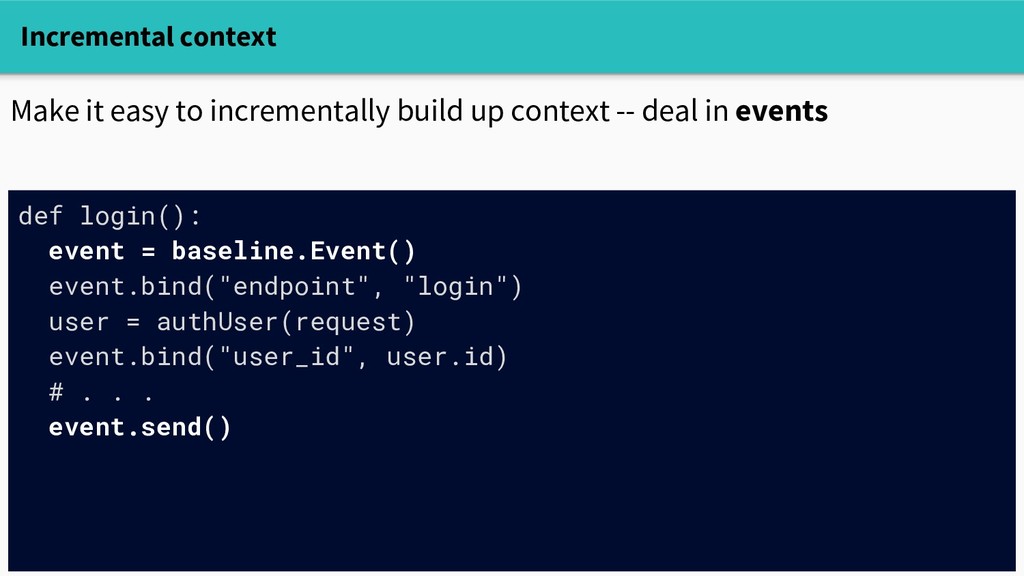
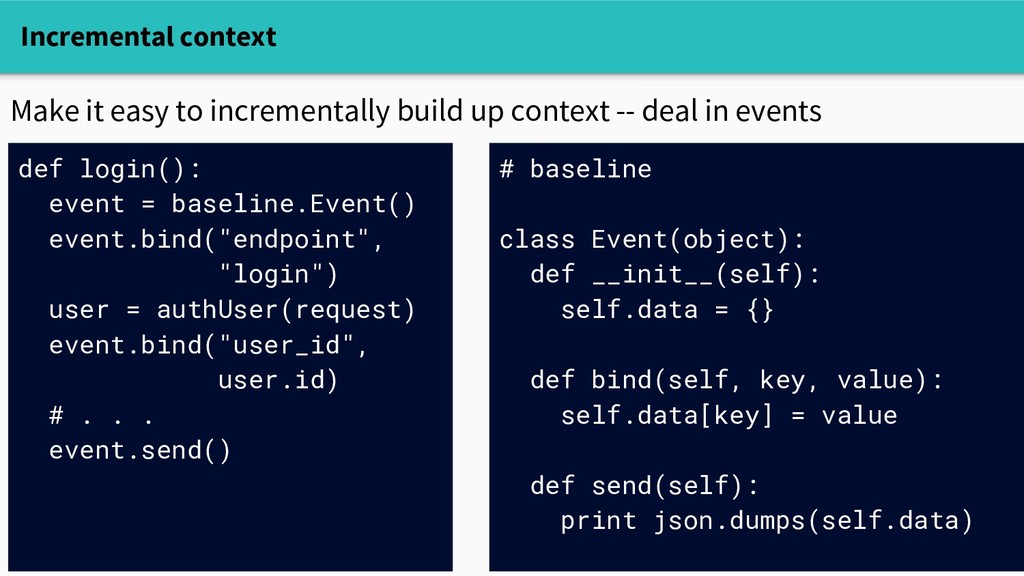
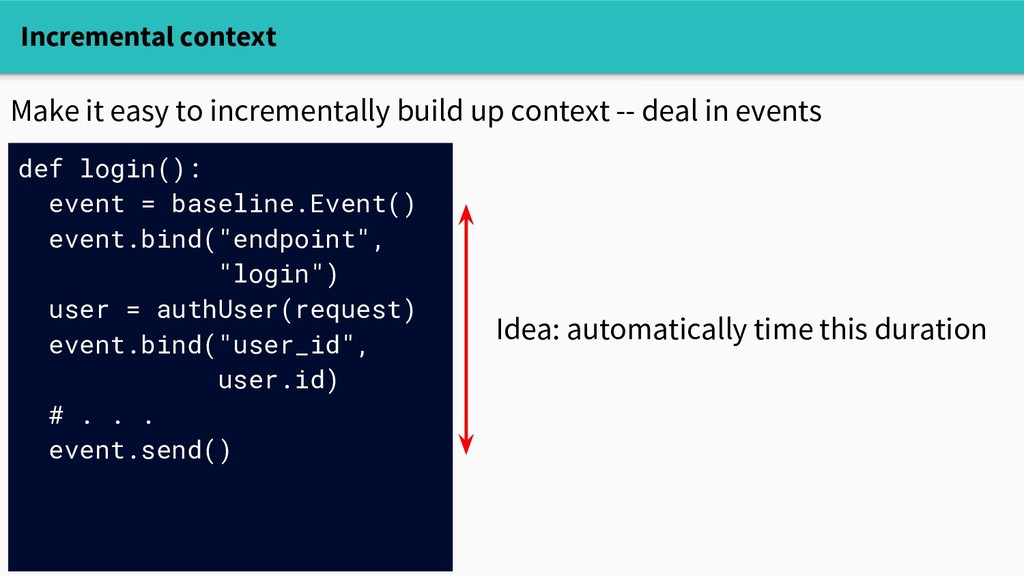
= authUser(request) event.bind("user_id", user.id) # . . . event.send() Make it easy to incrementally build up context -- deal in events Idea: automatically time this duration
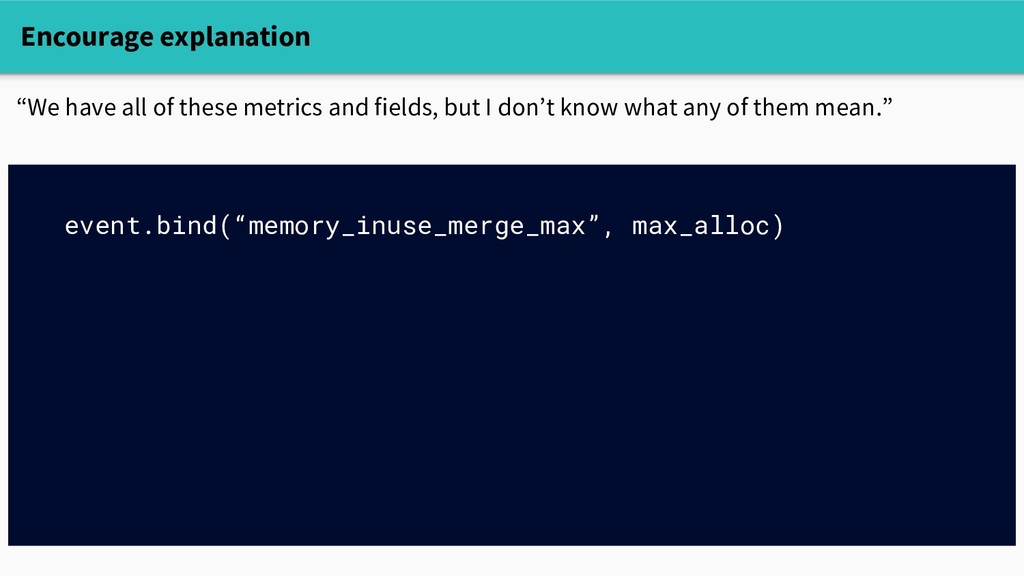
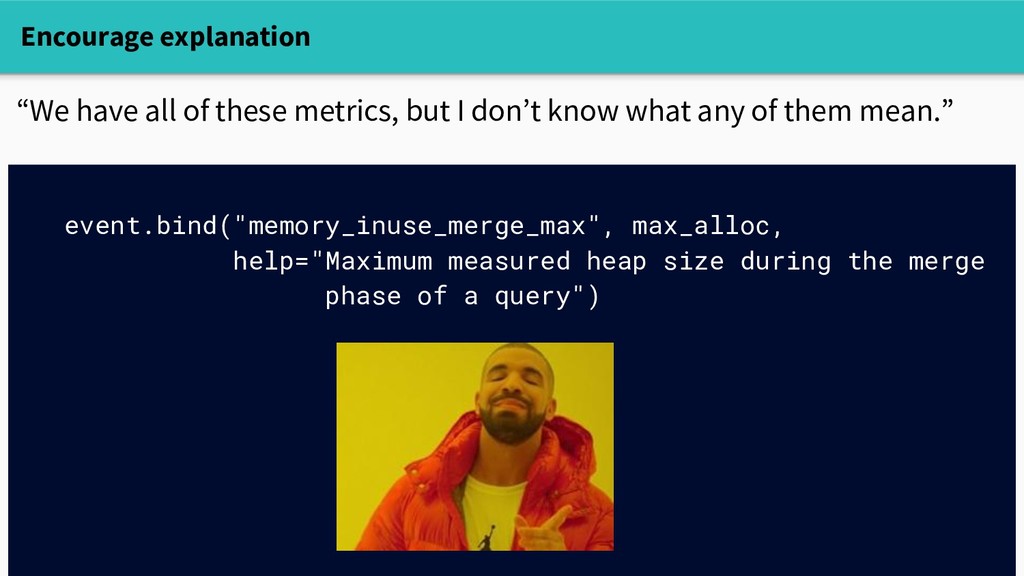
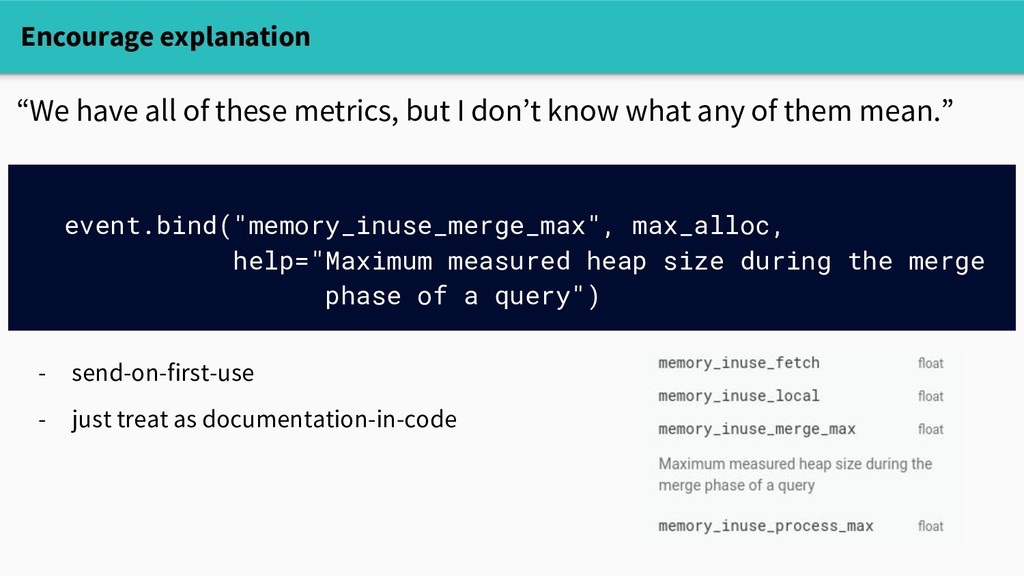
don’t know what any of them mean.” event.bind("memory_inuse_merge_max", max_alloc, help="Maximum measured heap size during the merge phase of a query")
don’t know what any of them mean.” event.bind("memory_inuse_merge_max", max_alloc, help="Maximum measured heap size during the merge phase of a query") - send-on-first-use - just treat as documentation-in-code
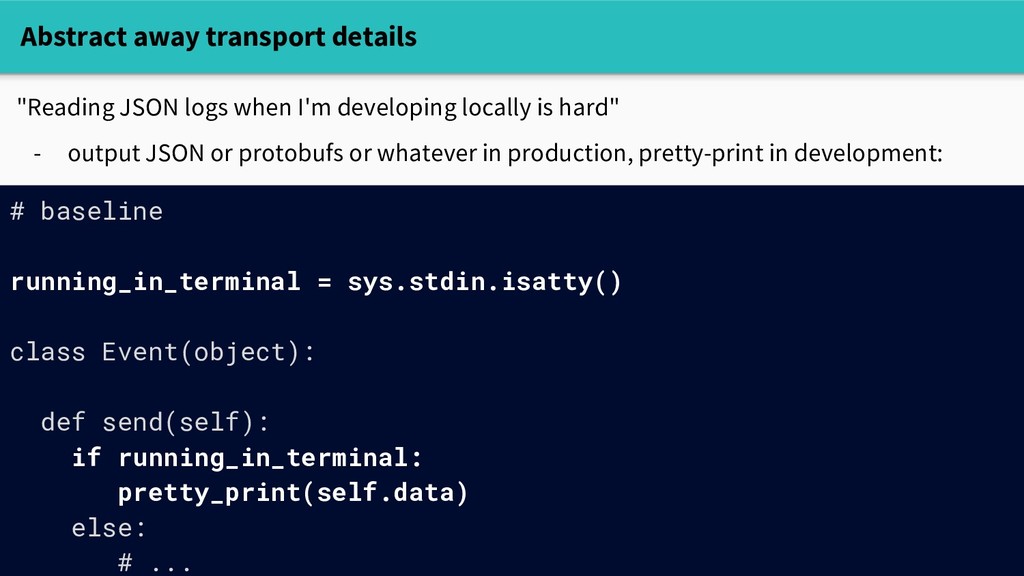
locally is hard" - output JSON or protobufs or whatever in production, pretty-print in development: # baseline running_in_terminal = sys.stdin.isatty() class Event(object): def send(self): if running_in_terminal: pretty_print(self.data) else: # ...
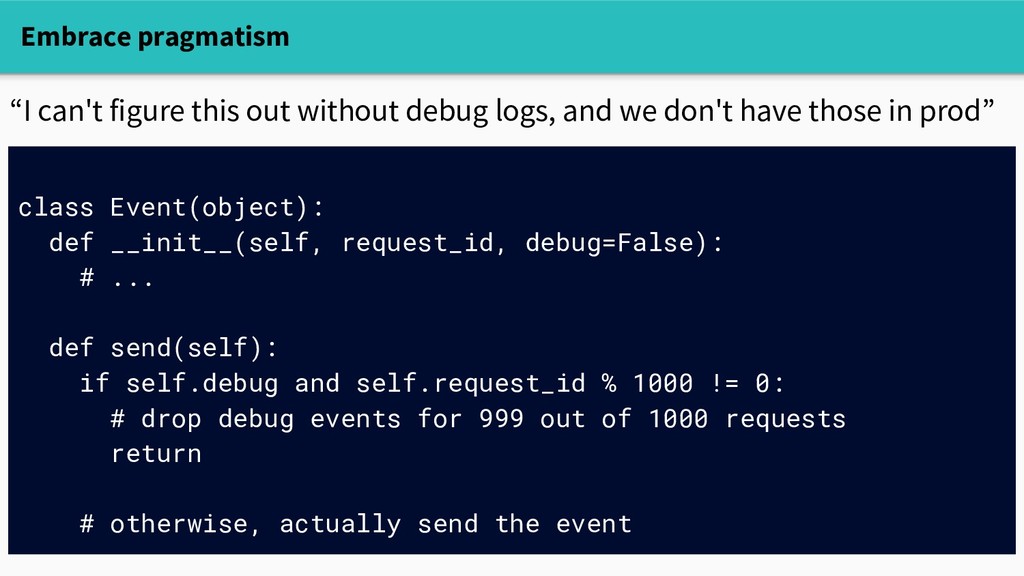
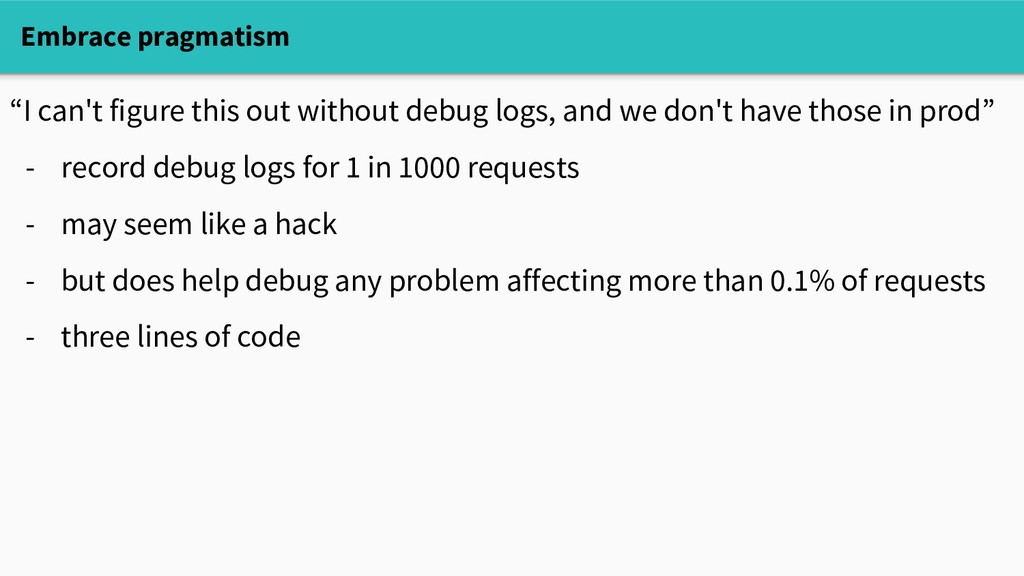
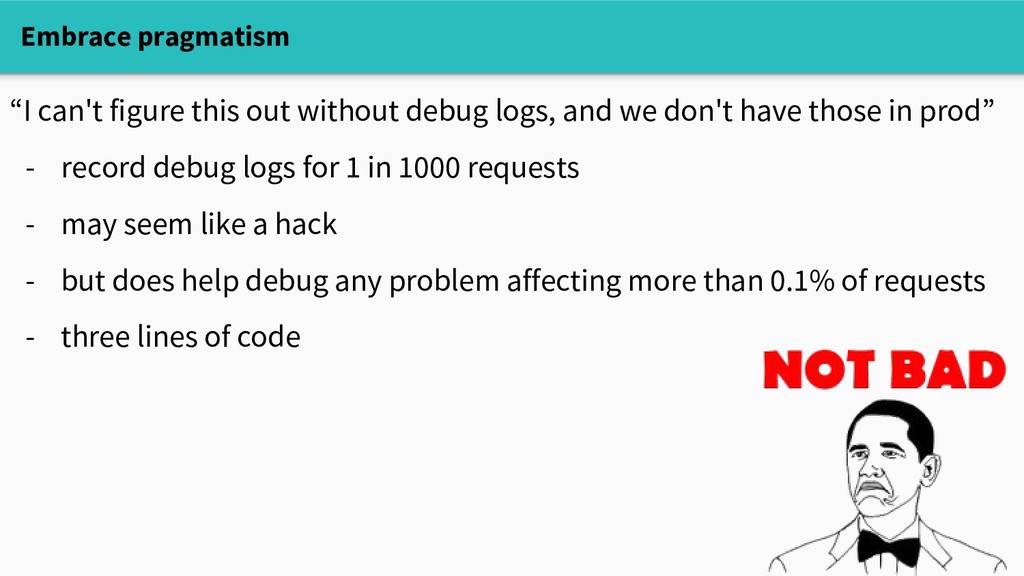
def send(self): if self.debug and self.request_id % 1000 != 0: # drop debug events for 999 out of 1000 requests return # otherwise, actually send the event “I can't figure this out without debug logs, and we don't have those in prod”
and we don't have those in prod” - record debug logs for 1 in 1000 requests - may seem like a hack - but does help debug any problem affecting more than 0.1% of requests - three lines of code
and we don't have those in prod” - record debug logs for 1 in 1000 requests - may seem like a hack - but does help debug any problem affecting more than 0.1% of requests - three lines of code
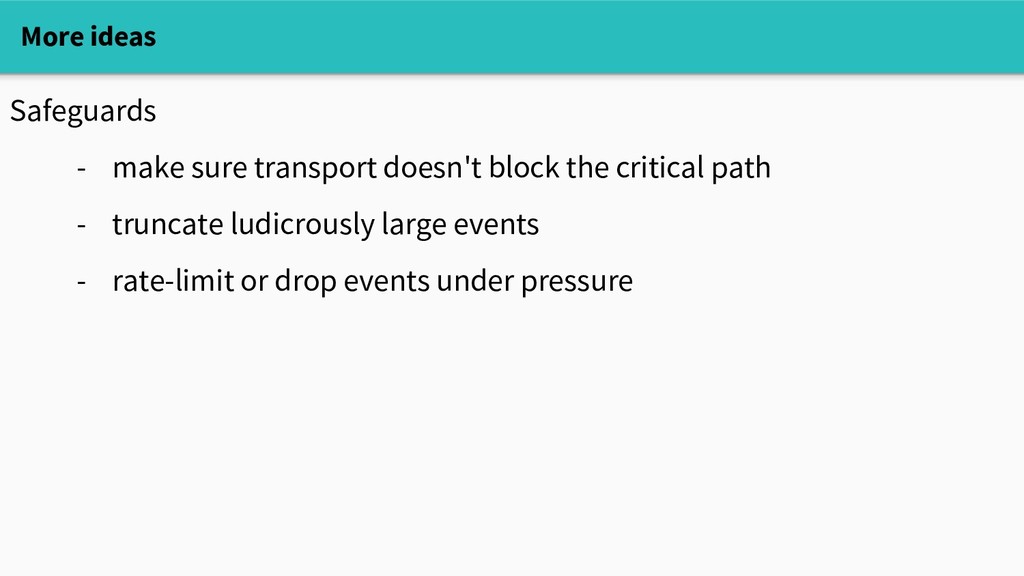
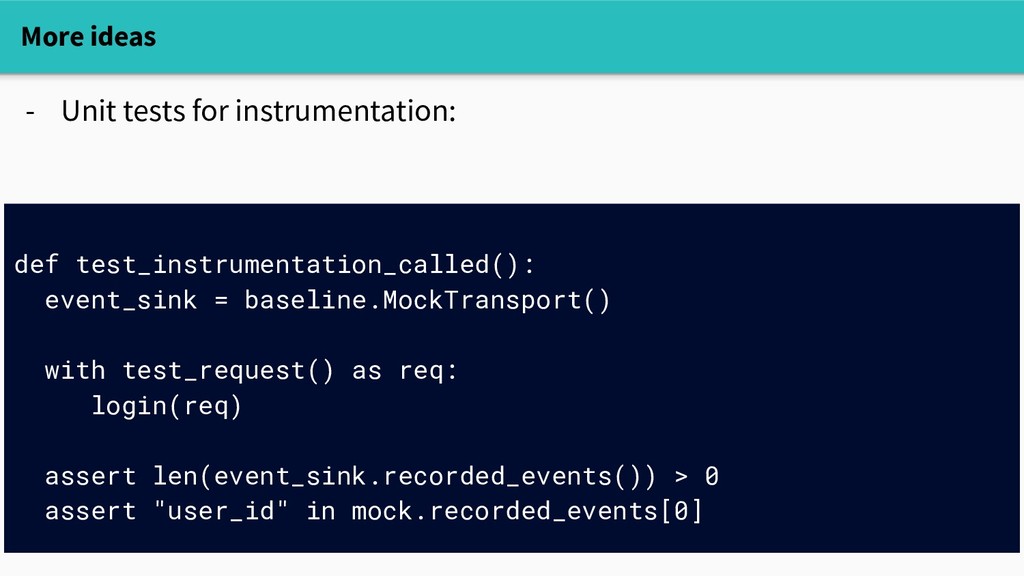
or drop events under pressure - Culture of testing? Awesome! - make it easy to unit-test instrumentation def test_instrumentation_called(): event_sink = baseline.MockTransport() with test_request() as req: login(req) assert len(event_sink.recorded_events()) > 0 assert "user_id" in mock.recorded_events[0]
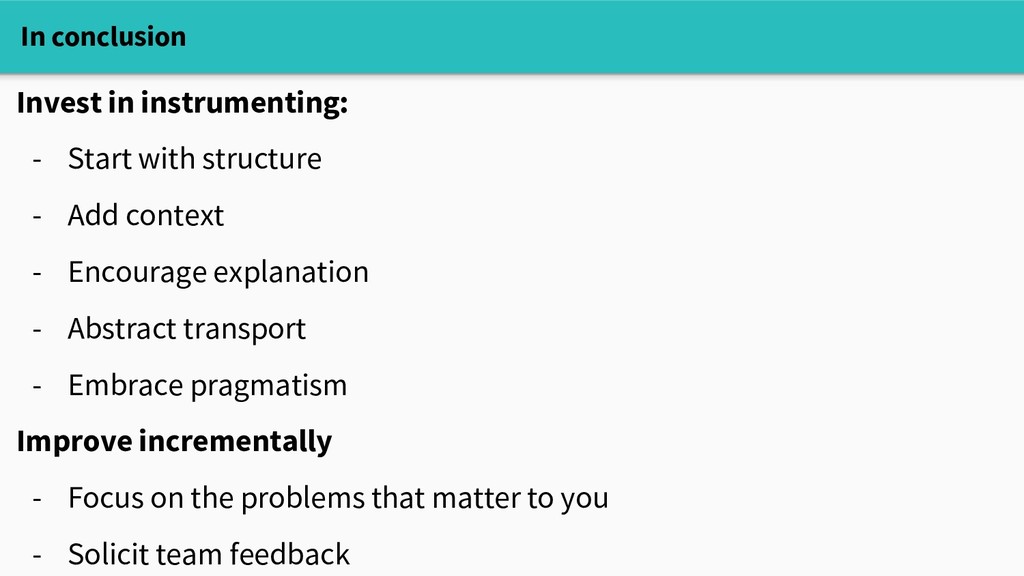
Add context - Encourage explanation - Abstract transport - Embrace pragmatism Improve incrementally - Focus on the problems that matter to you - Solicit team feedback
![No-Frills Observability Eben Freeman @_emfree_ | [email protected]](https://files.speakerdeck.com/presentations/ede54cb6df9b4950b0a98218ee537dc9/slide_0.jpg)
![Thank you! heckle at: @_emfree_ | [email protected] These slides: speakerdeck.com/emfree/no-frills-observabilit](https://files.speakerdeck.com/presentations/ede54cb6df9b4950b0a98218ee537dc9/slide_46.jpg)