Assisted reorganization of data structures.
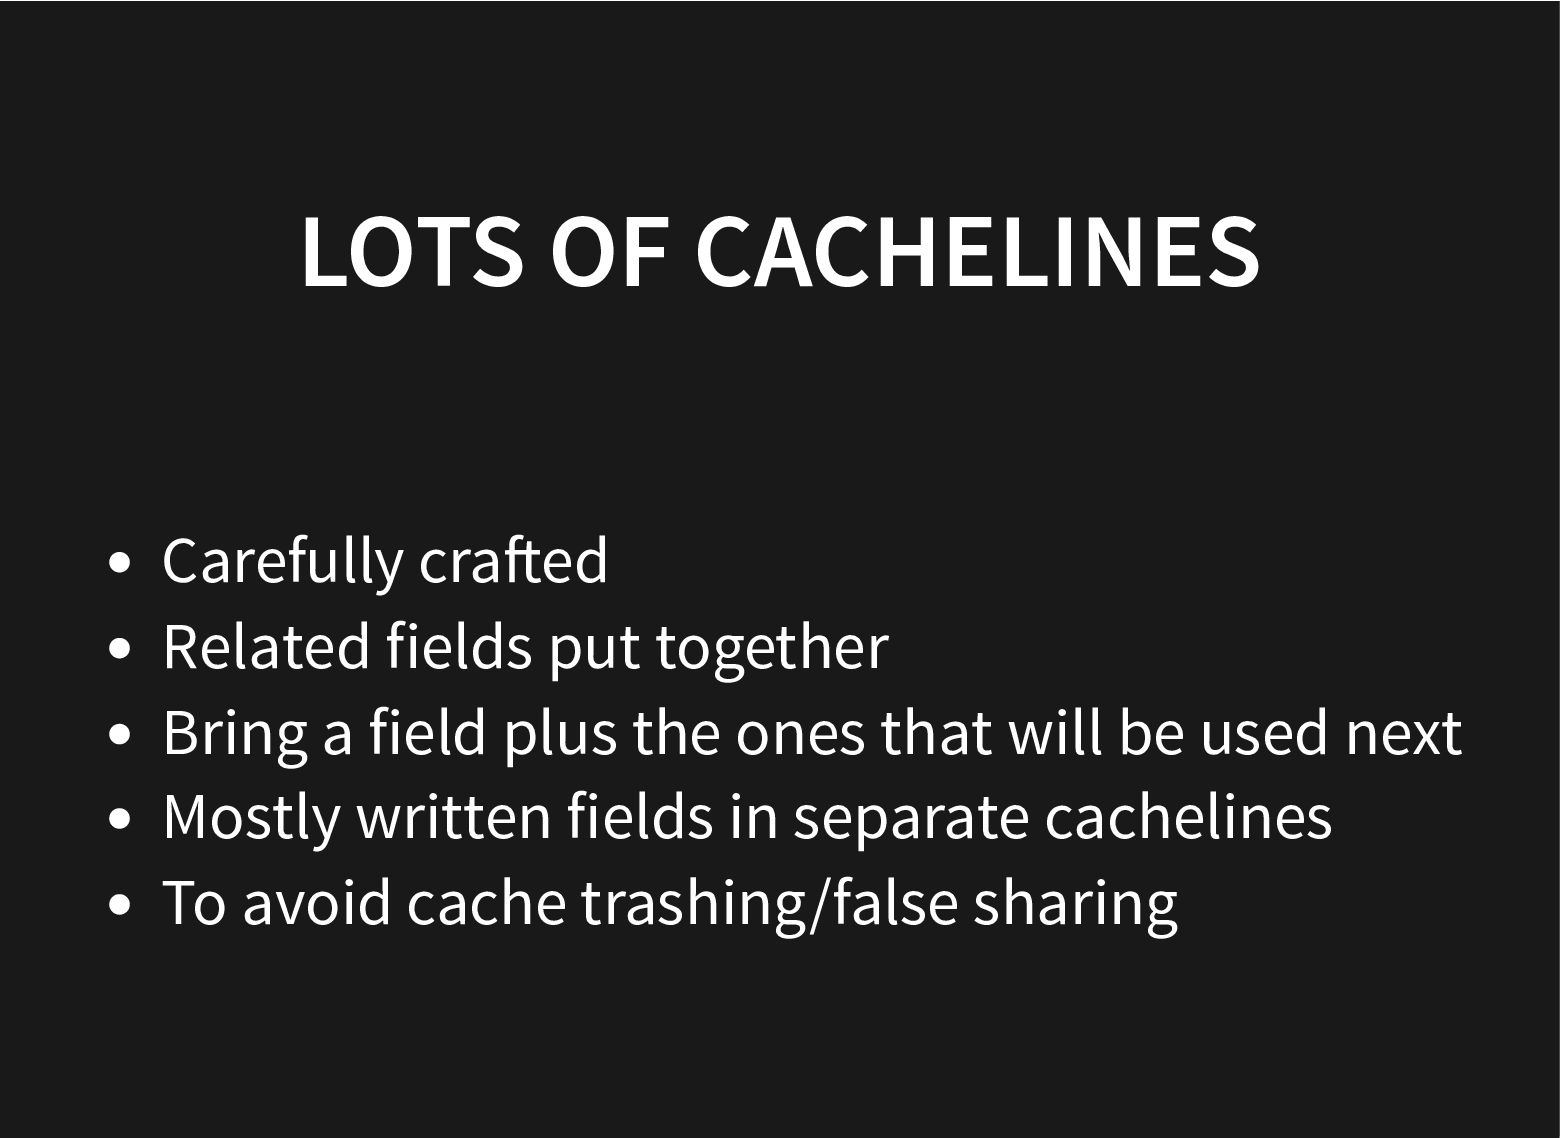
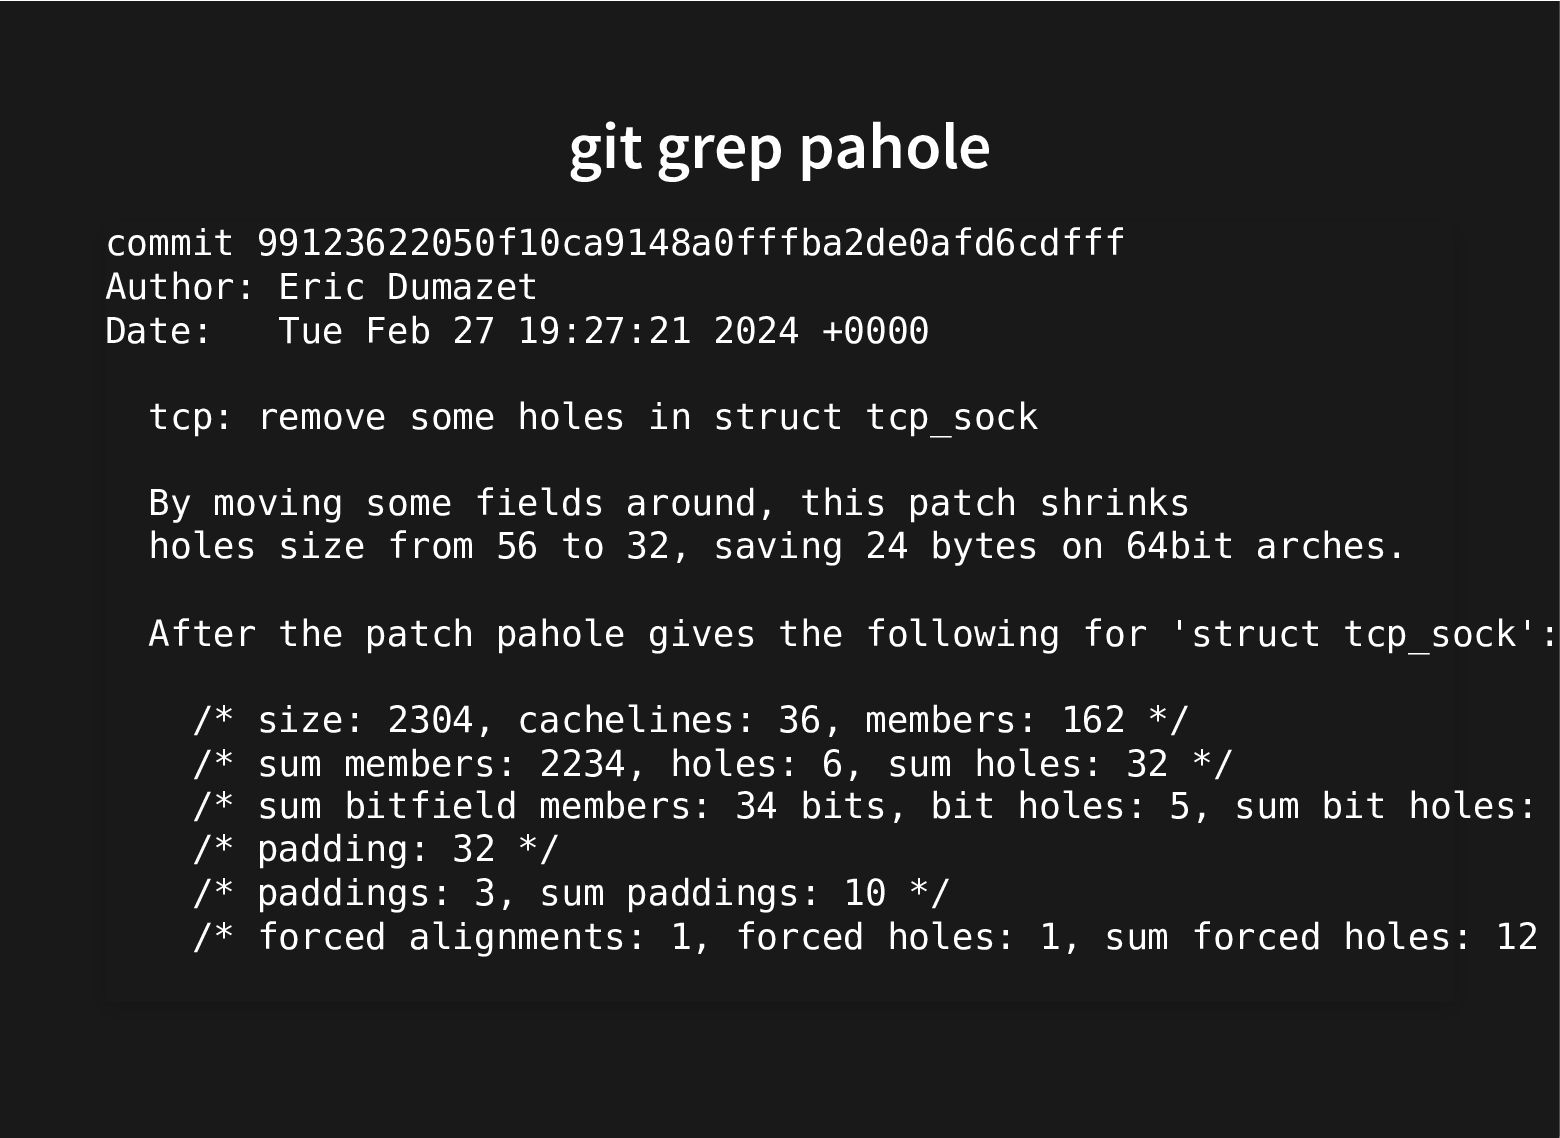
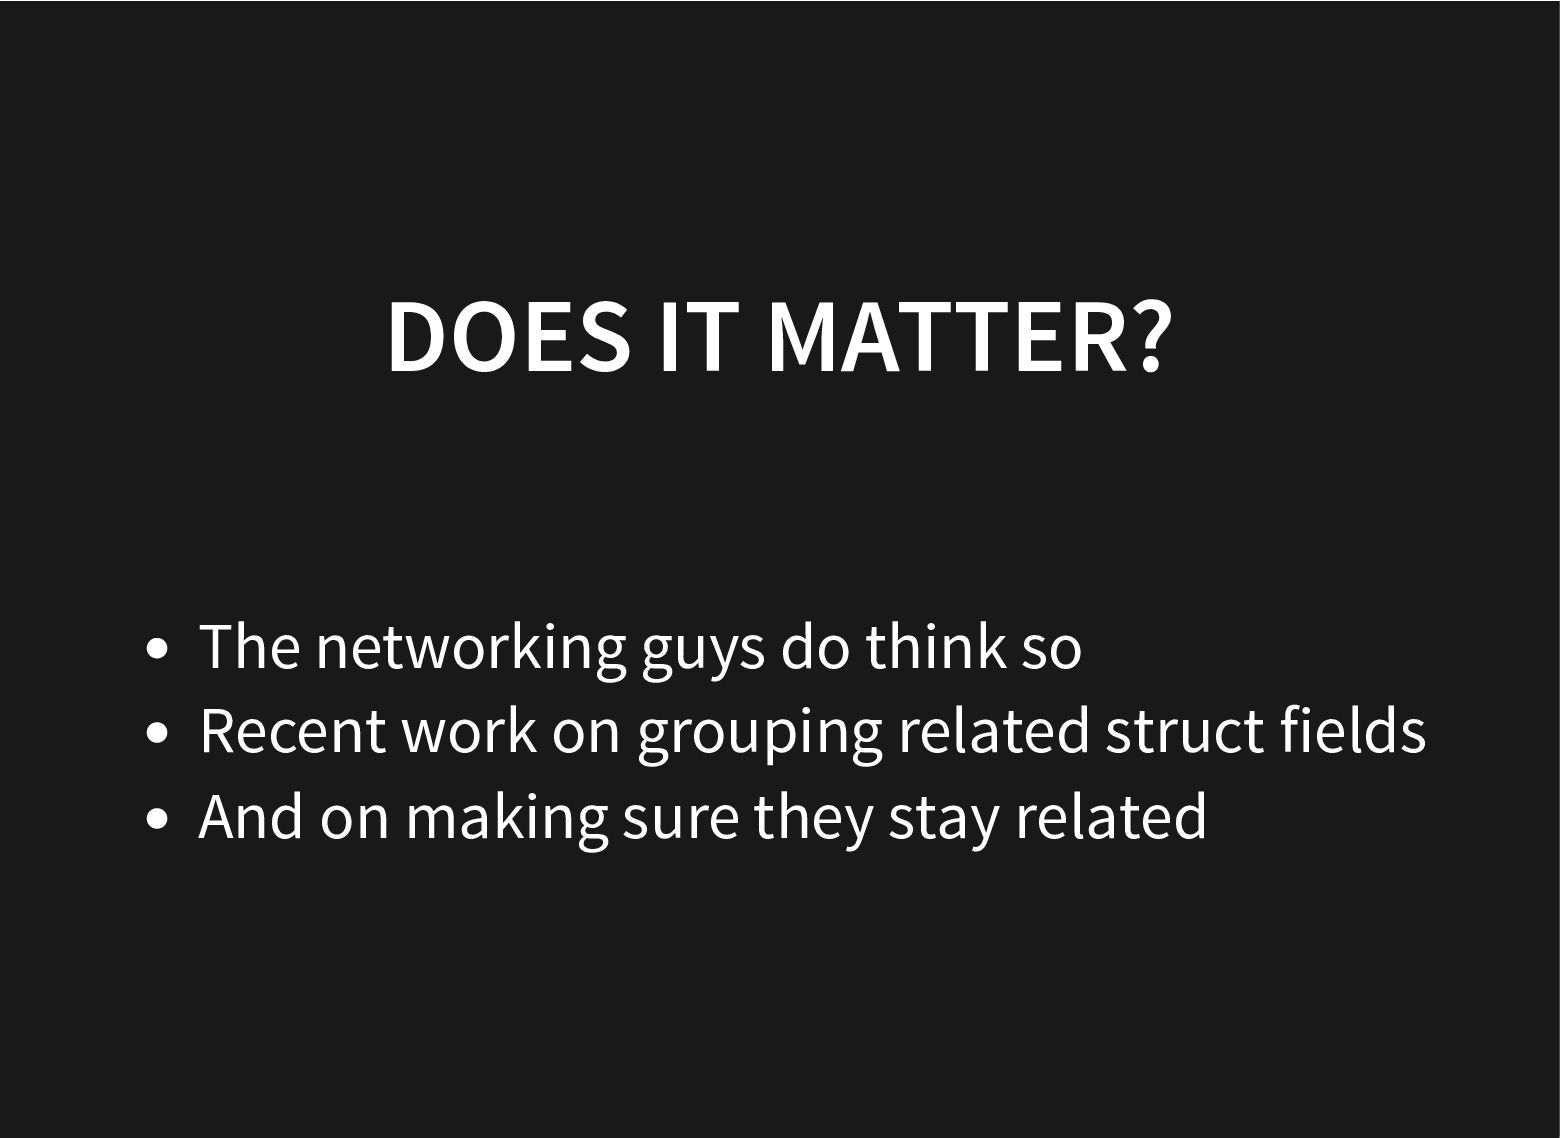
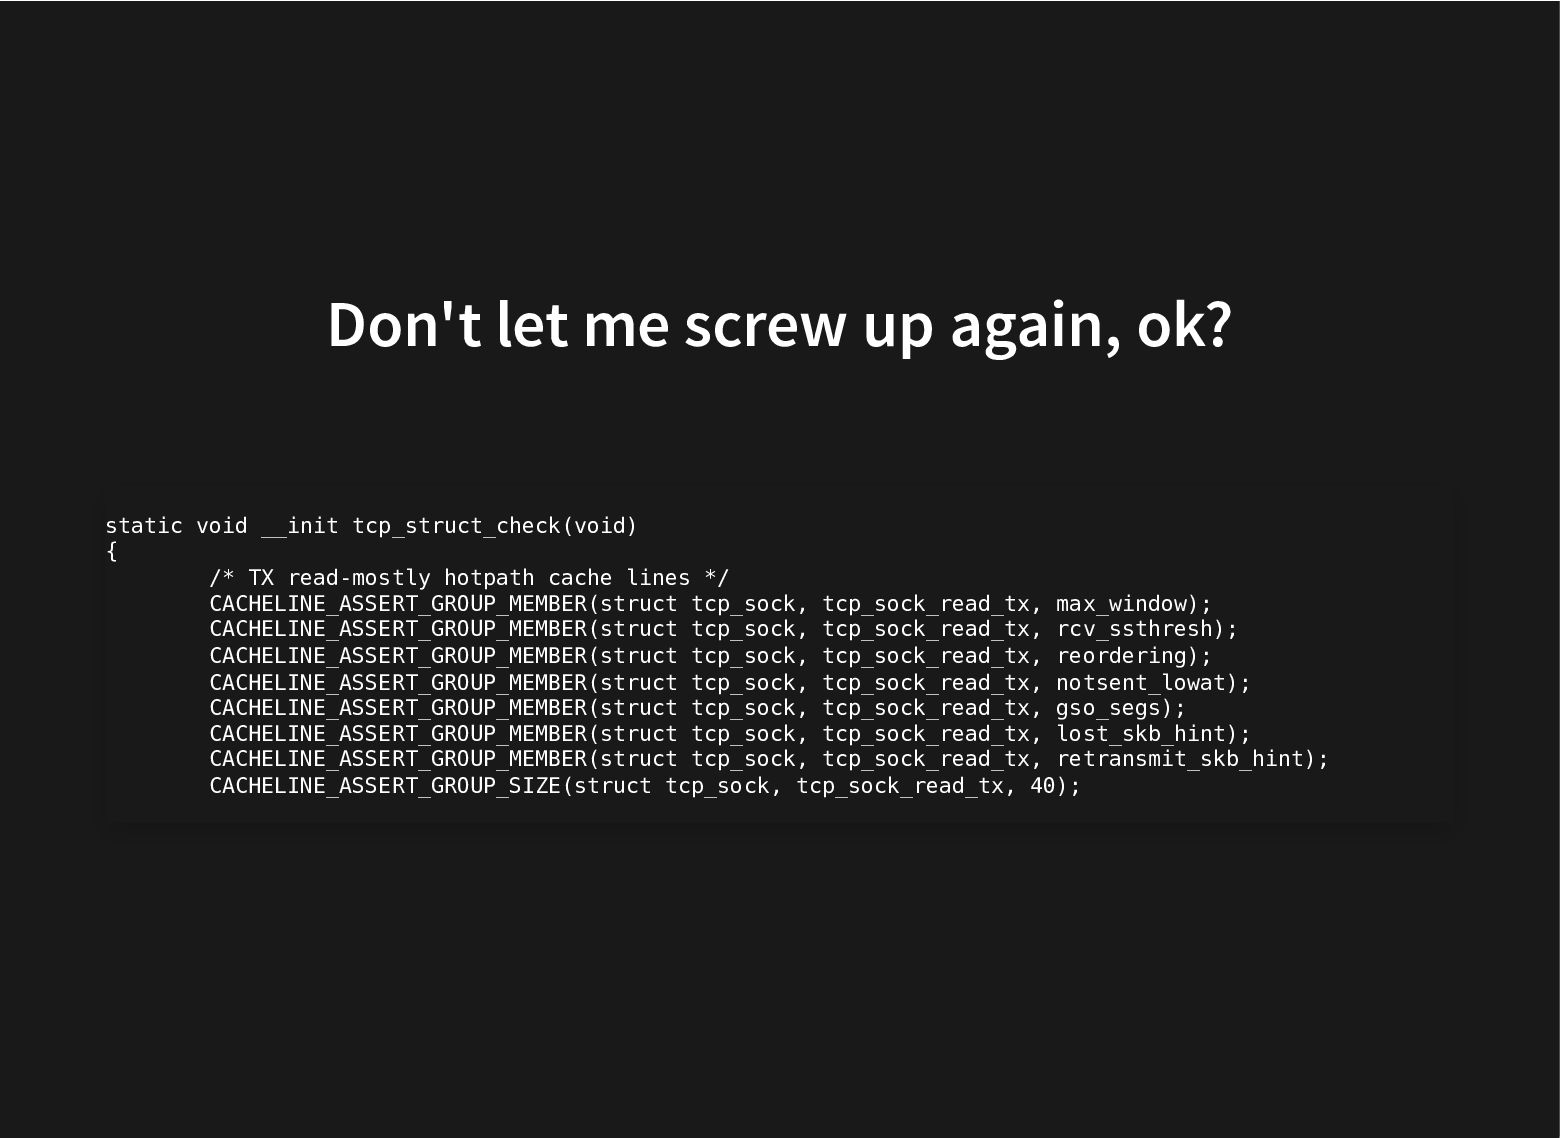
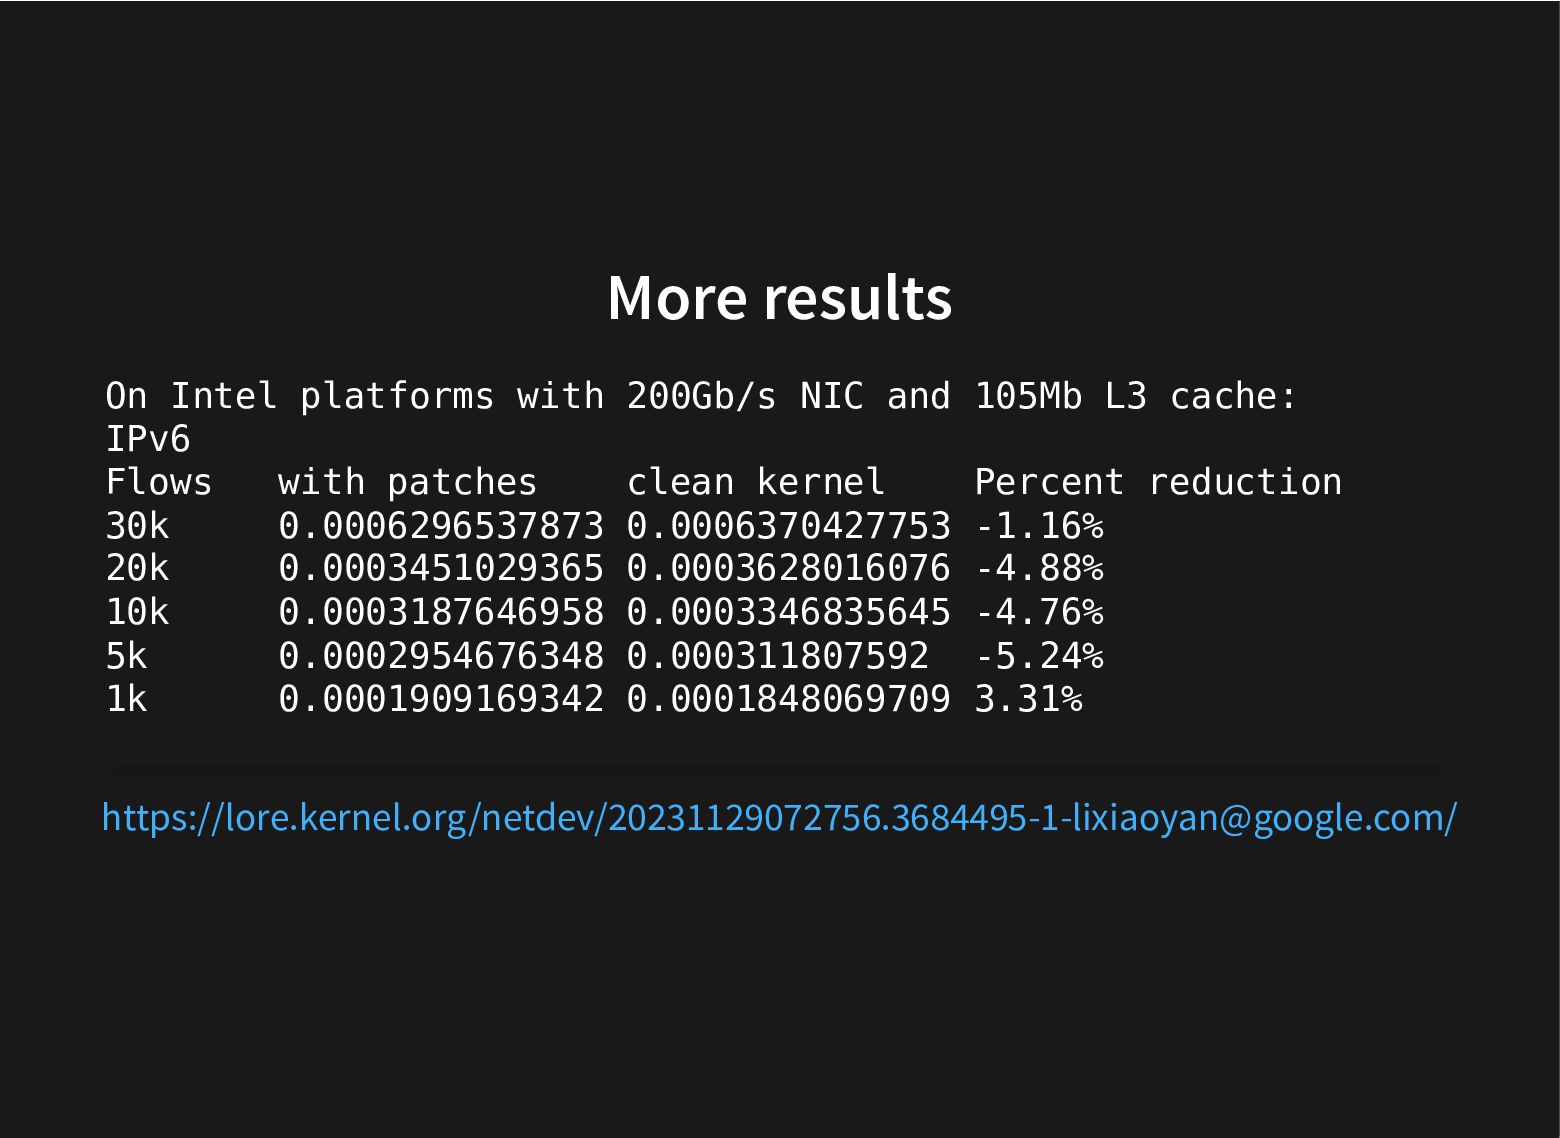
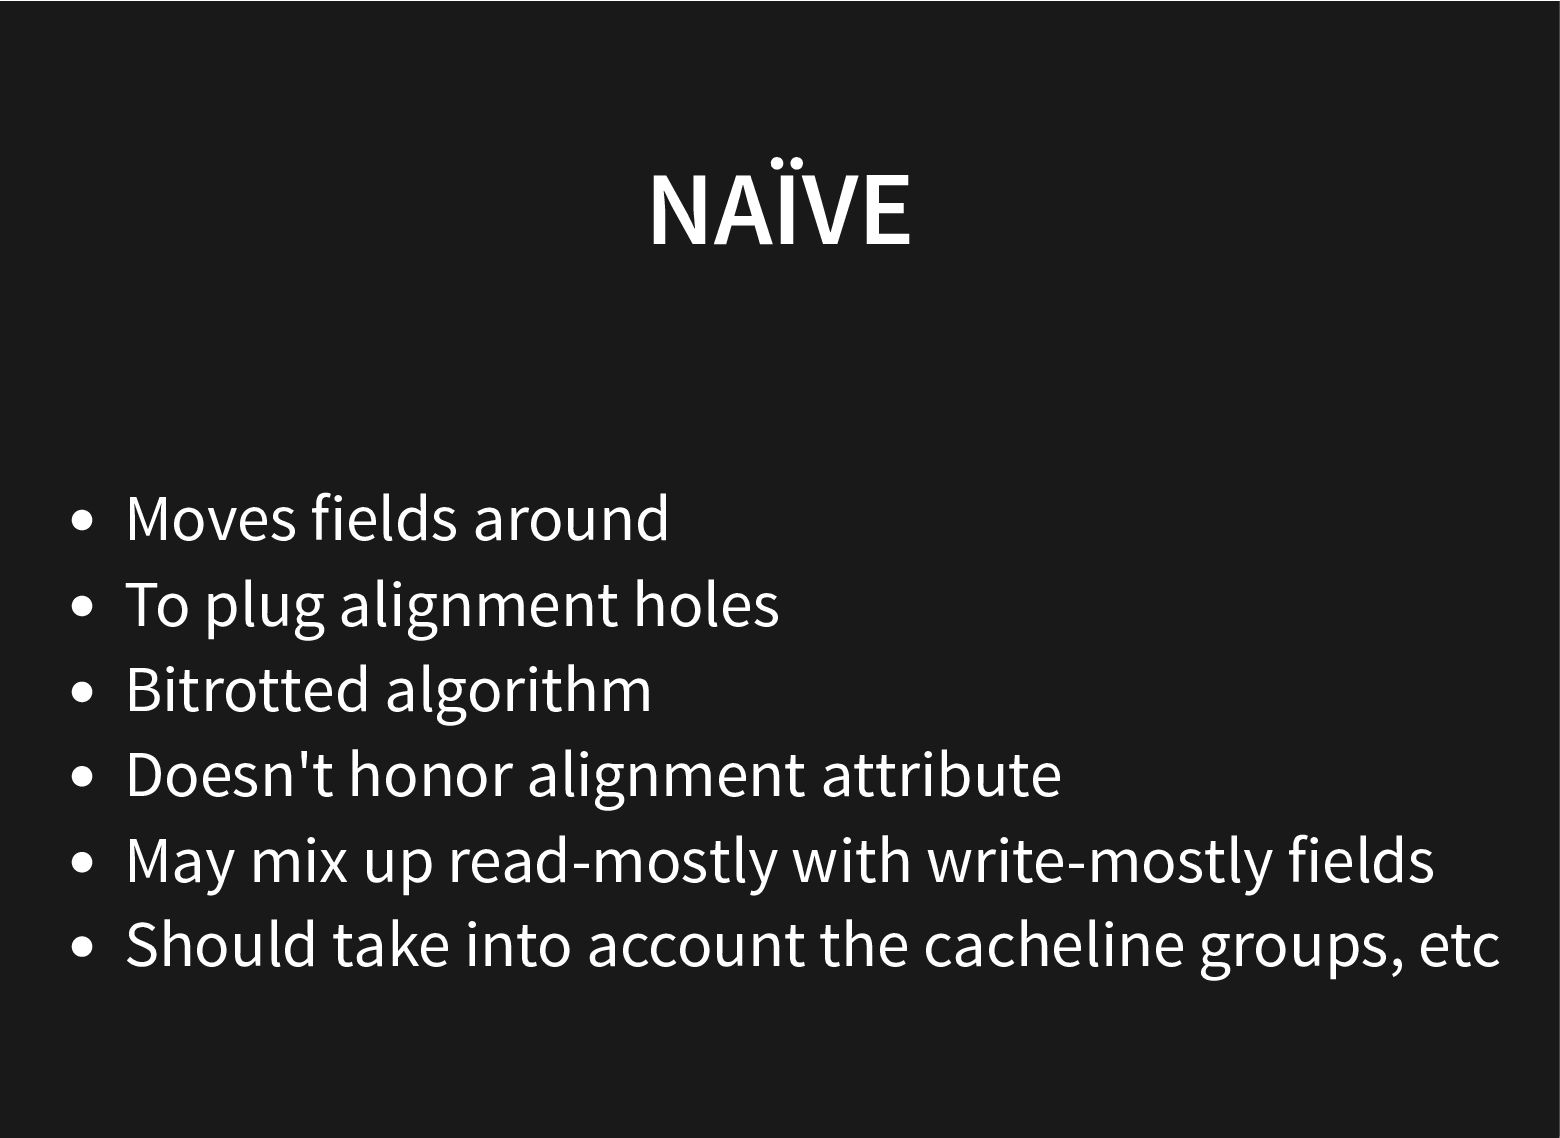
The kernel git history is littered with patches moving struct members around to improve performance by grouping together related fields and moving apart unrelated ones that cause false sharing.
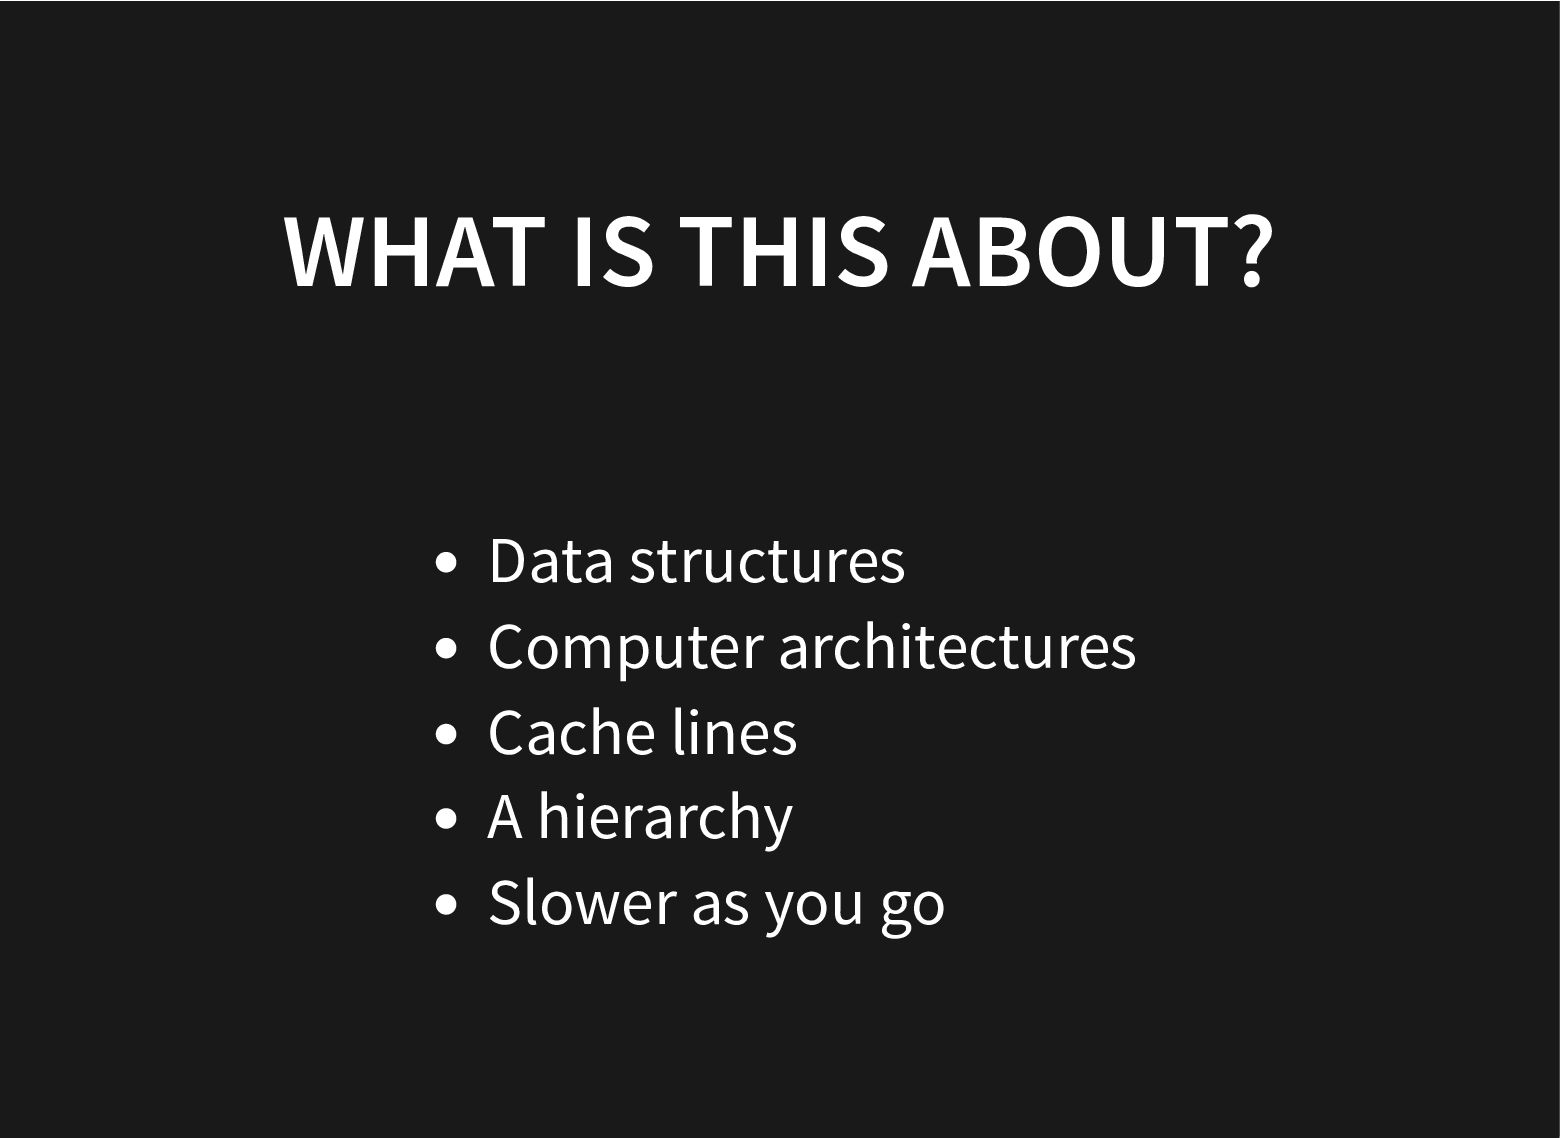
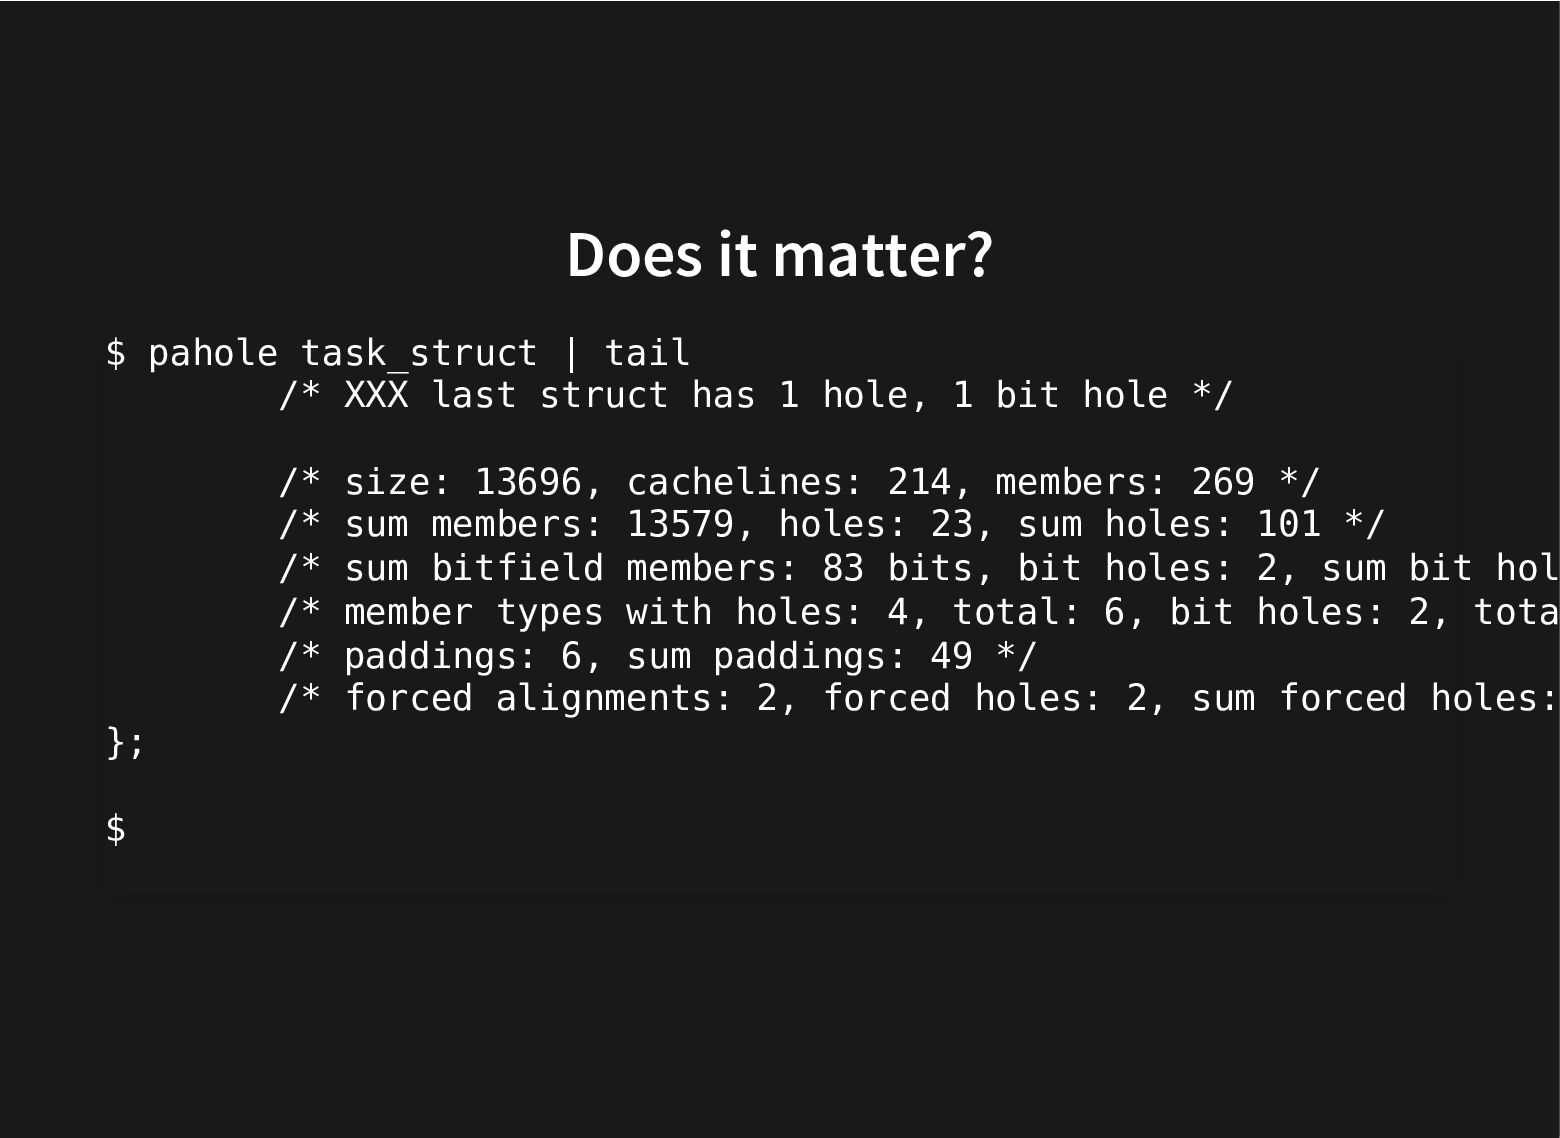
All this to improve the use of the cache hierarchy, which can lead to great performance improvements.
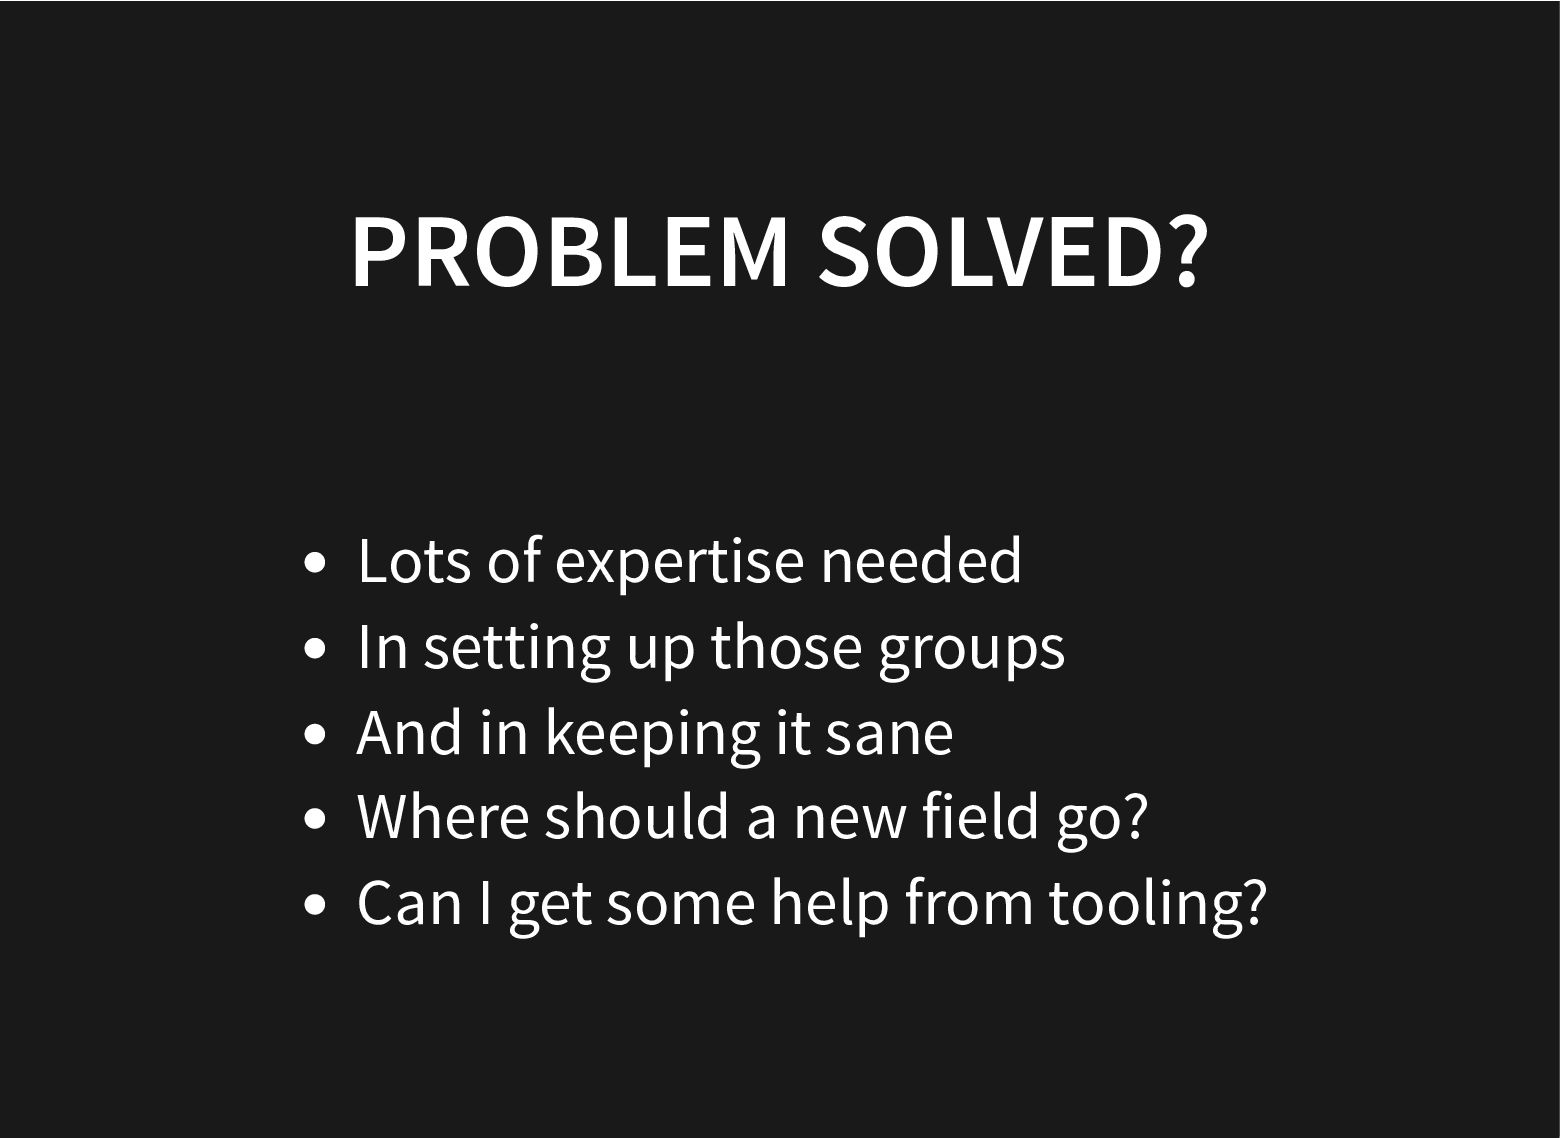
This is done by careful inspection, painstakingly looking at profiles, can we do better?
Recent additions to processors help and recent improvements in perf to use these hardware facilities to do data-type profiling gets us closer to that.
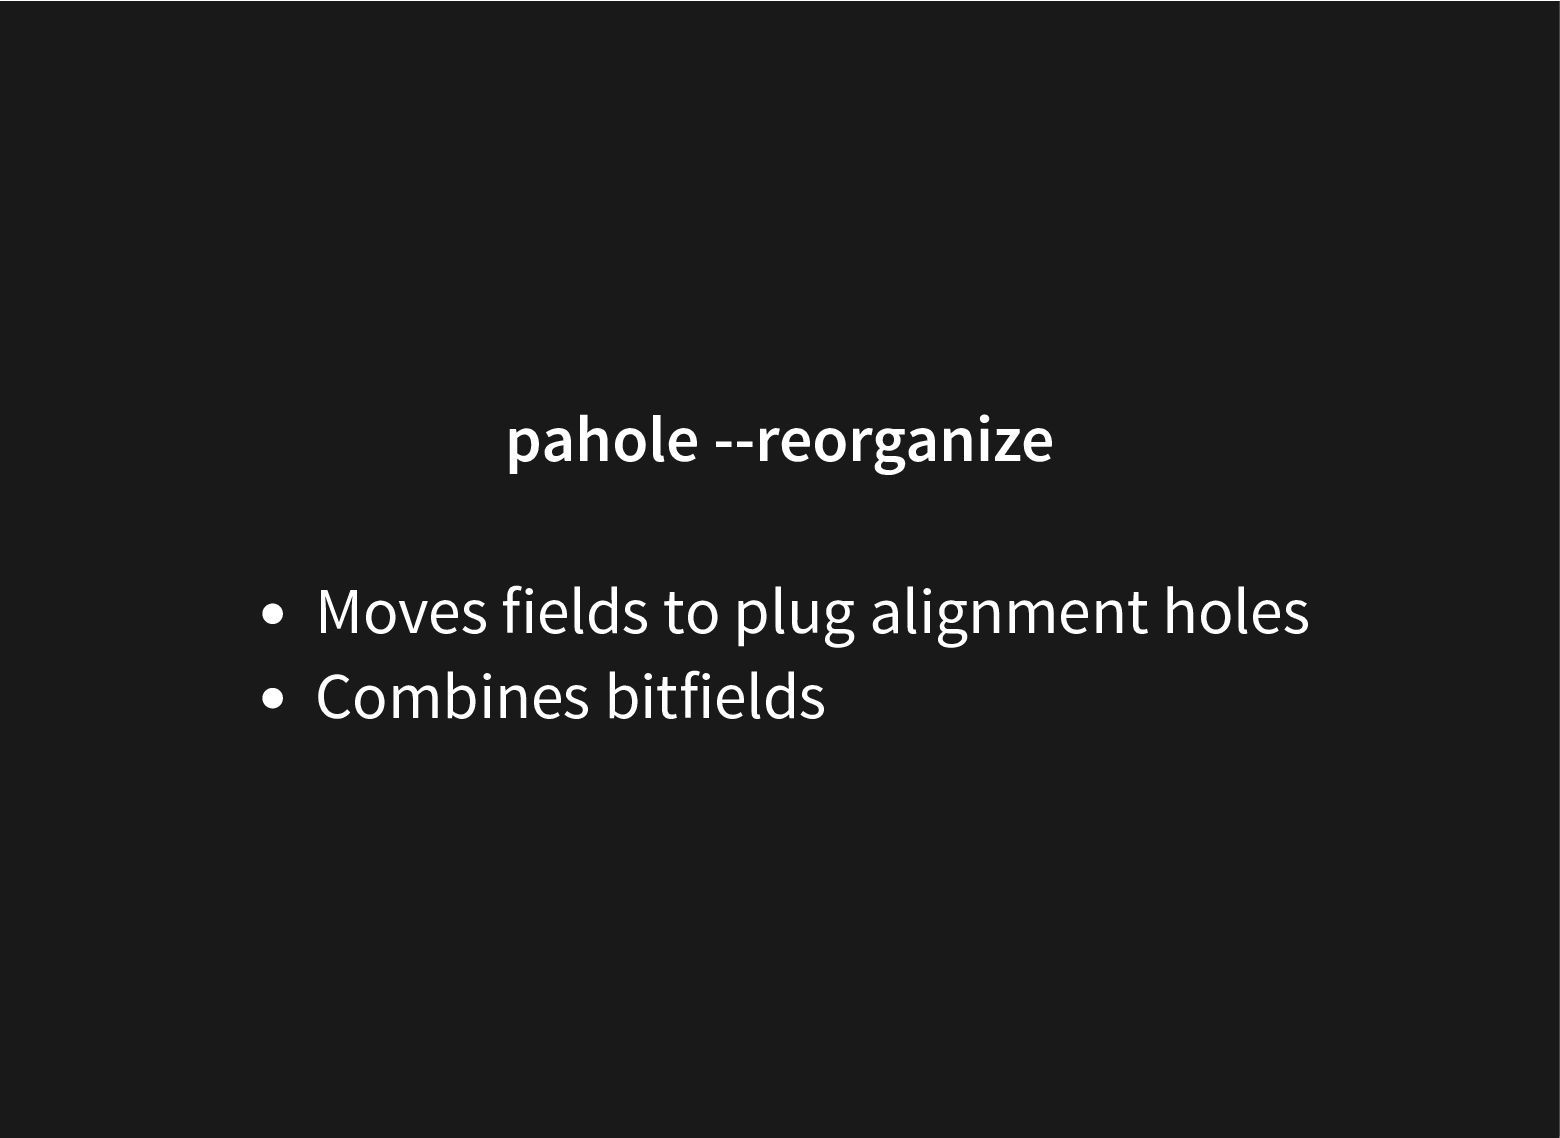
This talk will look at what we can do to further improve our current toolset to find groups of related fields to automate both finding better struct layouts and to have it in regression testing to avoid messing with good struct layouts when adding new fields.
Arnaldo CARVALHO DE MELO
![ASSISTED REORGANIZATION OF DATA STRUCTURES Arnaldo Carvalho de Melo [email protected]](https://files.speakerdeck.com/presentations/b22ffbafb1094af2959fcc320bb87013/slide_0.jpg)
![cacheline groups $ pahole tcp_sock | grep cacheline_group __u8 __cacheline_group_begin__tcp_sock_read_tx[0];](https://files.speakerdeck.com/presentations/b22ffbafb1094af2959fcc320bb87013/slide_10.jpg)
![Motivation From: Coco Li <[email protected]> Subject: [PATCH v8 0/5] Analyze](https://files.speakerdeck.com/presentations/b22ffbafb1094af2959fcc320bb87013/slide_17.jpg)
![kernel functions doing mem loads # perf report --dso '[kernel.kallsyms]'](https://files.speakerdeck.com/presentations/b22ffbafb1094af2959fcc320bb87013/slide_27.jpg)
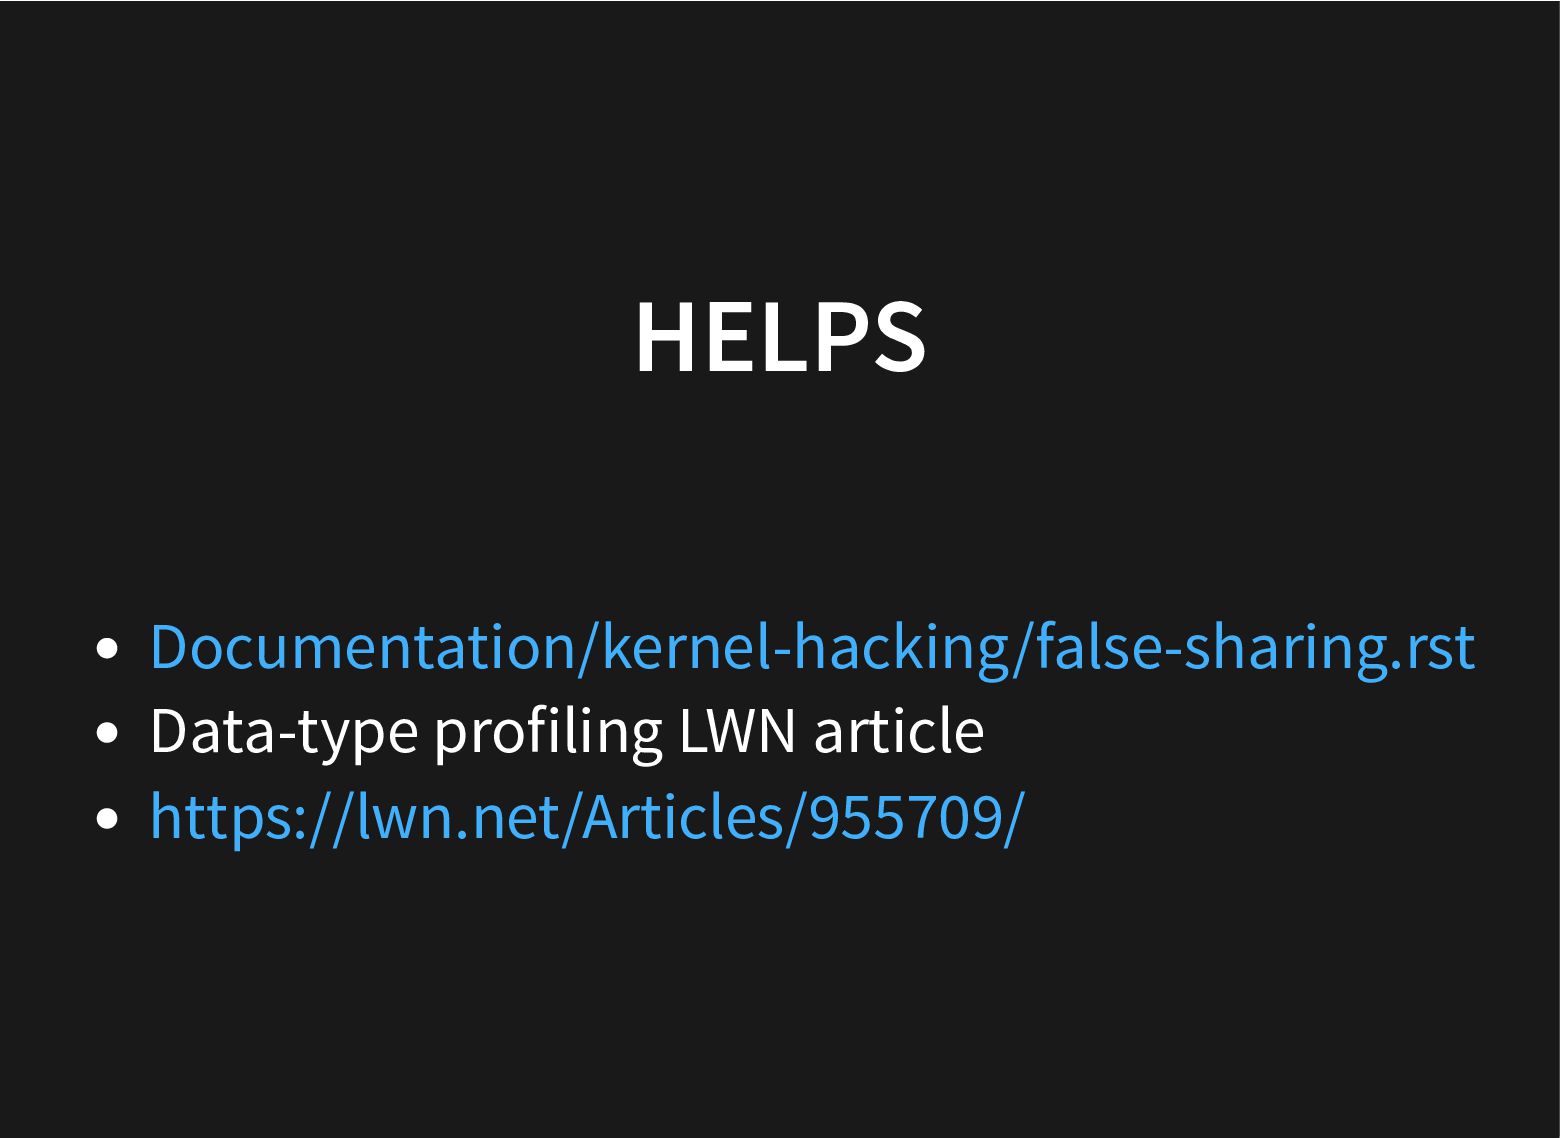
![THE END [email protected] http://fedorapeople.org/~acme/prez/kernel-recipes-2024-Paris https://perf.wiki.kernel.org/index.php/Useful_Links Documentation/kernel-hacking/false-sharing.rst Data-type profiling LWN article](https://files.speakerdeck.com/presentations/b22ffbafb1094af2959fcc320bb87013/slide_55.jpg)