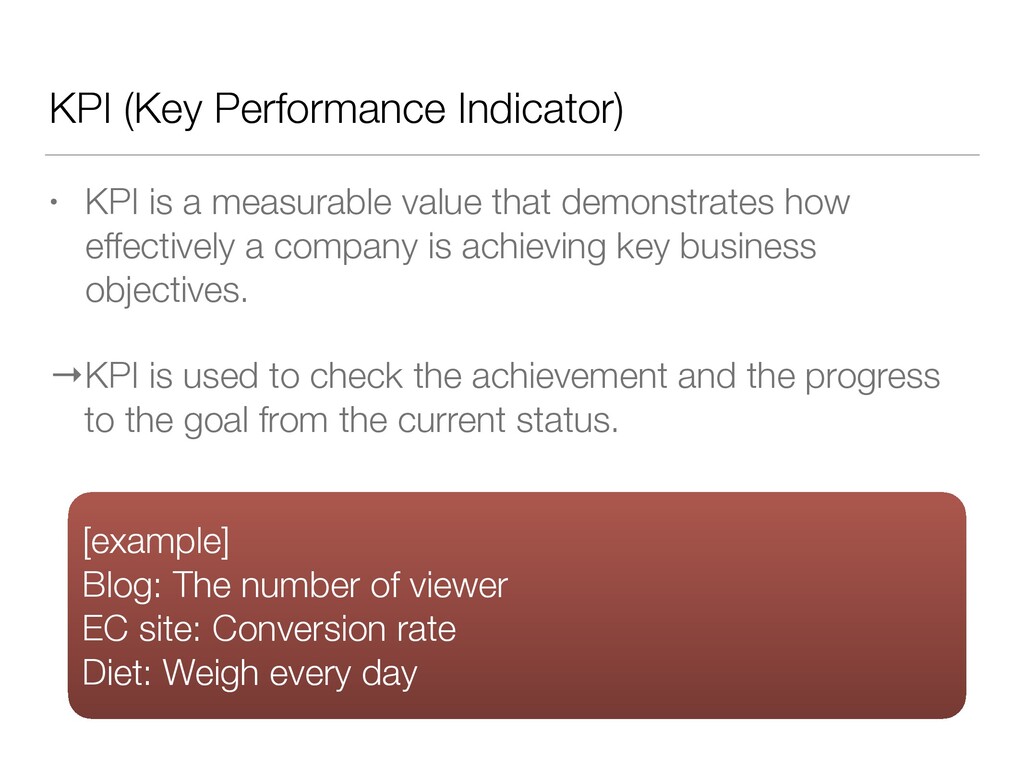
that demonstrates how effectively a company is achieving key business objectives. →KPI is used to check the achievement and the progress to the goal from the current status. [example] Blog: The number of viewer EC site: Conversion rate Diet: Weigh every day
simple. (It’s easiest for beginners in 3 chart libraries.) • A lot of Demo for each chart. https://www.chartjs.org/samples/latest/ • Libraries for each JS framework is prepared.
version. • The configuration is a little bit complicated because it has more functions than Chart.js. • A lot of Demo for each chart same as Chart.js. https://www.highcharts.com/demo • Many kind of charts is prepared. (e.g.: stock Chart, heatmap) • Libraries for each JS framework is prepared.
chart libraries. (you can customize the detail of charts, such as scaling, axes, grid, label..etc) • The most kinds of charts is prepared in 3 chart libraries. https://github.com/d3/d3/wiki/Gallery • Libraries for React and Angular are prepared and some charts aren’t covered in ones. (mentioned in next slide.)
needed to draw Radar Chart with D3 library for Angular (Angular-nvD3) 2. Basic charts such as Bar charts and Line charts were covered, but Radar Chart wasn't covered. 3. I searched some js libraries and investigated the feasibility. (It takes 1 week to find good one.) I again realized… It’s important to consider the compatibility between a project (JS framework) and the libraries which you want to use.
how effectively a company is achieving key business objectives. • Chart Libraries features You need to draw just simple chart -> ChartJS You need to complicated chart -> Highchart.js or D3.js • The importance when choosing libraries (Not only for Chart libraries) Check 2 points: (1) easy to use ones in your project (2) Compatibility between libraries and your project