Upgrade to Pro — share decks privately, control downloads, hide ads and more …

[LASCOT2012] Measure and Manage Flow

Zsolt Fabok
September 21, 2012

[LASCOT2012] Measure and Manage Flow

The fifth iteration of this talk, presented at Lean Agile Scotland 2012.

Please note that the content of this talk changes after each event, because I'm continuously improving it using the feedback and the needs of the audience.

Zsolt Fabok

September 21, 2012
Tweet

More Decks by Zsolt Fabok

Other Decks in Technology

Transcript

  1. The Cumulative Flow Diagram Done Started Queued lead time cycle

    time WIP backlog time number of work items It offers more than just the WIP...
  2. ~ ~ ~ ~ ~ ~ ~ ~ ~ ~

    ~ ~ ~ ~ ~ ~ ~ ~ ~ ~ ~ ~ ~ ~ ~ ~ Q D 3 4 1 2 The simplest way of collecting data:
  3. Actually, “things slow down”, so it was not a good

    idea (solve the right problem instead - systems thinking). End of the detour.
  4. lead time CFD was not much help here... ...because we

    didn’t know much about the nature of the lead time
  5. Distribution of lead times days count 0 3 5 8

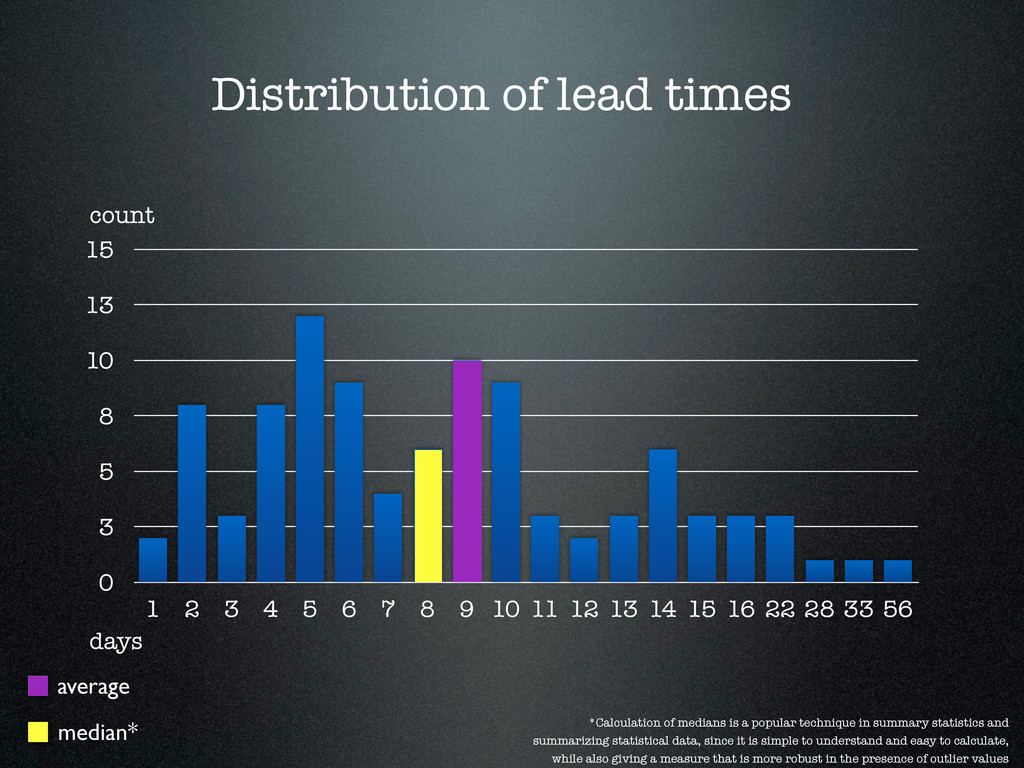
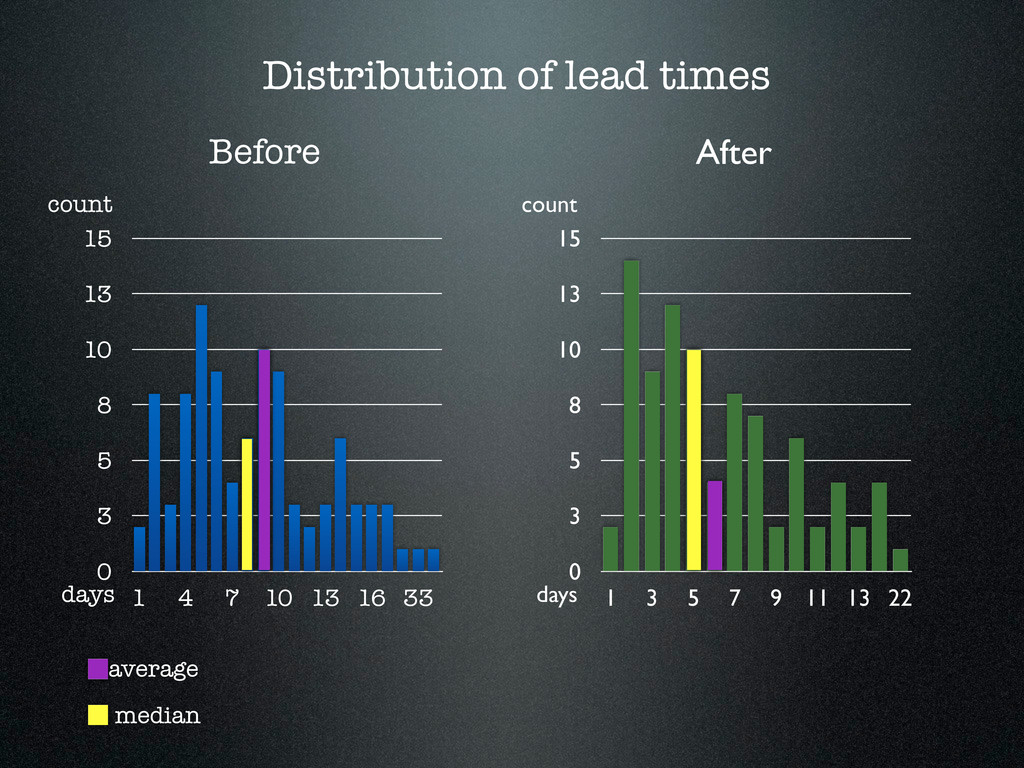
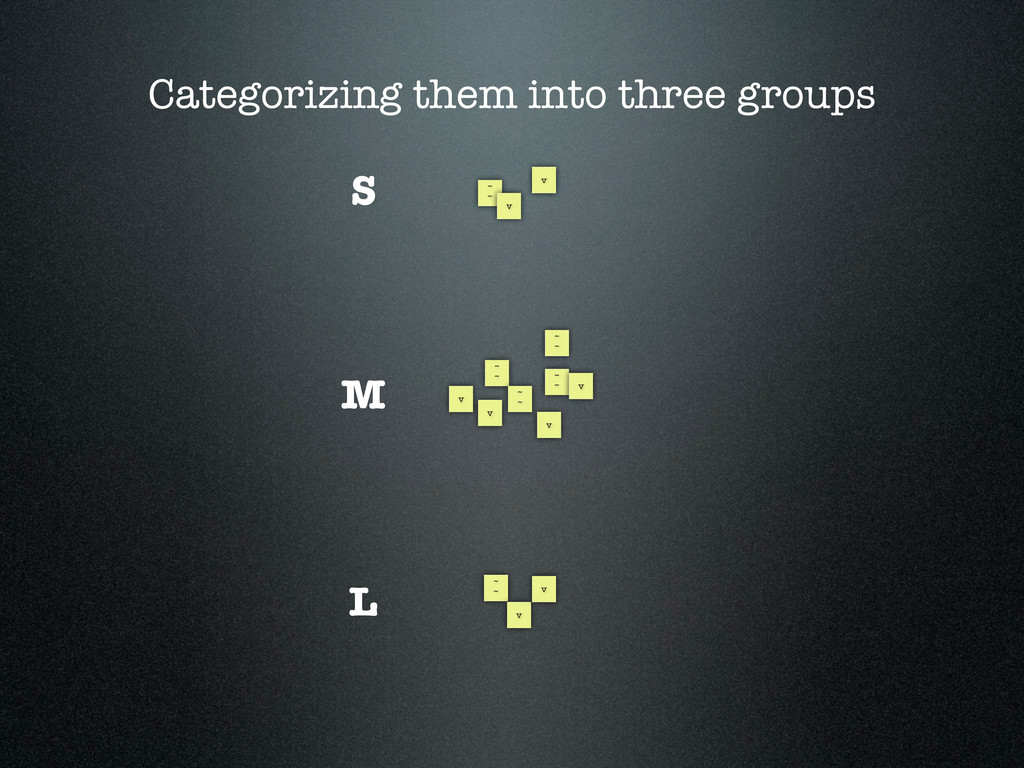
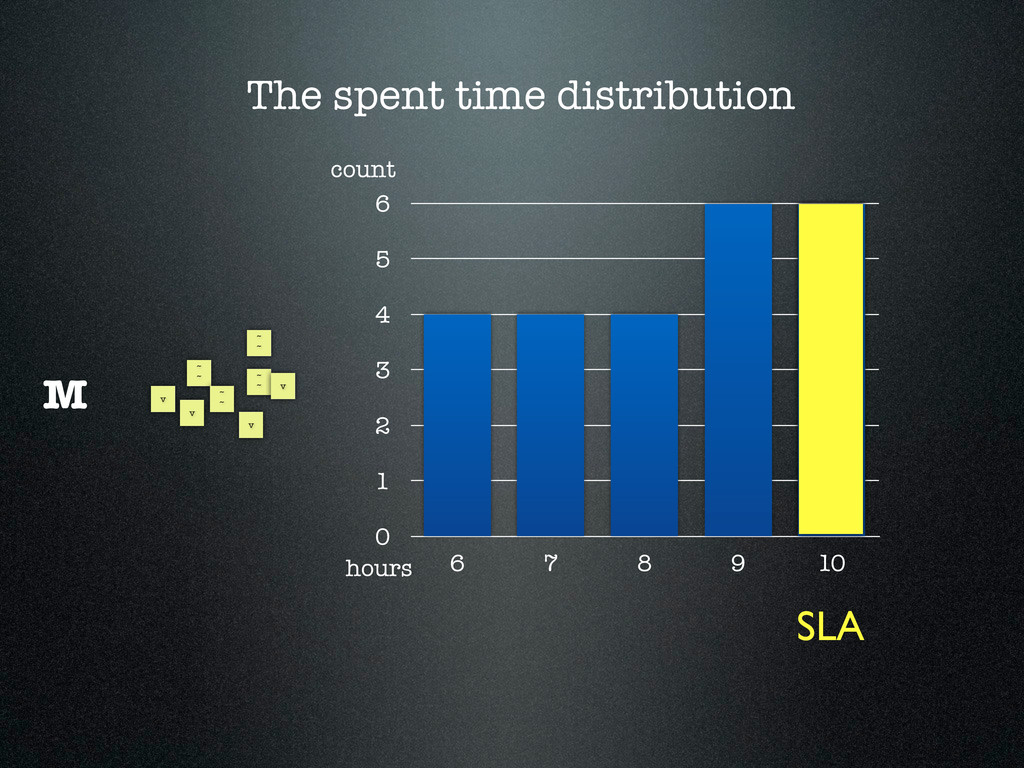
    10 13 15 1 2 3 4 5 6 7 8 9 10 11 12 13 14 15 16 22 28 33 56 average median* *Calculation of medians is a popular technique in summary statistics and summarizing statistical data, since it is simple to understand and easy to calculate, while also giving a measure that is more robust in the presence of outlier values
  6. time spent on implementation (hours) time spent waiting (hours) %

    1 63 98 7 57 90 2 62 97 2 62 97 3 61 96 Some examples of work items with 8-day lead time
  7. Distribution of lead times days count 0 3 5 8

    10 13 15 1 4 7 10 13 16 33 Before average 0 3 5 8 10 13 15 1 3 5 7 9 11 13 22 count days After median
  8. 0 4 8 11 15 31-32 33-34 35-36 37-38 Number

    of rejected work items count week
  9. 0 4 8 11 15 31-32 33-34 35-36 37-38 39-40

    42-43 44-45 Number of rejected work items count week
  10. Sales: “I want to know when the new features can

    hit the market!” Management: “I want to know how much it will cost me!”
  11. All the work items we had so far (~20 work

    items) ~ ~ ~ ~ ~ ~ ~ ~ ~ ~ ~ ~ v v v v v v v v
  12. Categorizing them into three groups ~ ~ ~ ~ ~

    ~ ~ ~ ~ ~ ~ ~ v v v v v v v v S M L
  13. The lead time distribution ~ ~ ~ ~ ~ ~

    ~ ~ v v v v M 0 1 1 2 3 3 4 1 2 3 4 5 6 7 8 9 12 13 16 SLA days count Expired
  14. The spent time distribution ~ ~ ~ ~ ~ ~

    ~ ~ v v v v M 0 1 2 3 4 5 6 6 7 8 9 10 SLA hours count
  15. #1 We decided that we would force ourselves to keep

    the SLA #2 Nothing changed. Still the same ratio
  16. “If you start measuring something you start optimizing it, and

    I know it's the wrong thing to optimize.” A quote which is worth considering http://paulgraham.com/swan.html
  17. The key ideas 1. We develop software not models (value)

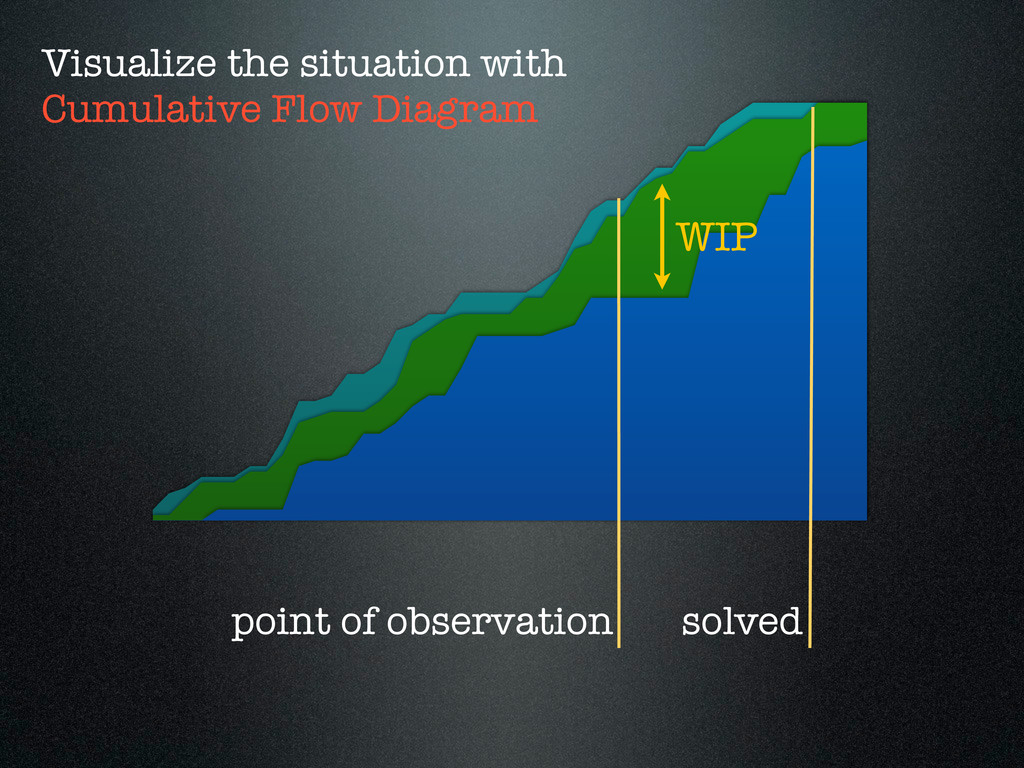
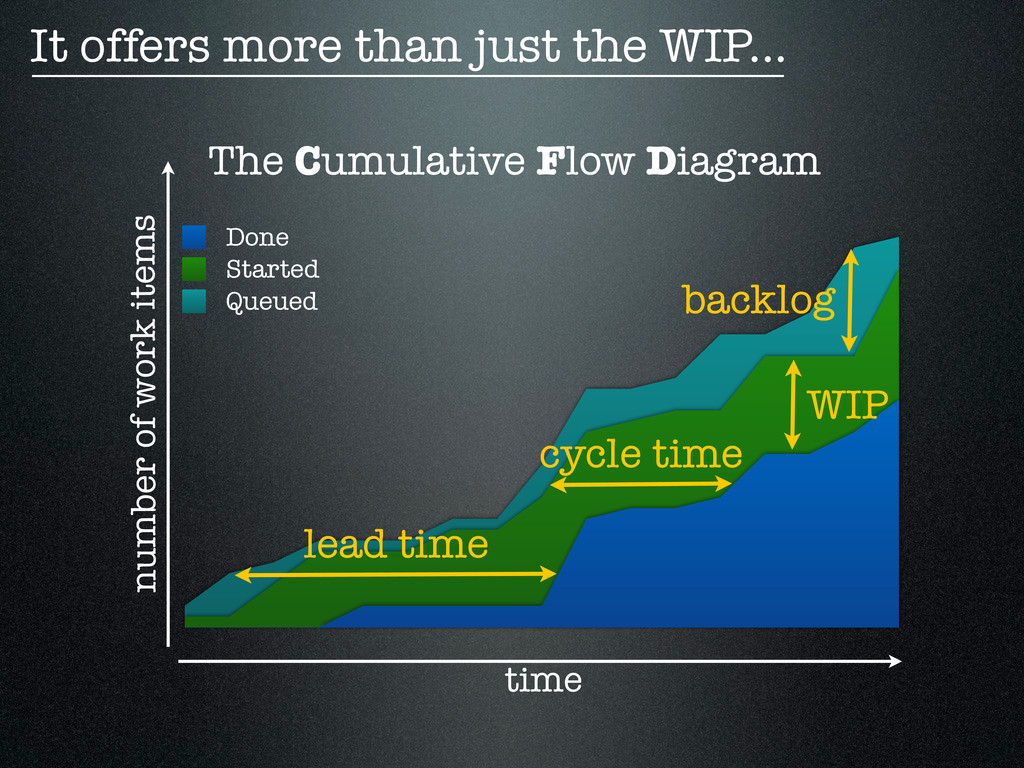
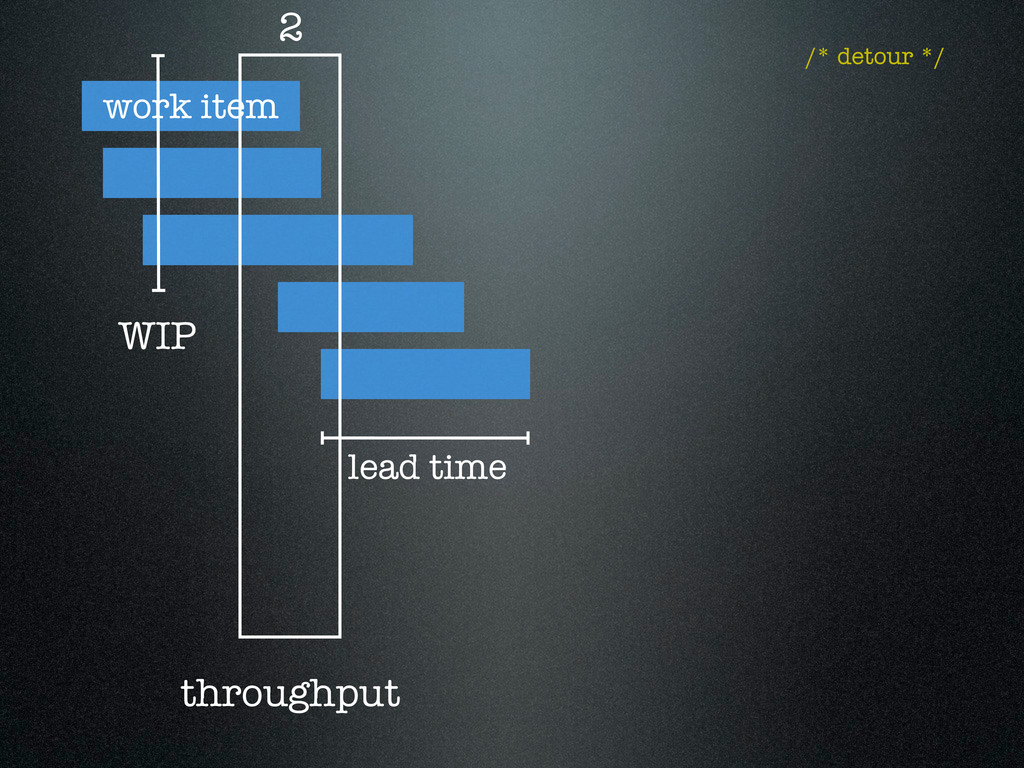
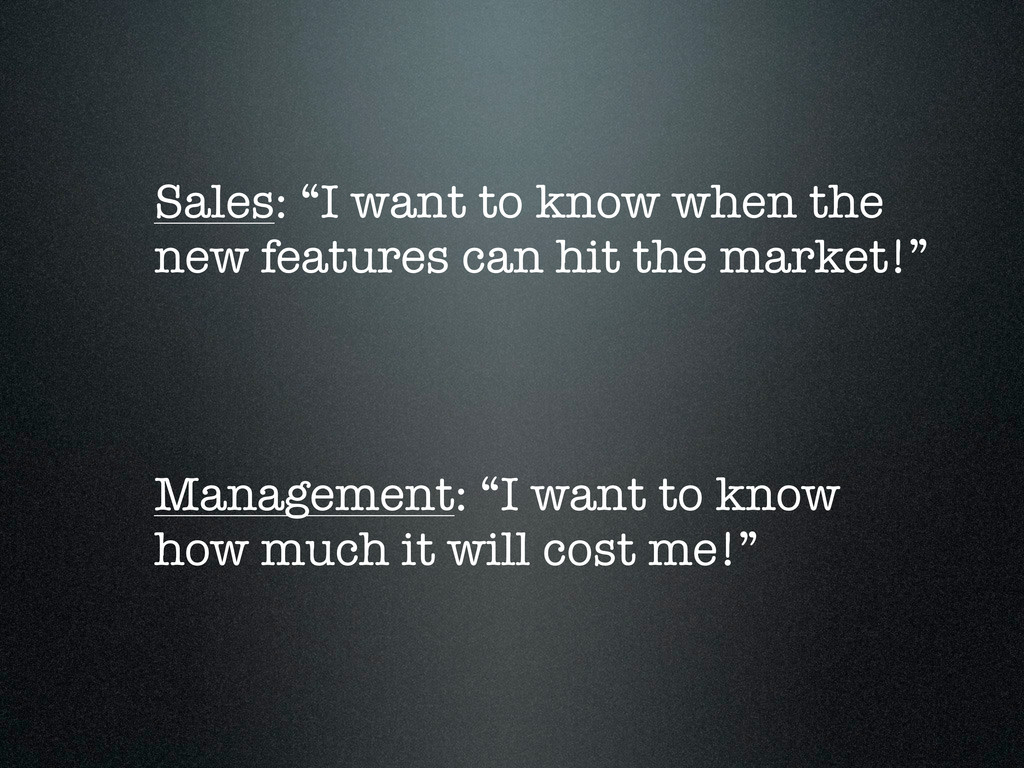
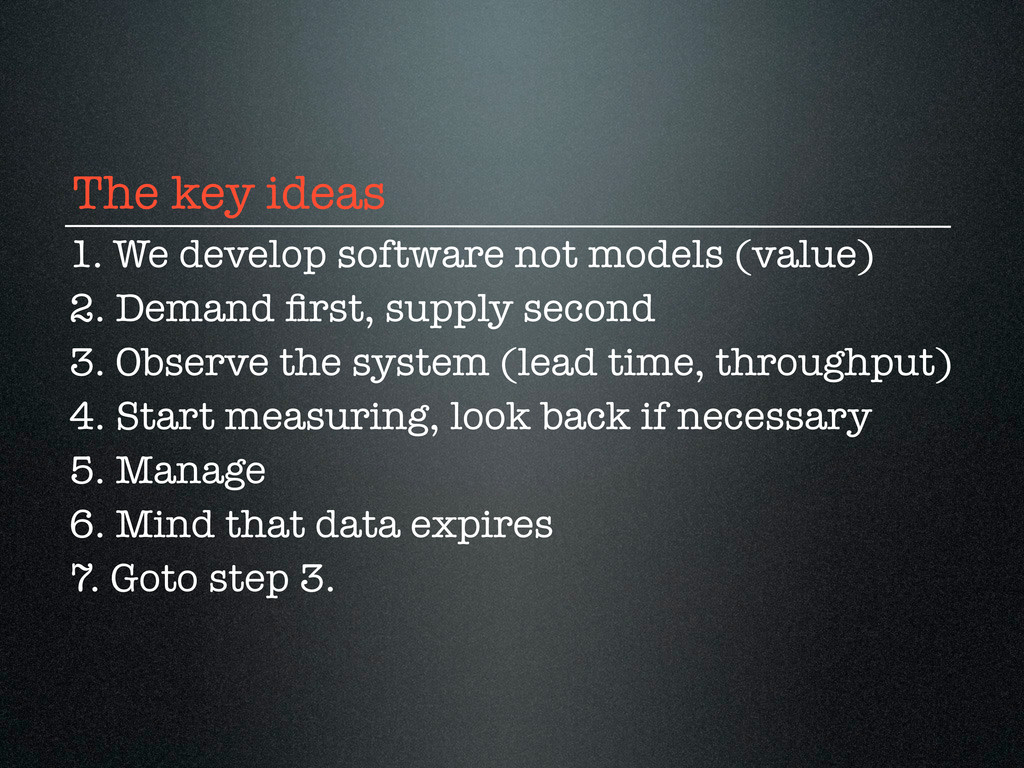
    2. Demand first, supply second 3. Observe the system (lead time, throughput) 4. Start measuring, look back if necessary 5. Manage 6. Mind that data expires 7. Goto step 3.