in which we gather as the ancestral homelands of the Beothuk, and the island of Newfoundland as the ancestral homelands of the Mi’kmaq and Beothuk. We would also like to recognize the Inuit of Nunatsiavut and NunatuKavut and the Innu of Nitassinan, and their ancestors, as the original people of Labrador. We strive for respectful partnerships with all the peoples of this province as we search for collective healing and true reconciliation and honour this beautiful land together. http://www.mun.ca/aboriginal_affairs/
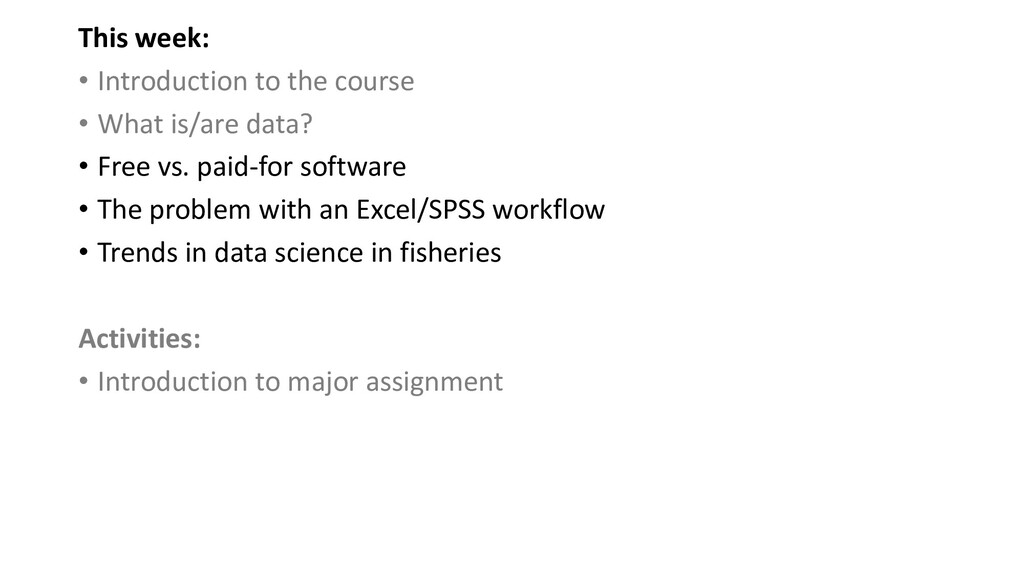
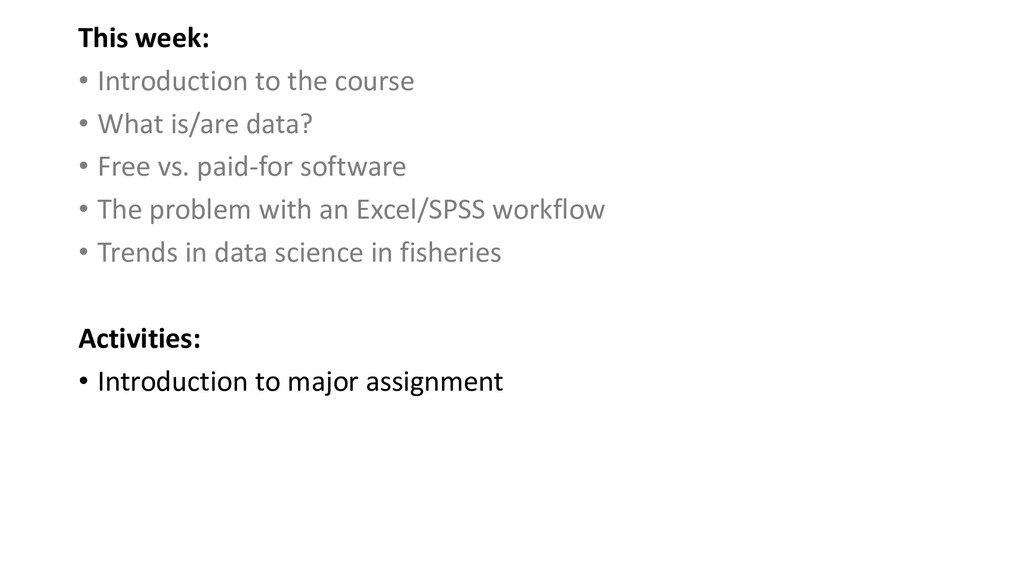
data? • Free vs. paid-for software • The problem with an Excel/SPSS workflow • Trends in data science in fisheries Activities: • Introduction to major assignment
week - Mixture of lecture, activities, and open discussion - Week will start with discussion of theory, and will progress to practice - There will be time to complete assignments in-class, but out-of-class work will be necessary too - My promise: No busywork Course website: https://mifisheriesscience.github.io/courses/6002Data I will upload slides to Speakerdeck by the Friday before class.
be here. Math, stats, etc. is hard. If you have a question – ask it! If something doesn’t make sense, ask! This is the first iteration of this course – there will be bugs! Please report them
may collect within fisheries science •Understand “Tidy data” • How to collect it • How keeping data tidy helps with analysis • How to clean up untidy data in a reproducible, transparent way (especially using dplyr) •Familiarity with best practices in recording data in the field, and preventing loss between collection and analysis Data management •Understand metadata, archiving, and how to build an efficient project workflow •Able to create and implement a data management plan •Understand how to manipulate data and prepare it for analysis • Focus: tidyverse •Understand the difference between open, community-supported software, and conventional licensed software •Able to produce reproducible, well-documented R code •Understand the concept of open data Data display •Able to communicate data visually, selecting the appropriate figure to represent data •Familiarity with both R base plots and the ggplot2 ecosystem •Ability to produce effective figures that meet journal standards for publication Workflow and security •Understand how to ask questions using minimal reproducible examples •Use R Studio’s project management tools to follow an efficient workflow •Understand how to apply basic security steps to protect your data and identity
data? • Free vs. paid-for software • The problem with an Excel/SPSS workflow • Trends in data science in fisheries Activities: • Introduction to major assignment
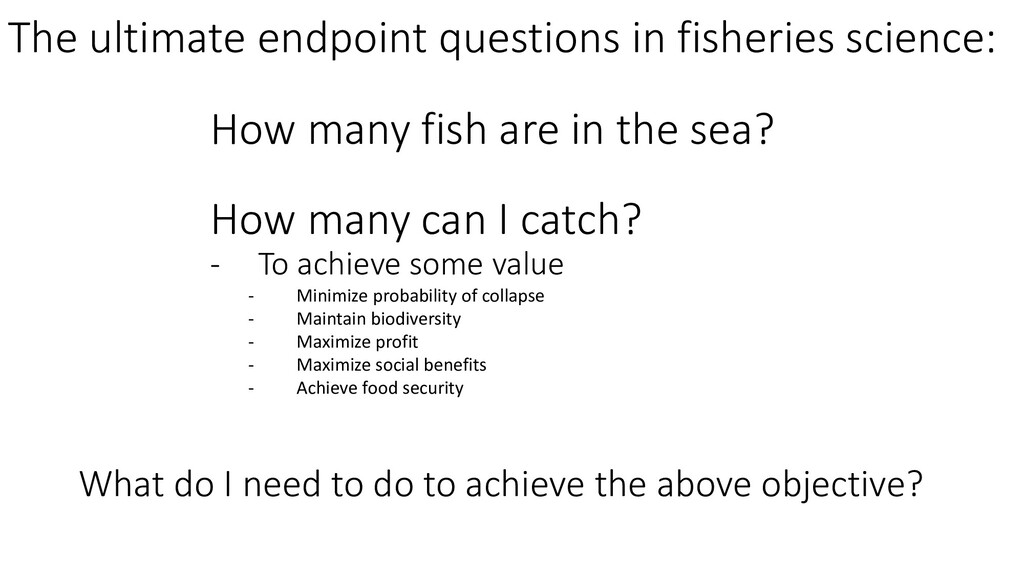
are in the sea? How many can I catch? - To achieve some value - Minimize probability of collapse - Maintain biodiversity - Maximize profit - Maximize social benefits - Achieve food security What do I need to do to achieve the above objective?
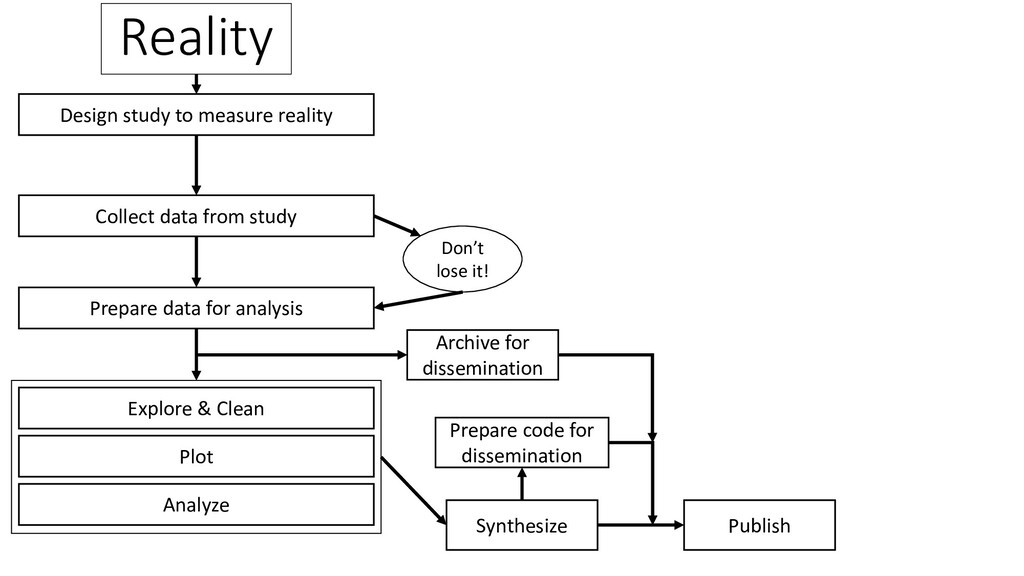
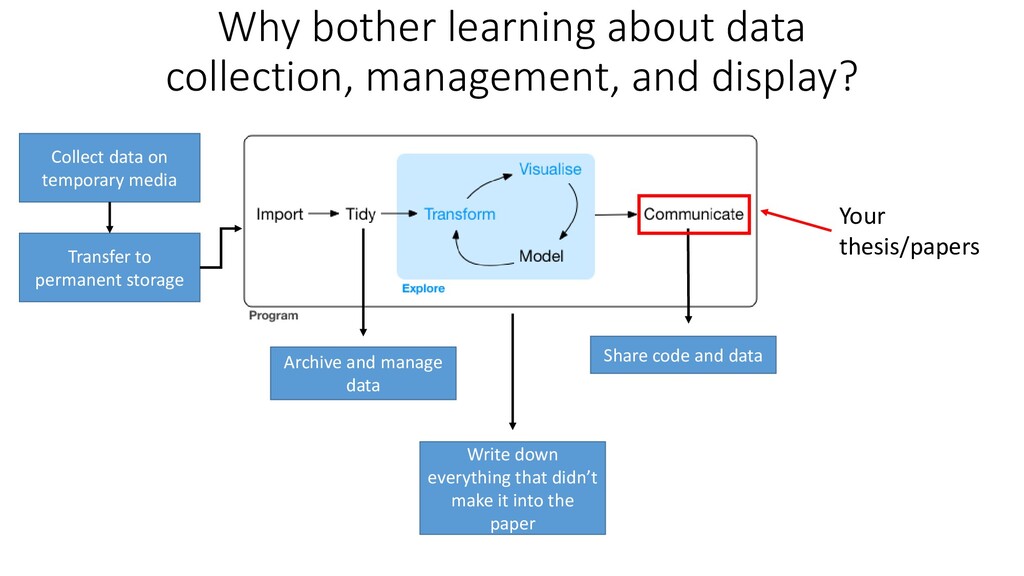
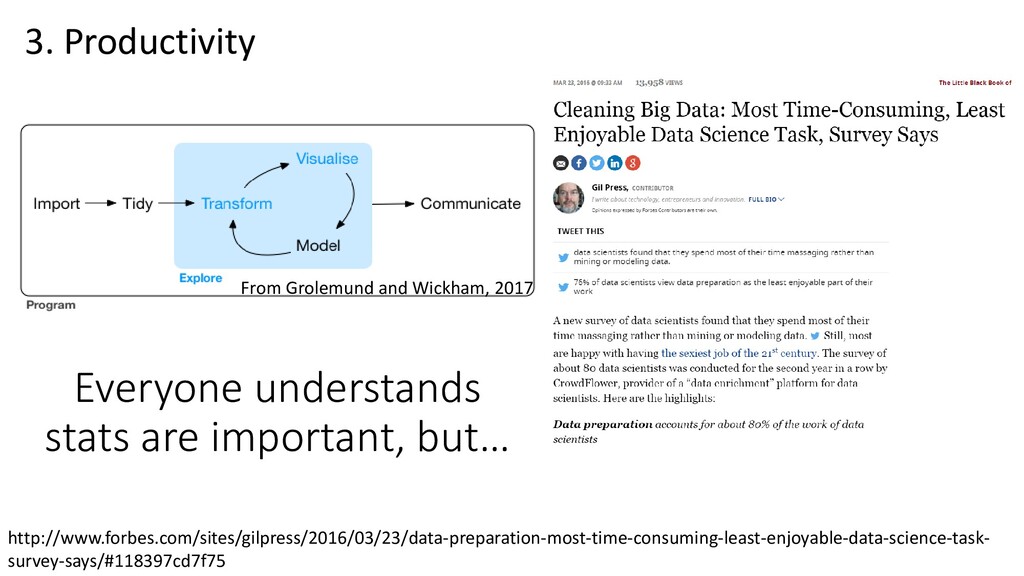
Prepare data for analysis Explore & Clean Plot Analyze Archive for dissemination Synthesize Publish Prepare code for dissemination Don’t lose it! Things in blue are covered by this course
data? • Free vs. paid-for software • The problem with an Excel/SPSS workflow • Trends in data science in fisheries Activities: • Introduction to major assignment
is the scientific paper All papers have analysis. In fisheries, most papers have statistical analysis Many classic fisheries papers live or die based on their analysis. Being able to work efficiently is key
data on temporary media Archive and manage data Write down everything that didn’t make it into the paper Share code and data Transfer to permanent storage Your thesis/papers
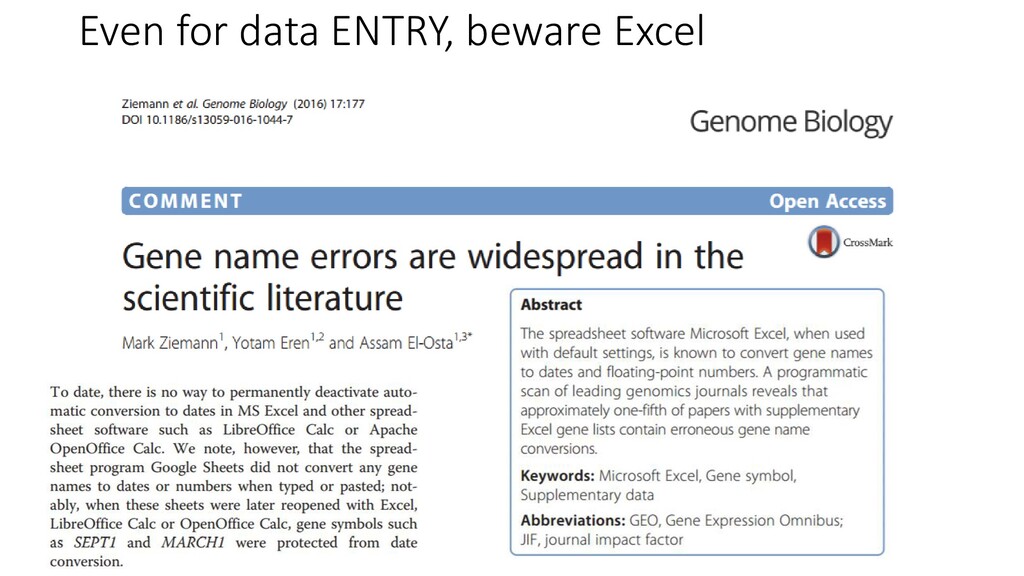
done stats in Excel? • What about SPSS, or another ‘point-and-click’ suite? • Let’s pick on Excel for a bit. • Excel calculates things incorrectly (Mccullough et al. 1999, 2002, 2005, 2008, Cryer et al. 2001, Yalta 2008) • HOWEVER: Things have started to improve with more-recent versions (Melard, 2014) • Excel’s point-and-click interface can lead to trouble. It’s easy to click the wrong thing.
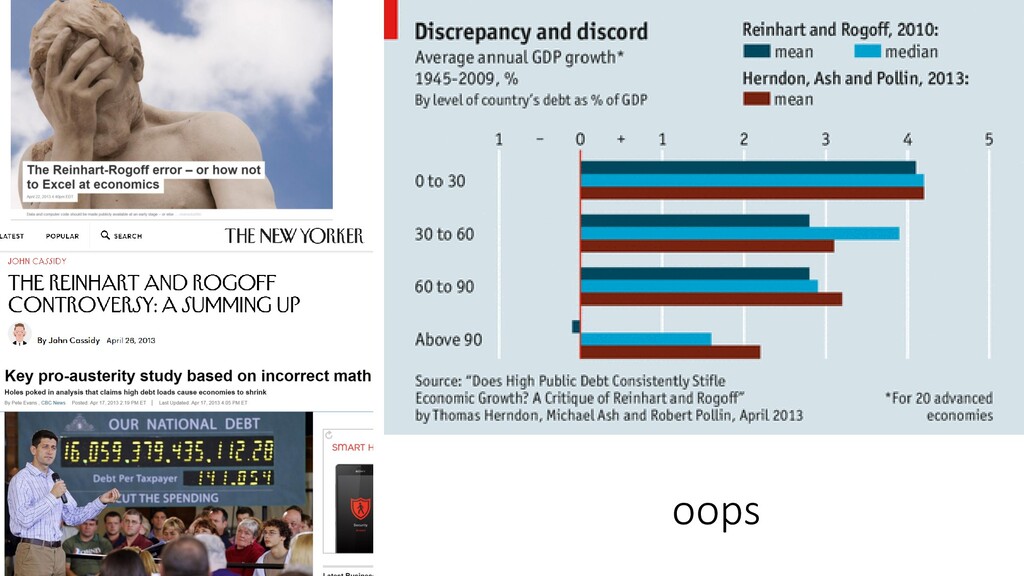
is weak for debt/GDP ratios below a threshold of 90 percent of GDP. Above 90 percent, median growth rates fall by one percent, and average growth falls considerably more. This work was featured on Fox News and shaped INTERNATIONAL policy! But…
possible by non- transparent Excel code. • Also noteworthy: The rebuttal was led by an IT-savvy graduate student. This was his first paper! Their work affected international policy debates while they were still in grad school! (You can do this too!)
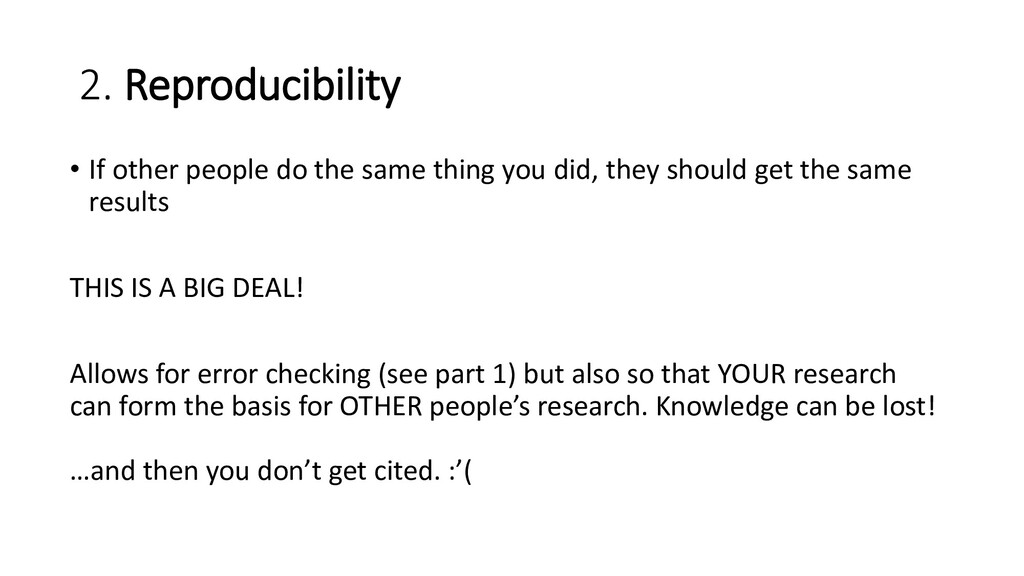
you did, they should get the same results THIS IS A BIG DEAL! Allows for error checking (see part 1) but also so that YOUR research can form the basis for OTHER people’s research. Knowledge can be lost! …and then you don’t get cited. :’(
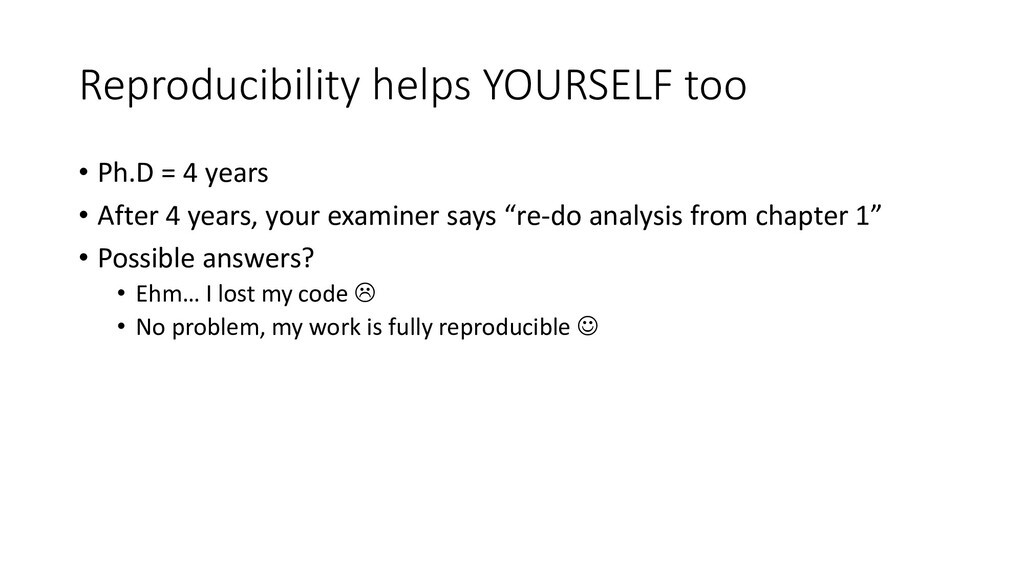
After 4 years, your examiner says “re-do analysis from chapter 1” • Possible answers? • Ehm… I lost my code • No problem, my work is fully reproducible ☺
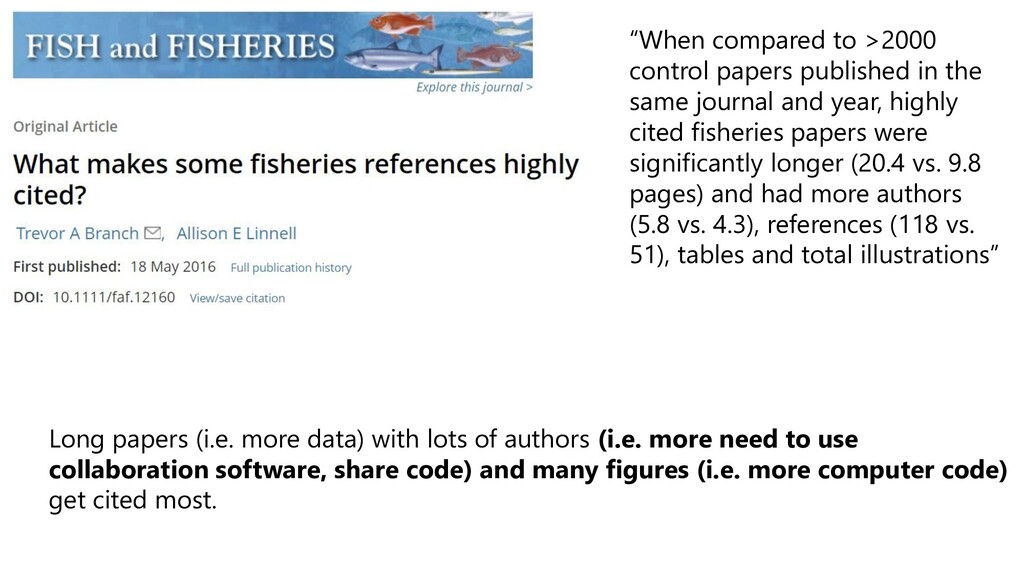
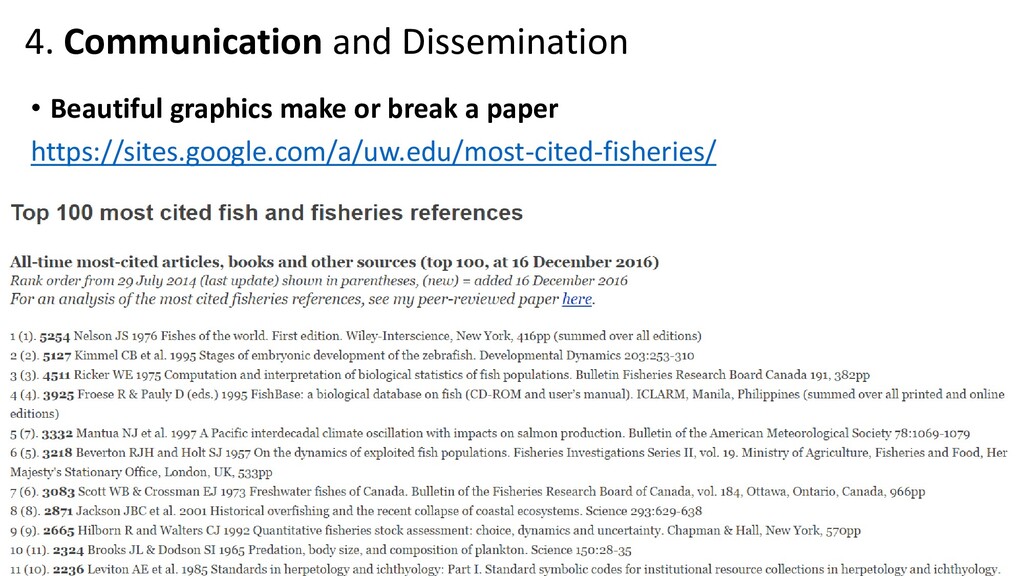
journal and year, highly cited fisheries papers were significantly longer (20.4 vs. 9.8 pages) and had more authors (5.8 vs. 4.3), references (118 vs. 51), tables and total illustrations” Long papers (i.e. more data) with lots of authors (i.e. more need to use collaboration software, share code) and many figures (i.e. more computer code) get cited most.
on it 3.ability to recognize a worthwhile result 4.ability to make a decision as to when to stop and write up the results 5.ability to write adequately 6.ability to profit constructively from criticism 7.determination to submit the paper to a journal 8.persistence in making changes (if necessary as a result of journal action). Read: https://dynamicecology.wordpress.com/2014/01/23/william-shockley-on-what-makes-a-person- write-a-lot-of-papers-and-the-superstar-researcher-system/ What makes a prolific scientist? “If one person is 50% above average in each of the 8 areas then they will be 2460% more productive than average at the total process”
on anthropogenic global warming (AGW), 97 % endorse AGW. What is happening with the 2 % of papers that reject AGW? We examine a selection of papers rejecting AGW. An analytical tool has been developed to replicate and test the results and methods used in these studies; our replication reveals a number of methodological flaws, and a pattern of common mistakes emerges that is not visible when looking at single isolated cases. ... A common denominator seems to be missing contextual information or ignoring information that does not fit the conclusions, be it other relevant work or related geophysical data. ... The merit of replication is highlighted and we discuss how the quality of the scientific literature may benefit from replication. https://link.springer.com/article/10.1007/s00704-015-1597-5
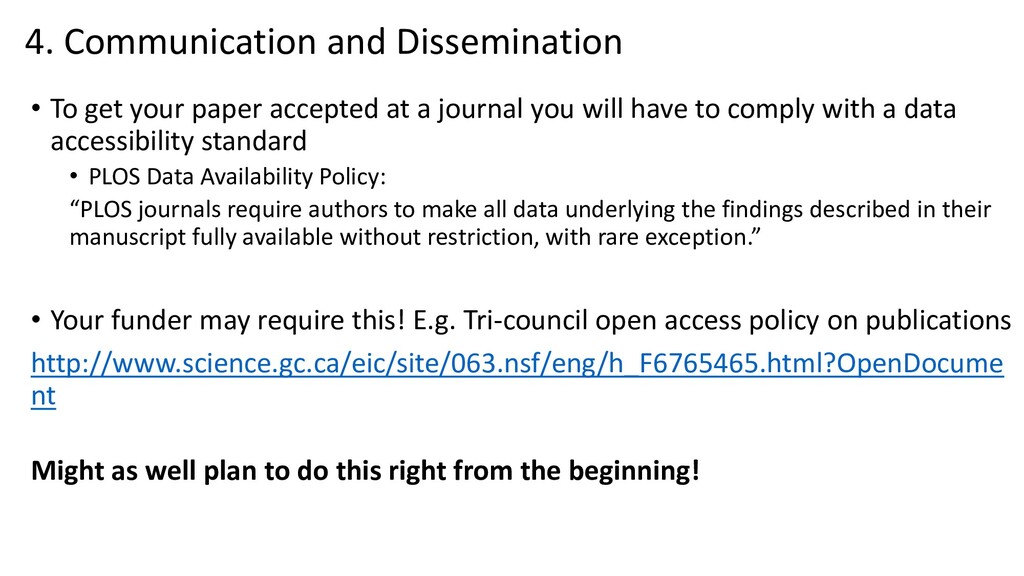
at a journal you will have to comply with a data accessibility standard • PLOS Data Availability Policy: “PLOS journals require authors to make all data underlying the findings described in their manuscript fully available without restriction, with rare exception.” • Your funder may require this! E.g. Tri-council open access policy on publications http://www.science.gc.ca/eic/site/063.nsf/eng/h_F6765465.html?OpenDocume nt Might as well plan to do this right from the beginning!
data? • Free vs. paid-for software • The problem with an Excel/SPSS workflow • Trends in data science in fisheries Activities: • Introduction to major assignment
figures (using GraphClick, DataThief, or other method), pulling directly from online database, bringing your own etc. • Produce metadata file summarizing the data • Create a well-organized R Project folder • Collect raw data files in CSV format • Due: end of week 4 Selecting the right dataset is important. • Manipulate (20%) • Produce two tidy CSV files, one in long-format and one in wide-format • Provide fully-commented R code • Due: End of week 8
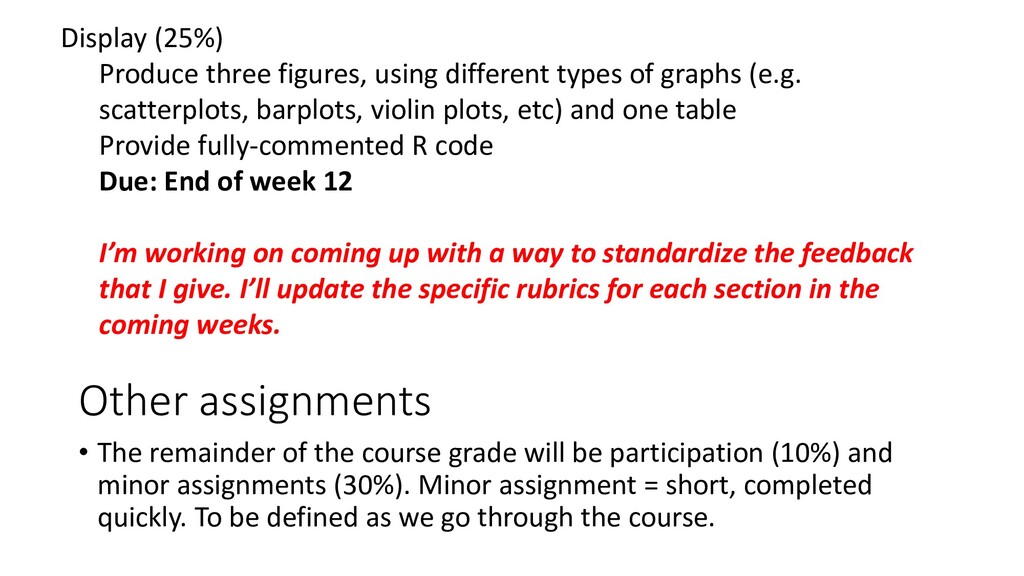
be participation (10%) and minor assignments (30%). Minor assignment = short, completed quickly. To be defined as we go through the course. Display (25%) Produce three figures, using different types of graphs (e.g. scatterplots, barplots, violin plots, etc) and one table Provide fully-commented R code Due: End of week 12 I’m working on coming up with a way to standardize the feedback that I give. I’ll update the specific rubrics for each section in the coming weeks.