= μ ij Log(μ ij ) = GearType ij + Temperature ij + FleetDeployment i FleetDeployment i ~ N(0, σ2) Using lme4: m <- glmer(CatchRate ~ GearType + Temperature + (1 | FleetDeployment), family = poisson) FISH 6003 FISH 6003: Statistics and Study Design for Fisheries Brett Favaro 2017 This work is licensed under a Creative Commons Attribution 4.0 International License
in which we gather as the ancestral homelands of the Beothuk, and the island of Newfoundland as the ancestral homelands of the Mi’kmaq and Beothuk. We would also like to recognize the Inuit of Nunatsiavut and NunatuKavut and the Innu of Nitassinan, and their ancestors, as the original people of Labrador. We strive for respectful partnerships with all the peoples of this province as we search for collective healing and true reconciliation and honour this beautiful land together. http://www.mun.ca/aboriginal_affairs/
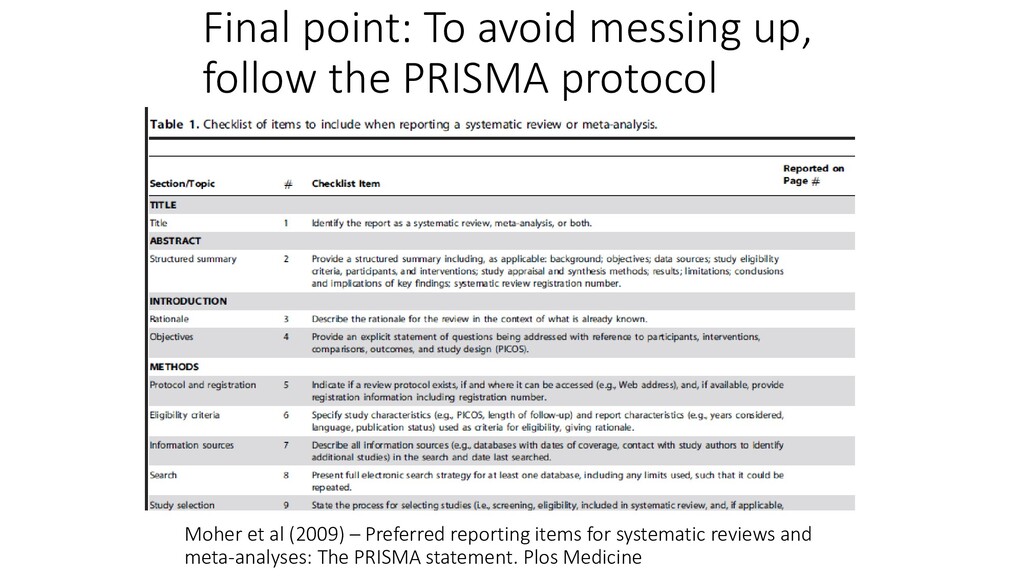
“Meta-analysis” • Effect size, and common types of meta-analysis • PRISMA reporting protocols • Executing an Meta-analysis in R • Getting data • Analysing it • Plotting it
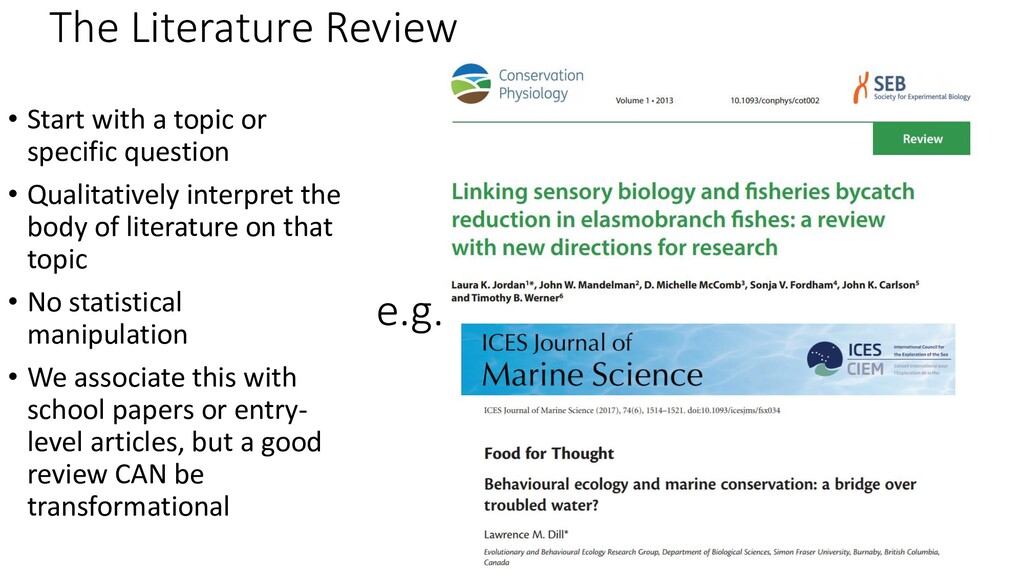
interpret the body of literature on that topic • No statistical manipulation • We associate this with school papers or entry- level articles, but a good review CAN be transformational The Literature Review e.g.
of papers SUPPORT anthropogenic global warming? • Tally studies that support, refute, and take no position on your question • Commonly seen in intros and discussions as a “throwaway” line • People still do these, but they rarely stand alone Result: 32.6% of papers support AGW 0.7% reject 66.4% no position 0.3% uncertain cause Of papers that expressed a position 97.2% support AGW
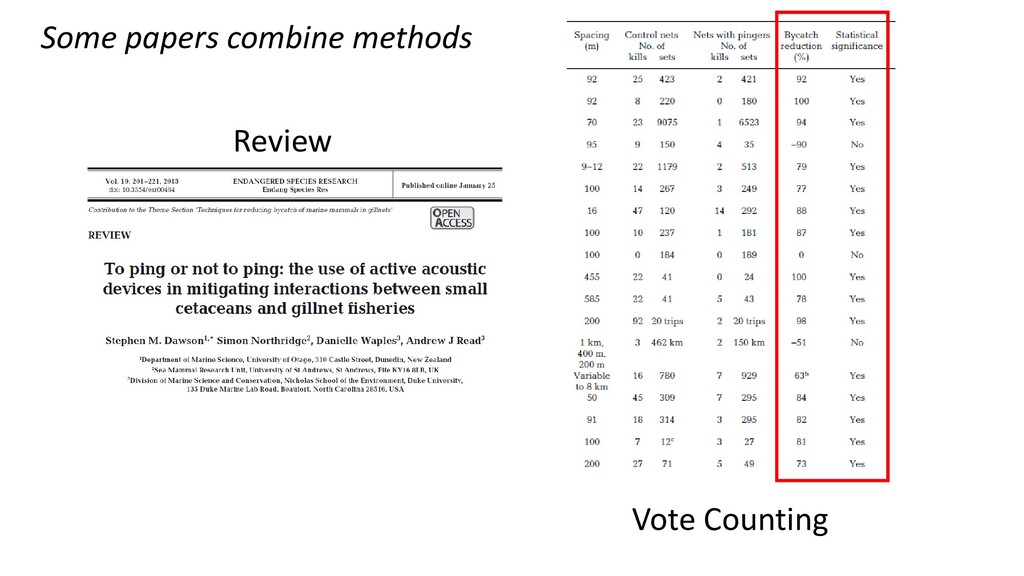
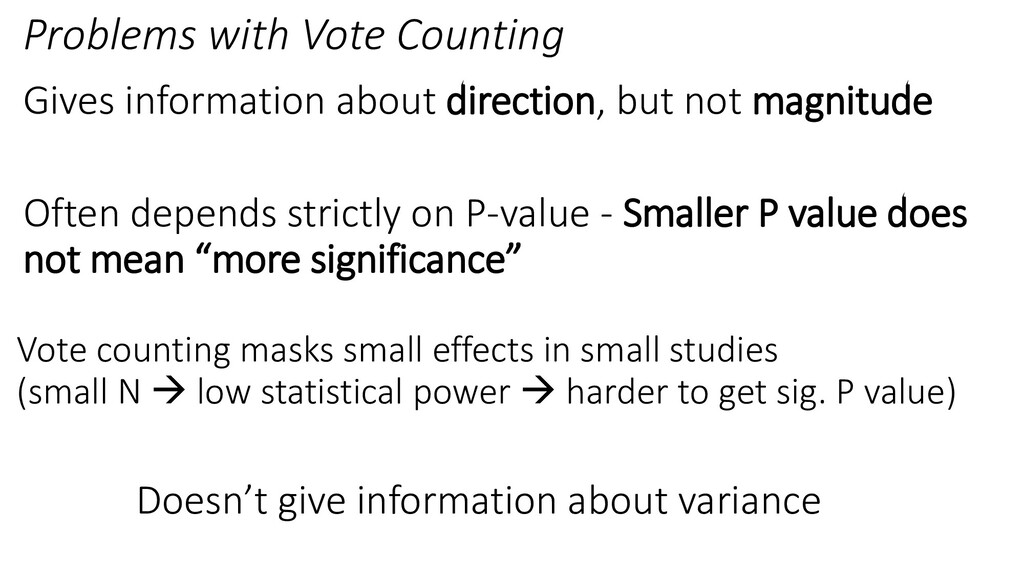
magnitude Often depends strictly on P-value - Smaller P value does not mean “more significance” Vote counting masks small effects in small studies (small N → low statistical power → harder to get sig. P value) Doesn’t give information about variance
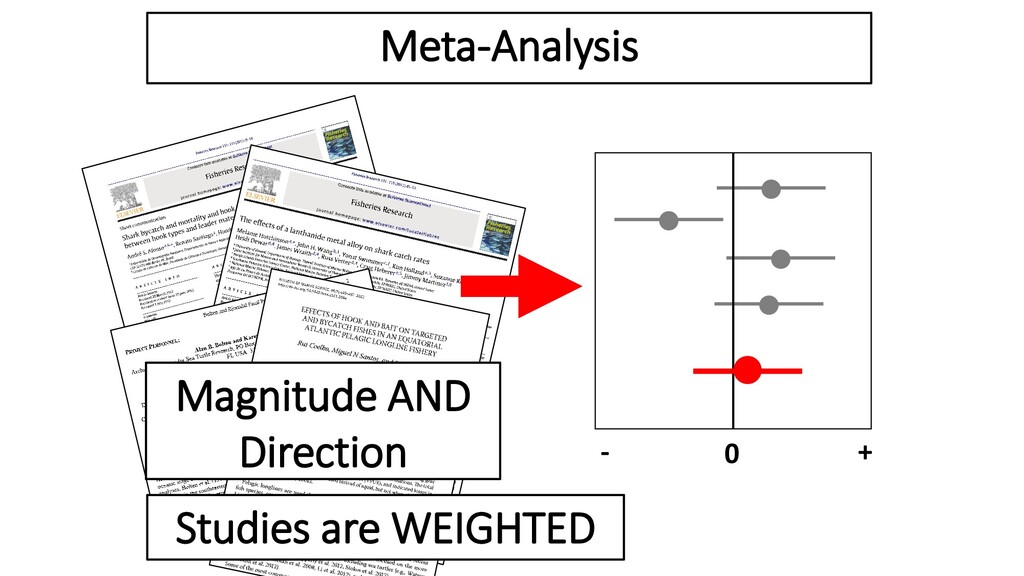
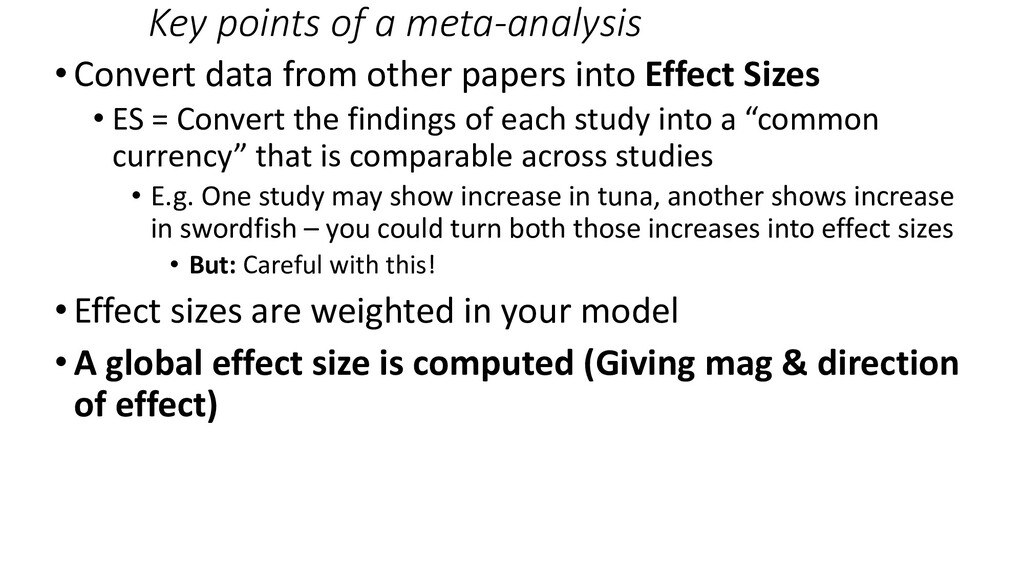
papers into Effect Sizes • ES = Convert the findings of each study into a “common currency” that is comparable across studies • E.g. One study may show increase in tuna, another shows increase in swordfish – you could turn both those increases into effect sizes • But: Careful with this! • Effect sizes are weighted in your model • A global effect size is computed (Giving mag & direction of effect)
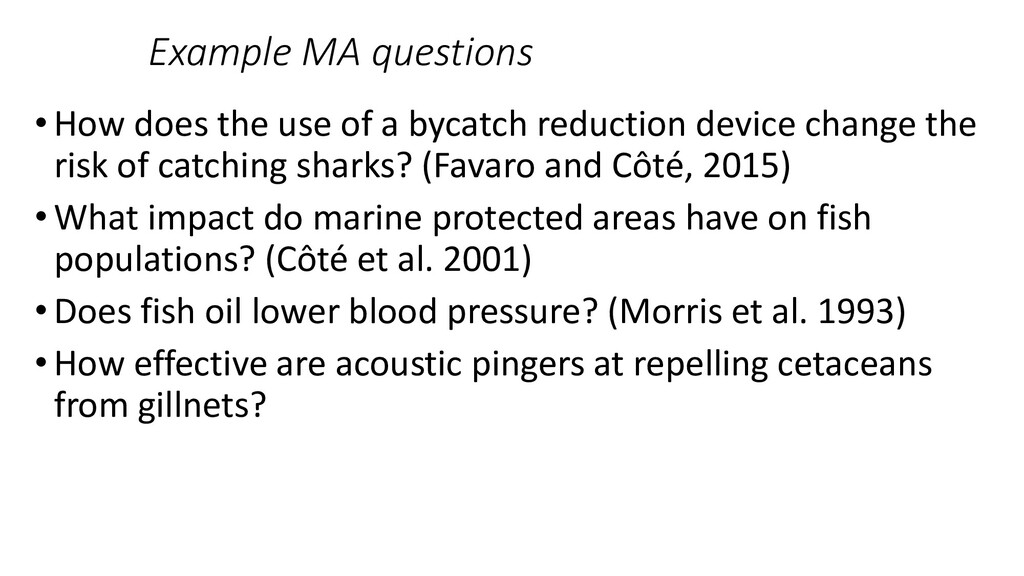
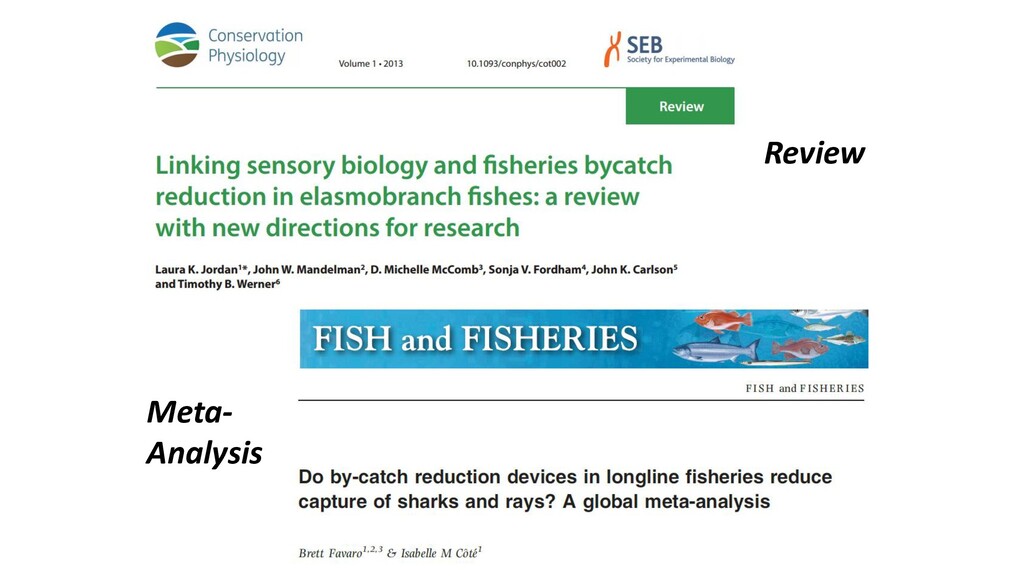
the risk of catching sharks? (Favaro and Côté, 2015) •What impact do marine protected areas have on fish populations? (Côté et al. 2001) •Does fish oil lower blood pressure? (Morris et al. 1993) •How effective are acoustic pingers at repelling cetaceans from gillnets? Example MA questions
effectiveness of a treatment • When there is variability across studies, use MA to determine how “well” something actually works • To resolve disagreements in the literature • When there are contradictory findings (i.e. studies are published that say “fish oil works” AND “it doesn’t work”)
effectiveness of a treatment • When there is variability across studies, use MA to determine how “well” something actually works • To resolve disagreements in the literature • When there are contradictory findings (i.e. studies are published that say “fish oil works” AND “it doesn’t work”) • To identify the variables that underlie processes across studies
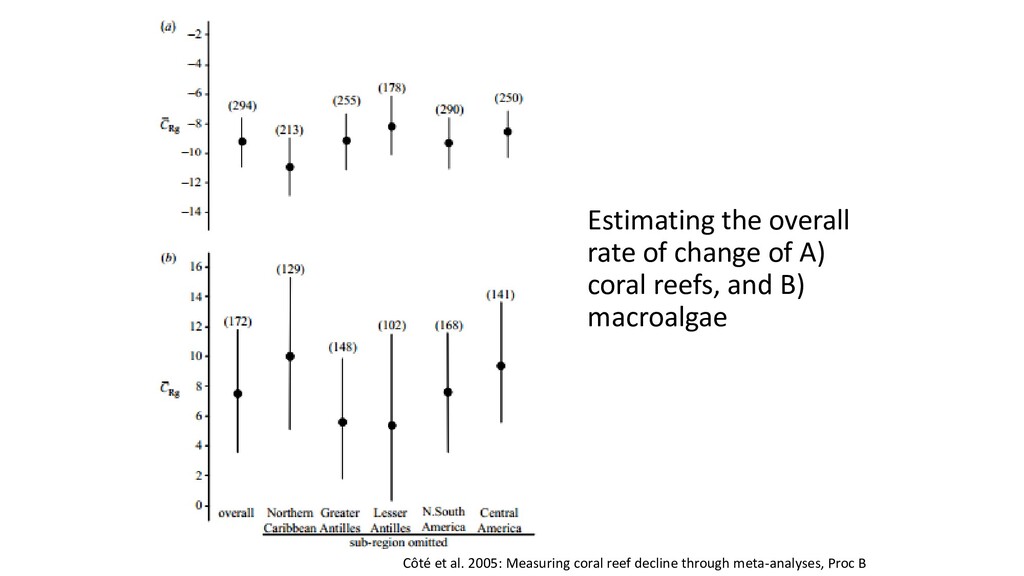
fish populations: a global meta-analysis (J. App. Ecol) You can plot effect sizes against variables of interest • Identify variables that underlie processes across studies
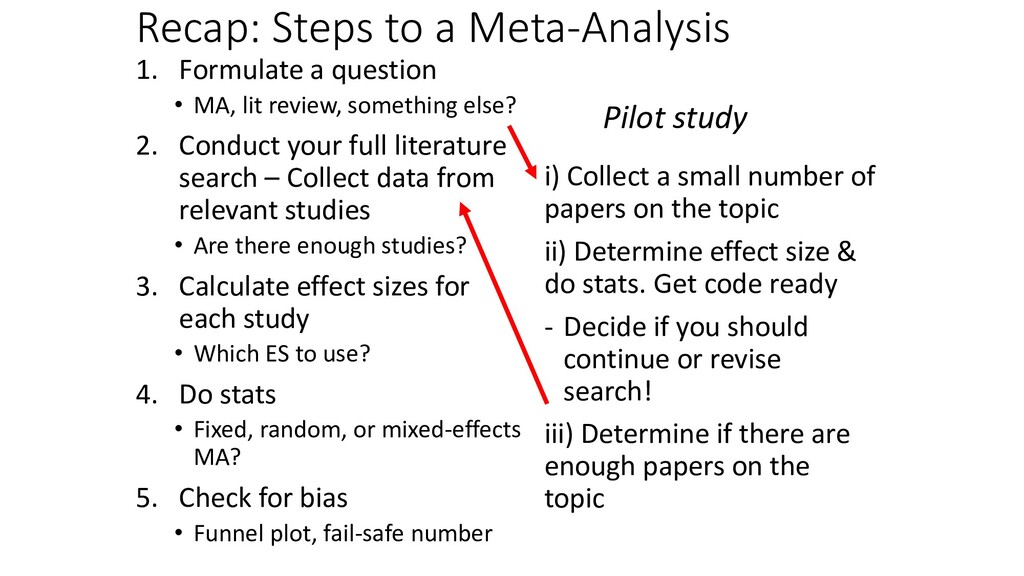
lit review, something else? 2. Conduct your full literature search – Collect data from relevant studies • Are there enough studies? 3. Calculate effect sizes for each study • Which ES to use? 4. Do stats • Fixed, random, or mixed-effects MA? 5. Check for bias • Funnel plot, fail-safe number i) Collect a small number of papers on the topic ii) Determine effect size & do stats. Get code ready - Decide if you should continue or revise search! iii) Determine if there are enough papers on the topic Pilot study
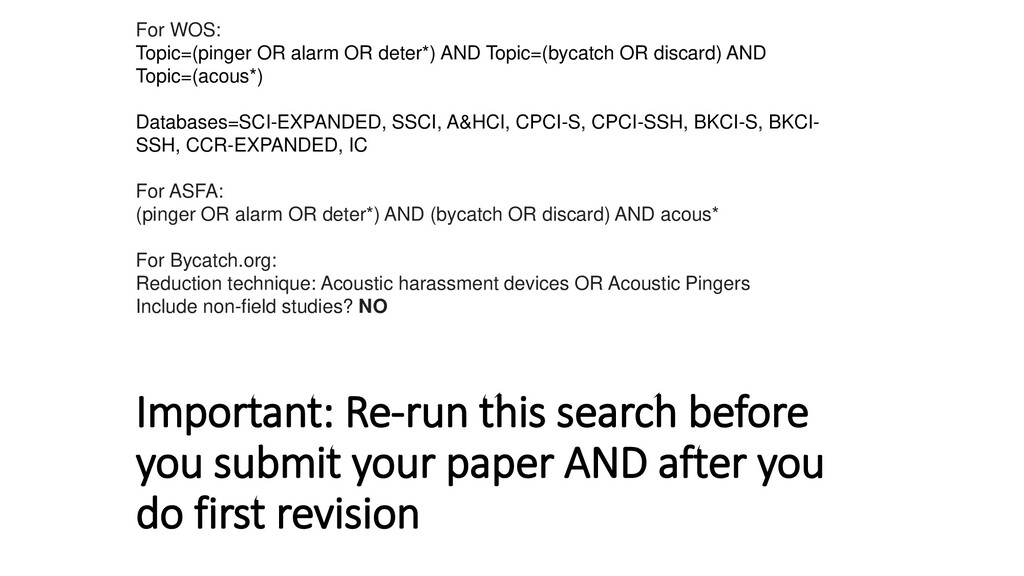
a SYSTEMATIC literature review That means: - Set keywords - Search relevant databases, usually several - Common to marine bio: Web of Science, Aquatic Science Fisheries Abstracts (ASFA), question-specific databases (e.g. Bycatch.org for fishing gear tech) - Should be broad, but not too broad
discard) AND Topic=(acous*) Databases=SCI-EXPANDED, SSCI, A&HCI, CPCI-S, CPCI-SSH, BKCI-S, BKCI- SSH, CCR-EXPANDED, IC For ASFA: (pinger OR alarm OR deter*) AND (bycatch OR discard) AND acous* For Bycatch.org: Reduction technique: Acoustic harassment devices OR Acoustic Pingers Include non-field studies? NO Important: Re-run this search before you submit your paper AND after you do first revision
for effect size calculations: require(metafor) ?escalc Common: 2x2 table data: Relative risk or odds ratio Comparison of means: Hedges d, response ratio There are MANY ways to express an effect size. The correct method depends on the data you’re analyzing
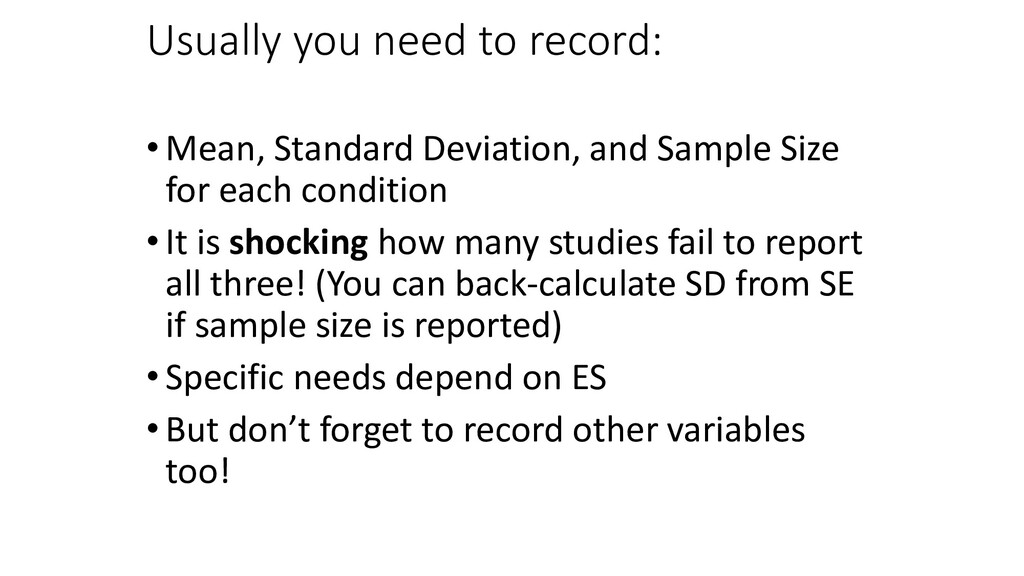
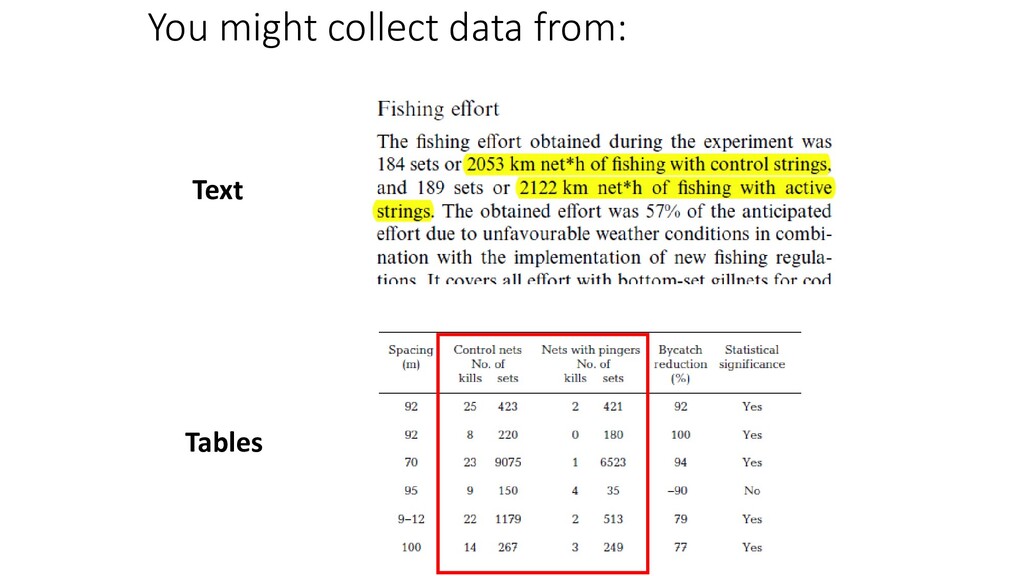
Sample Size for each condition • It is shocking how many studies fail to report all three! (You can back-calculate SD from SE if sample size is reported) • Specific needs depend on ES • But don’t forget to record other variables too!
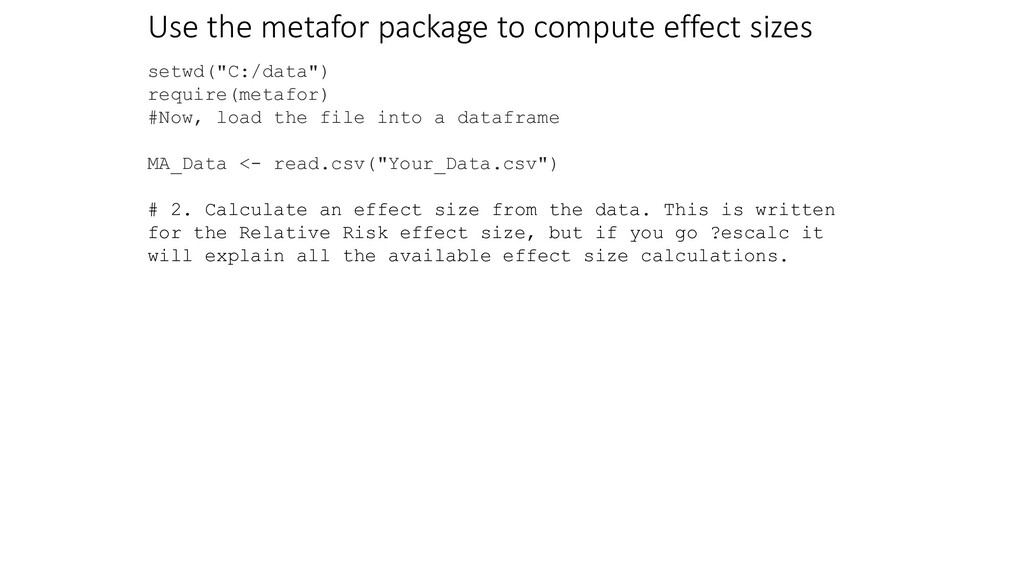
#Now, load the file into a dataframe MA_Data <- read.csv("Your_Data.csv") # 2. Calculate an effect size from the data. This is written for the Relative Risk effect size, but if you go ?escalc it will explain all the available effect size calculations.
should I use? Depends on Y Continuous: Mean Difference Standardized Mean Difference (0 = no effect) Response Ratio Probability of an event occurring: (e.g. Catch a fish or not? Catch a disease or not?) Relative Risk Odds ratio
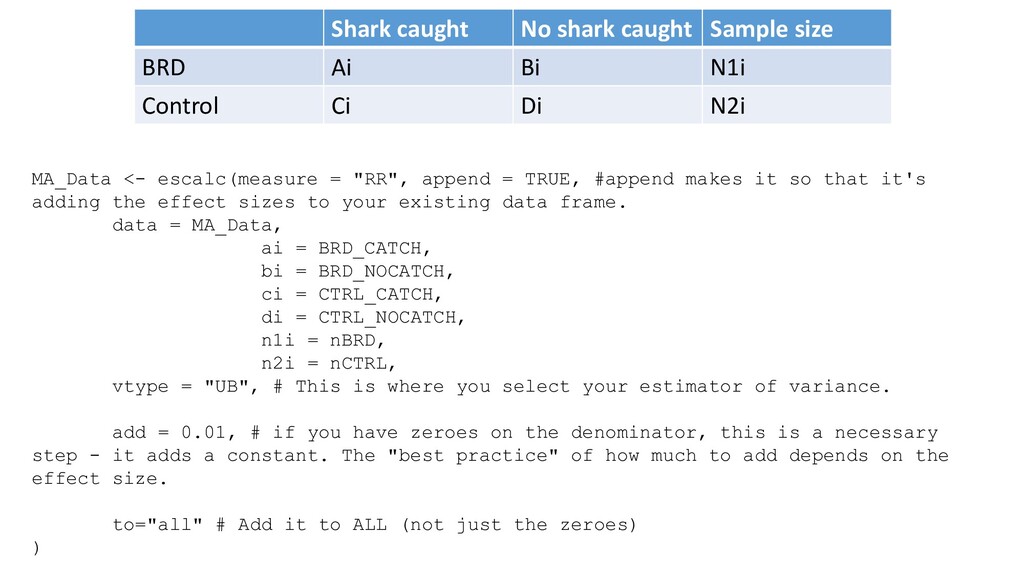
it so that it's adding the effect sizes to your existing data frame. data = MA_Data, ai = BRD_CATCH, bi = BRD_NOCATCH, ci = CTRL_CATCH, di = CTRL_NOCATCH, n1i = nBRD, n2i = nCTRL, vtype = "UB", # This is where you select your estimator of variance. add = 0.01, # if you have zeroes on the denominator, this is a necessary step - it adds a constant. The "best practice" of how much to add depends on the effect size. to="all" # Add it to ALL (not just the zeroes) ) Shark caught No shark caught Sample size BRD Ai Bi N1i Control Ci Di N2i
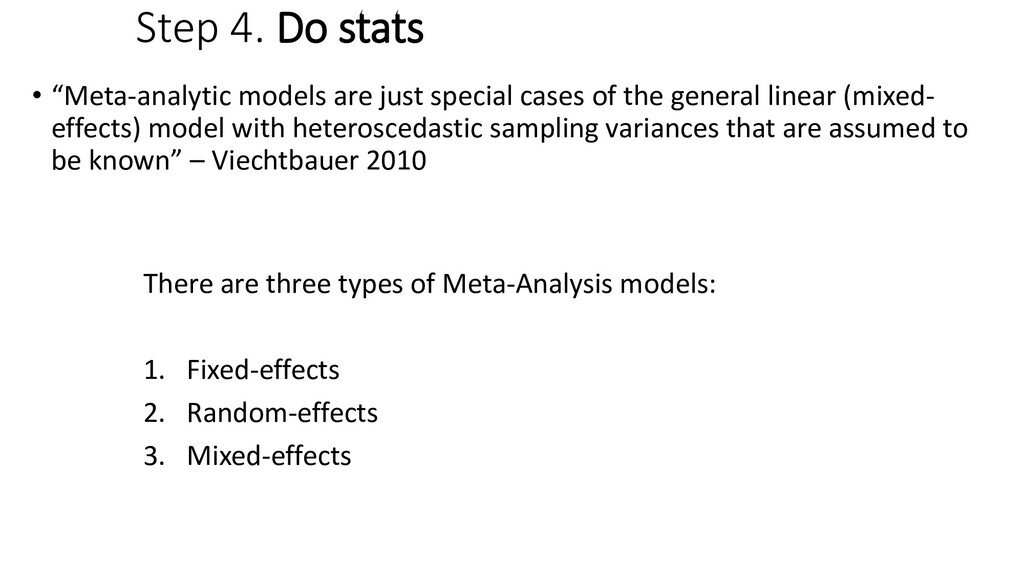
cases of the general linear (mixed- effects) model with heteroscedastic sampling variances that are assumed to be known” – Viechtbauer 2010 There are three types of Meta-Analysis models: 1. Fixed-effects 2. Random-effects 3. Mixed-effects
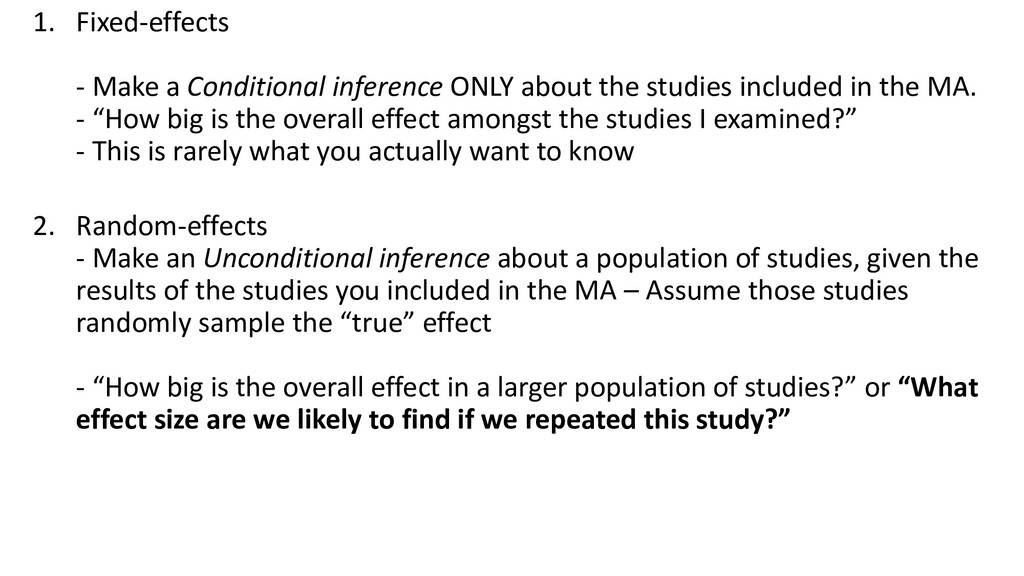
studies included in the MA. - “How big is the overall effect amongst the studies I examined?” - This is rarely what you actually want to know 2. Random-effects - Make an Unconditional inference about a population of studies, given the results of the studies you included in the MA – Assume those studies randomly sample the “true” effect - “How big is the overall effect in a larger population of studies?” or “What effect size are we likely to find if we repeated this study?”
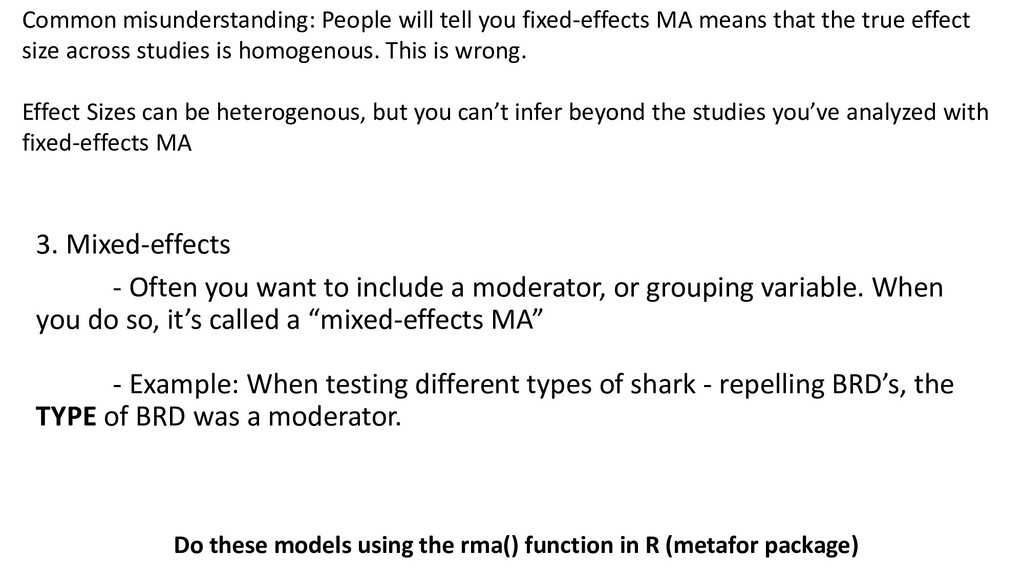
or grouping variable. When you do so, it’s called a “mixed-effects MA” - Example: When testing different types of shark - repelling BRD’s, the TYPE of BRD was a moderator. Common misunderstanding: People will tell you fixed-effects MA means that the true effect size across studies is homogenous. This is wrong. Effect Sizes can be heterogenous, but you can’t infer beyond the studies you’ve analyzed with fixed-effects MA Do these models using the rma() function in R (metafor package)
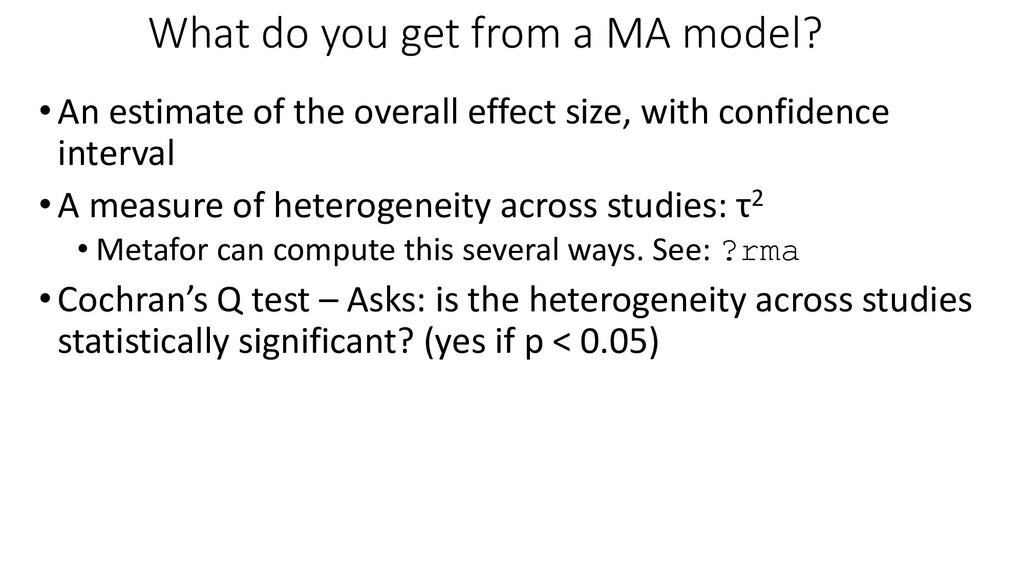
of the overall effect size, with confidence interval •A measure of heterogeneity across studies: τ2 • Metafor can compute this several ways. See: ?rma •Cochran’s Q test – Asks: is the heterogeneity across studies statistically significant? (yes if p < 0.05)
is okay if: - The existence of heterogeneity is itself interesting (e.g. if something is supposed to work the same way across contexts, but doesn’t, that is interesting) Significant unexplained heterogeneity is bad if: - You want to make a statement about the overall effectiveness of a treatment
non-significant findings would have to exist, but not be included in this MA, to reverse my result?” ?fsn Three computational methods: Rosenthal, Orwin, Rosenberg FSN should be high if your result is robust. Rosenberg is the good one More info: Rosenberg (2005) – The file-drawer problem revisited: A general weighted method for calculating fail-safe numbers in meta-analysis. Evolution 59(2): 464-468
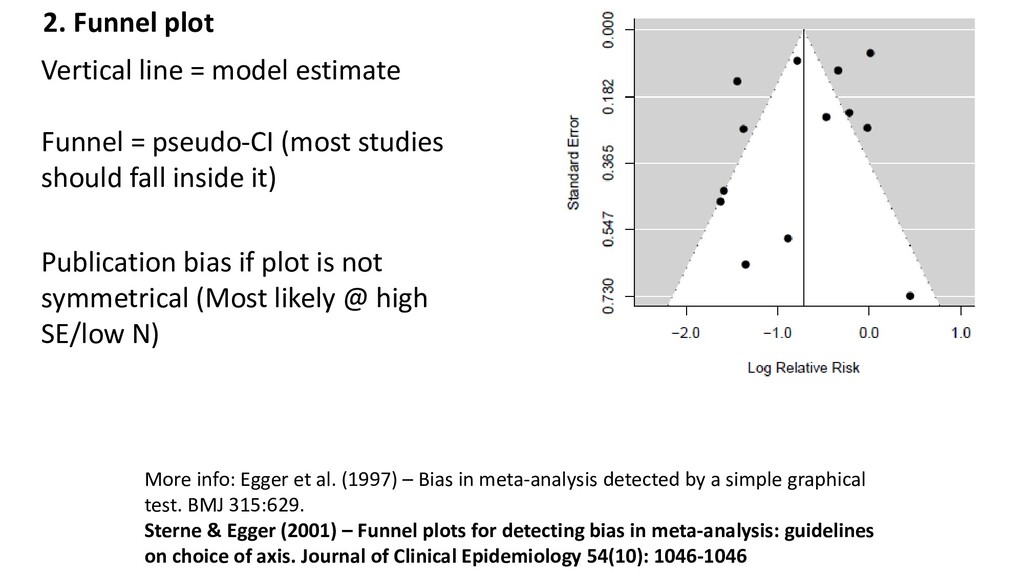
Bias in meta-analysis detected by a simple graphical test. BMJ 315:629. Sterne & Egger (2001) – Funnel plots for detecting bias in meta-analysis: guidelines on choice of axis. Journal of Clinical Epidemiology 54(10): 1046-1046 Vertical line = model estimate Funnel = pseudo-CI (most studies should fall inside it) Publication bias if plot is not symmetrical (Most likely @ high SE/low N)
MA, lit review, something else? 2. Conduct your full literature search – Collect data from relevant studies • Are there enough studies? 3. Calculate effect sizes for each study • Which ES to use? 4. Do stats • Fixed, random, or mixed-effects MA? 5. Check for bias • Funnel plot, fail-safe number i) Collect a small number of papers on the topic ii) Determine effect size & do stats. Get code ready - Decide if you should continue or revise search! iii) Determine if there are enough papers on the topic Pilot study