Upgrade to Pro — share decks privately, control downloads, hide ads and more …

Dtrace

Sponsored · Your Podcast. Everywhere. Effortlessly. Share. Educate. Inspire. Entertain. You do you. We'll handle the rest.
Avatar for fraosug fraosug
March 17, 2013

 Dtrace

Avatar for fraosug

fraosug

March 17, 2013
Tweet

More Decks by fraosug

Other Decks in Technology

Transcript

  1. 2 Agenda • Why Dtrace? • Difference of Debugger and

    truss/strace • How does Dtrace work? • Examples • Where is Dtrace?
  2. 3 Processor Processor OS OS App Shrink-Wrap Solari s Sparc

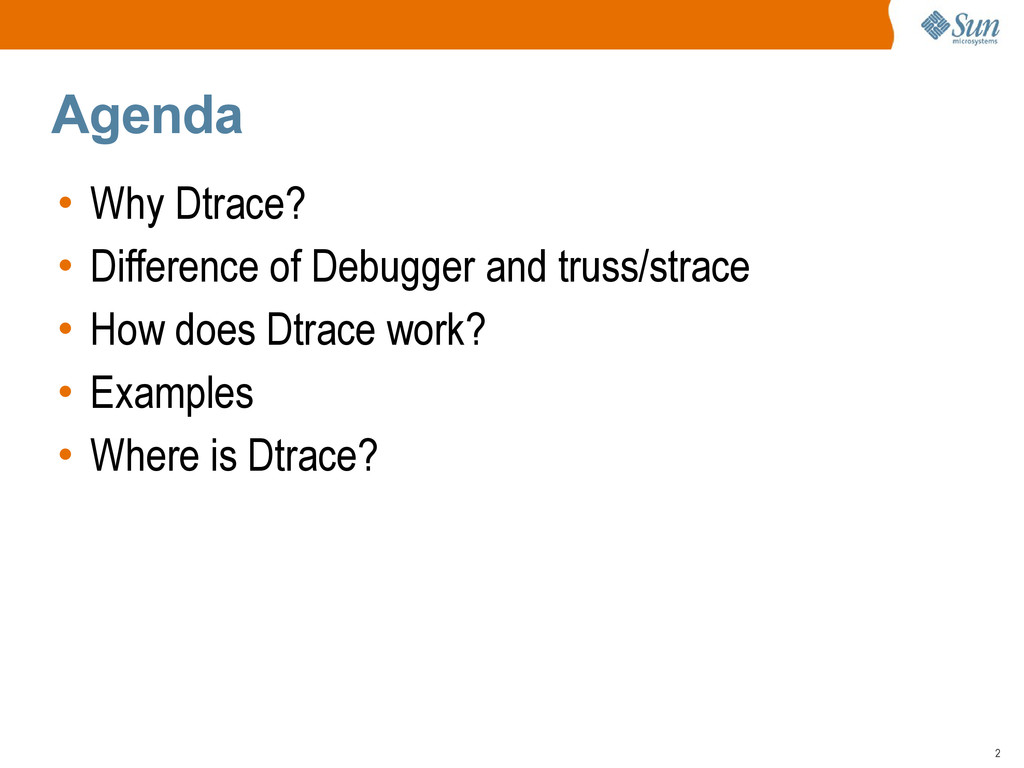
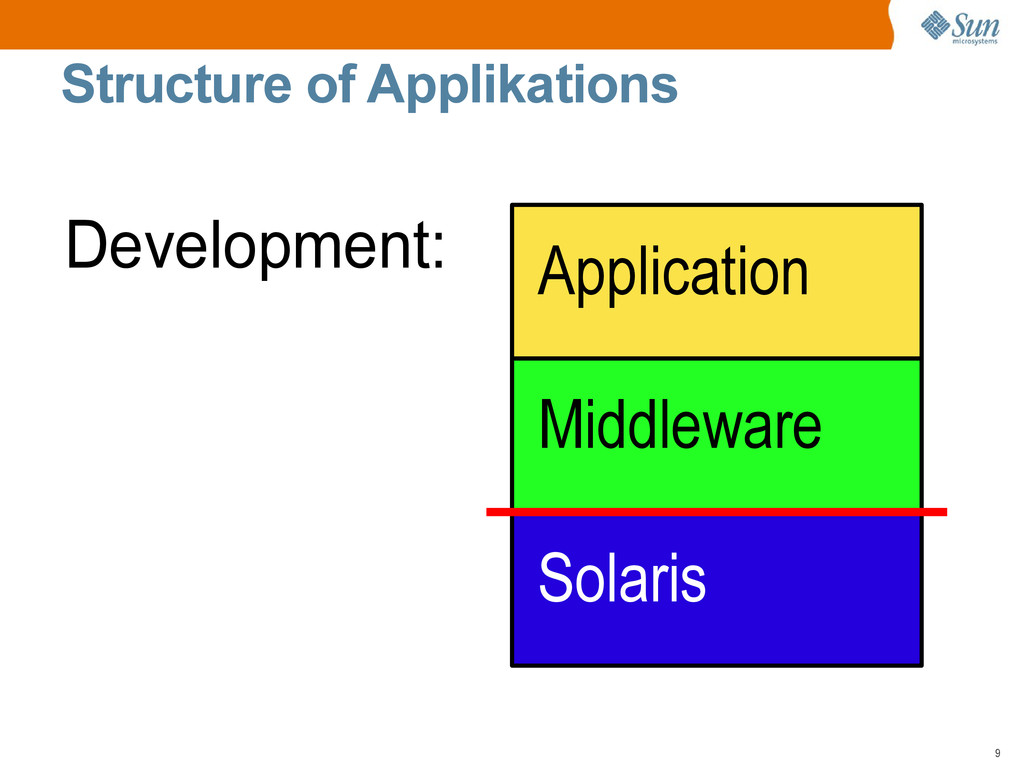
    Linux x86 VM S VAX MV S 370 AIX Power MAC OS Power Irix MIPS HP-UX Precision DGU X 88K OS40 0 AS400 Window s x86 Ultrix Alpha Aegis 68K 1 to 100 users One SW instance = one HW Traditional Software Architecture
  3. 4 Shrink-Wrap Solari s Sparc Linux x86 VM S VAX

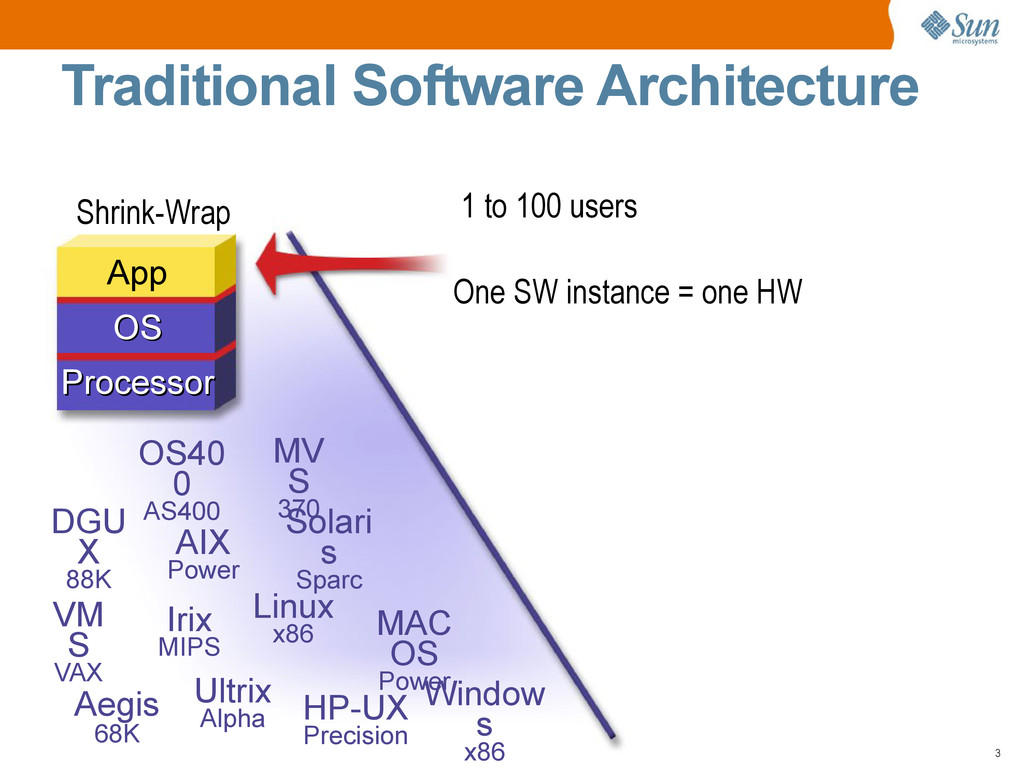
    MV S 370 AIX Power MAC OS Power HP-UX Precision DGU X 88K OS40 0 AS400 Comp MW MW Comp MW MW Comp MW MW Comp MW MW Windows x86 Ultrix Alpha Aegis 68K networked components Processor Processor O/S O/S App 1000 to millions of users Irix MIPS New Architecture
  4. 5 Supervision of Applications Applications shared use of Ressources >

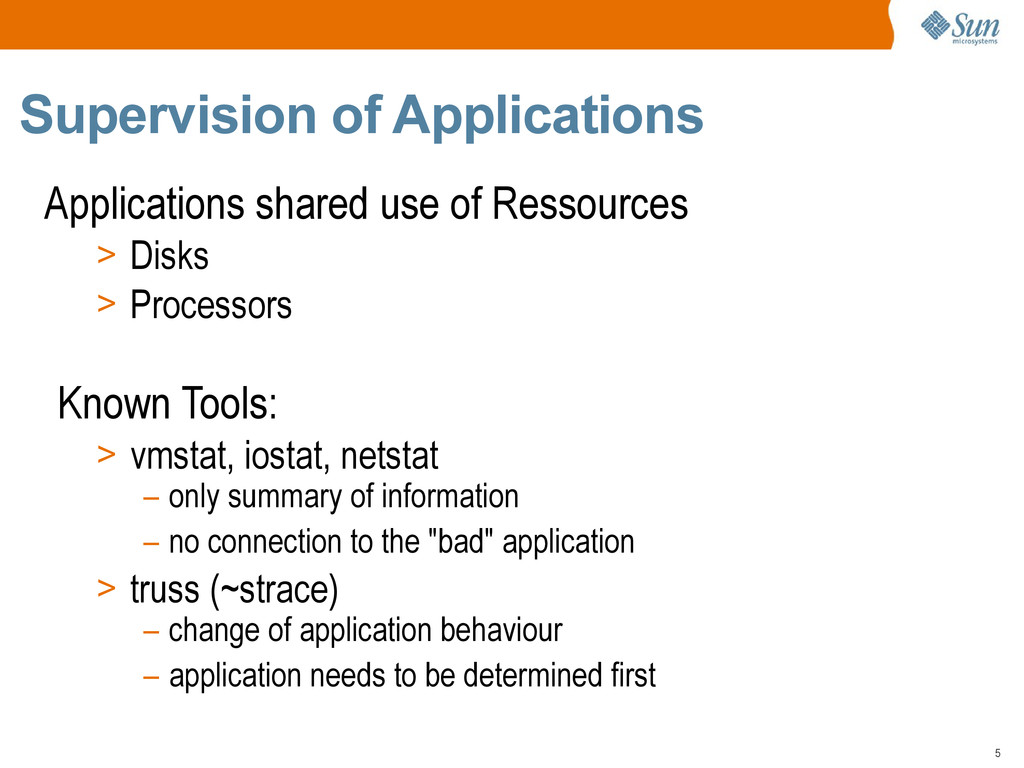
    Disks > Processors Known Tools: > vmstat, iostat, netstat – only summary of information – no connection to the "bad" application > truss (~strace) – change of application behaviour – application needs to be determined first
  5. 6 New Concept: Dtrace Follow on to: kstat > kstat

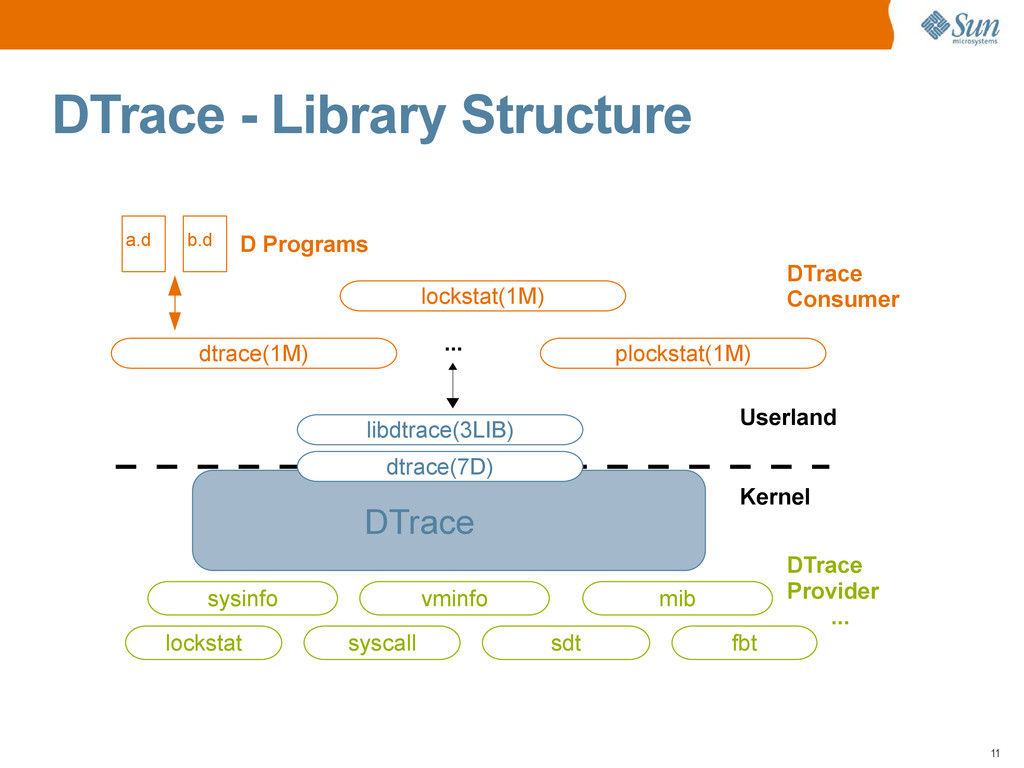
    reads Kernel statistics > base of lots of *stat commands (iostat, vmstat, ...) dtrace parts > User-Interface: dtrace-command(uses libdtrace) > Probes inside of the system code (or user application) > Buffer between probes and user level program dtrace algorithm > dtrace program activates probes and alloctates buffer > dtrace reads from buffers and analyzes data
  6. 7 Dtrace - Dynamic Tracing • Analysis, Diagnosis, Tuning •

    Secure, covering system and applications > Non-invasive > Low Overhead > View from the system covering all Applications > Lots of probes (> 40000 depending on modules and hardware) • Production safe > Reproduction of problems on a safe system is not necessary > Difficult postmortem debugging unnecessary > No special kernel or boot (like with kadb) • Reduces cost > Solution in a short time: examples with 3-300x speedup > Protocols about nearly any system information
  7. 8 Comparison: Dtrace vs. Debugger Debugger (adb, mdb, gdb, truss,

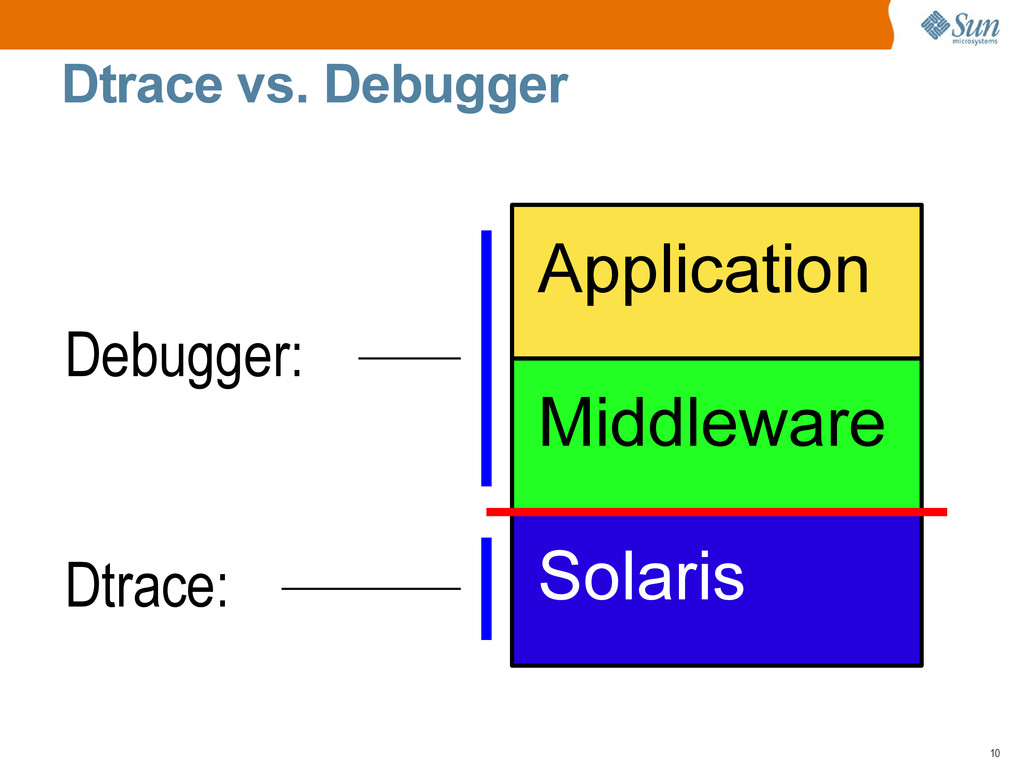
    strace, ...) • View from the application • Only in Userland • synchronous (program slowdown) Dtrace • View from OS • Probes in all kernel modules and programs • Association to applikations • asynchronous
  8. 11 DTrace - Library Structure dtrace(1M) lockstat(1M) plockstat(1M) libdtrace(3LIB) dtrace(7D)

    DTrace Userland Kernel DTrace Consumer sysinfo vminfo mib sdt syscall fbt lockstat DTrace Provider ... a.d b.d ... D Programs
  9. 12 Dtrace - Example Dtrace > Probes: <provider>:<modul>:<function>:<name> > Condition:

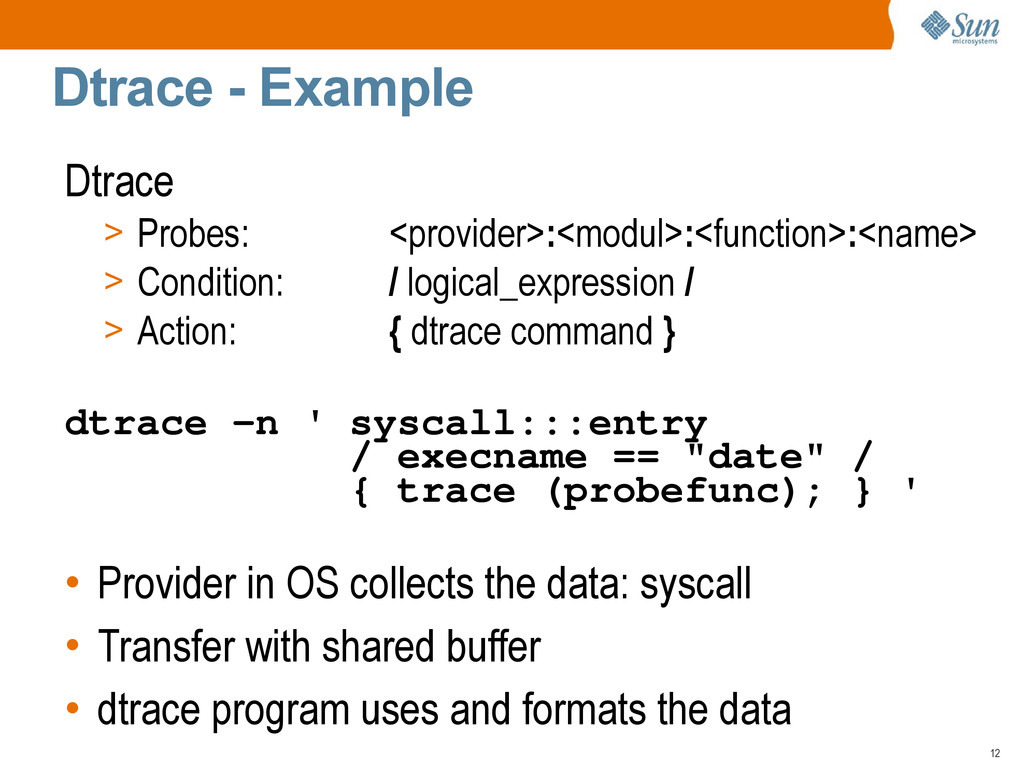
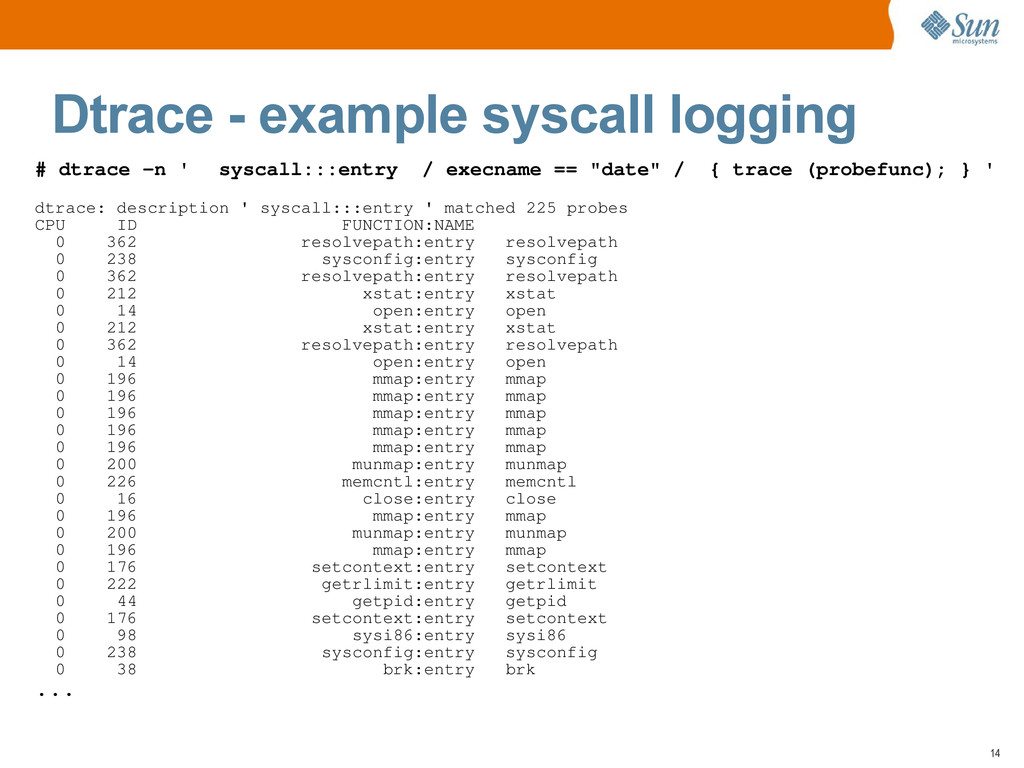
    / logical_expression / > Action: { dtrace command } dtrace -n ' syscall:::entry / execname == "date" / { trace (probefunc); } ' • Provider in OS collects the data: syscall • Transfer with shared buffer • dtrace program uses and formats the data
  10. 13 Dtrace - Examples Trace of Systemcalls dtrace -n 'syscall:::entry

    { trace(execname); }' Statistics about read Systemcall dtrace -n 'syscall::read:entry { @[execname] = count(); }' Statistics about size of read dtrace -n 'syscall::read:entry { @a[execname] = quantize(arg2); }'
  11. 14 Dtrace - example syscall logging # dtrace -n '

    syscall:::entry / execname == "date" / { trace (probefunc); } ' dtrace: description ' syscall:::entry ' matched 225 probes CPU ID FUNCTION:NAME 0 362 resolvepath:entry resolvepath 0 238 sysconfig:entry sysconfig 0 362 resolvepath:entry resolvepath 0 212 xstat:entry xstat 0 14 open:entry open 0 212 xstat:entry xstat 0 362 resolvepath:entry resolvepath 0 14 open:entry open 0 196 mmap:entry mmap 0 196 mmap:entry mmap 0 196 mmap:entry mmap 0 196 mmap:entry mmap 0 196 mmap:entry mmap 0 200 munmap:entry munmap 0 226 memcntl:entry memcntl 0 16 close:entry close 0 196 mmap:entry mmap 0 200 munmap:entry munmap 0 196 mmap:entry mmap 0 176 setcontext:entry setcontext 0 222 getrlimit:entry getrlimit 0 44 getpid:entry getpid 0 176 setcontext:entry setcontext 0 98 sysi86:entry sysi86 0 238 sysconfig:entry sysconfig 0 38 brk:entry brk ...
  12. 15 xcall – Analysis Data about xcall only in summary

    # mpstat CPU minf mjf xcal intr ithr csw icsw migr smtx srw syscl usr sys wt idl 12 1 27 3504 338 206 765 27 114 65 1 337 9 19 41 31 13 1 19 5725 98 68 723 22 108 120 0 692 3 17 20 61 14 0 57 3873 224 192 670 22 75 86 1 805 7 10 35 48 15 36 7 1551 42 28 689 6 68 59 0 132 2 9 35 54 16 14 7 7209 504 457 1031 37 125 244 0 459 6 30 4 60 17 5 5 4960 150 108 817 37 98 154 0 375 6 26 6 62 18 5 6 6085 1687 1661 741 60 76 248 0 434 3 33 0 64 19 0 15 10037 72 41 876 23 100 291 1 454 2 19 9 71 20 12 5 5890 746 711 992 32 122 216 2 960 10 33 4 53 21 60 5 1567 729 713 467 15 80 59 0 376 2 35 10 53 22 0 6 4378 315 291 751 17 84 142 1 312 3 16 1 80 23 0 6 12119 33 3 874 20 82 384 1 513 4 24 11 62 • xcal: processor cross calls: Read data from the Cache of another CPU • smtx: spinning mutex: Synchronisation of small critical regions
  13. 16 What is a xcall (Crosscall)? • SMP-System with more

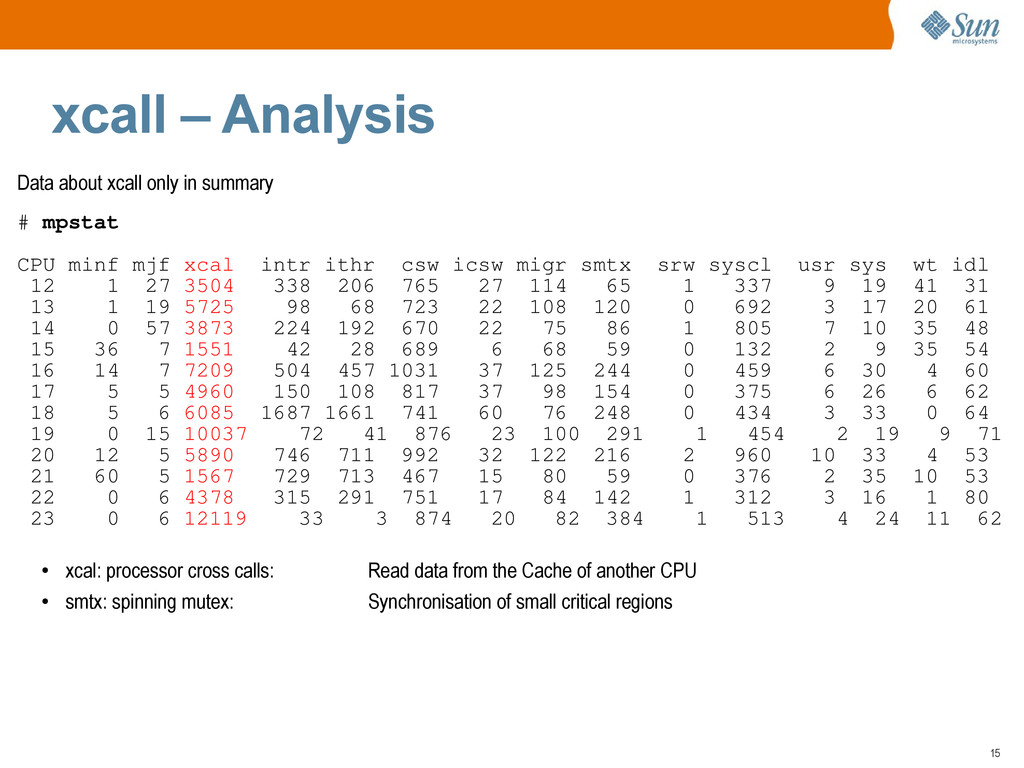
    than 1 CPU • Shared Data Areas > Use of one area from different CPUs > Snooping tells CPUs which other CPU owns the data • Case: > Processor A likes to read some data from memory > Processor B data in its cache (recently changed) => Data in Cache of B ≠ Data in Memory • A requests to read the data from the cache of B: this is called: crosscall
  14. 17 xcall - Analysis with Dtrace # dtrace -n 'xcalls

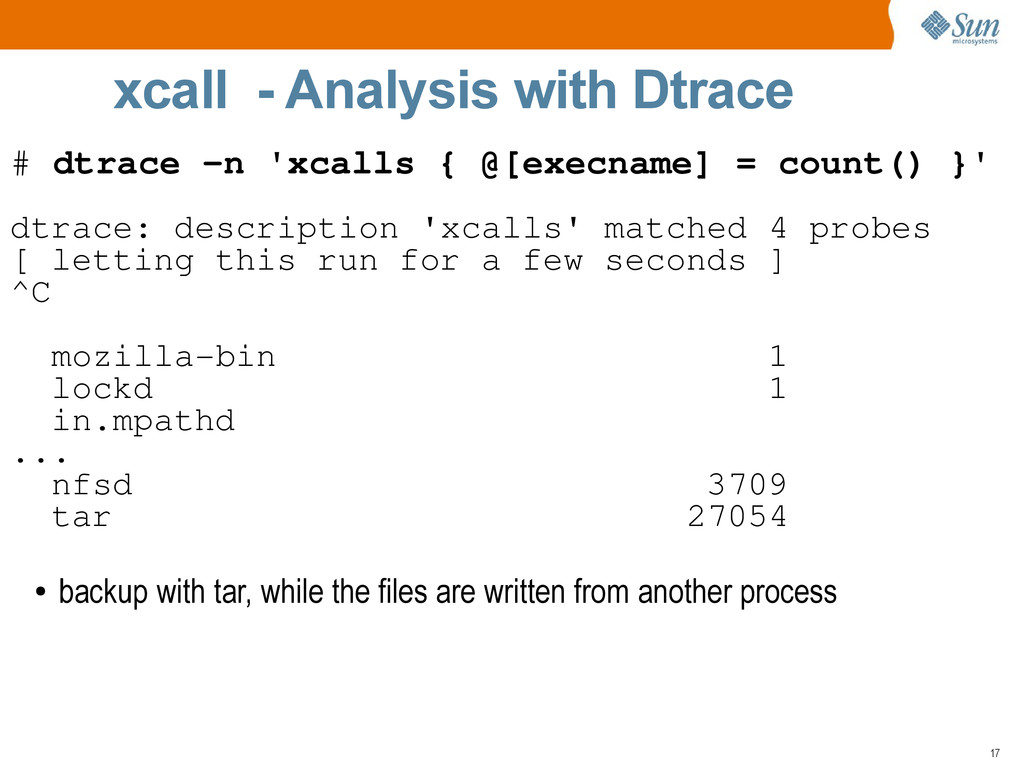
    { @[execname] = count() }' dtrace: description 'xcalls' matched 4 probes [ letting this run for a few seconds ] ^C mozilla-bin 1 lockd 1 in.mpathd ... nfsd 3709 tar 27054 • backup with tar, while the files are written from another process
  15. 18 Called functions of a process # dtrace -n 'pid1442:::entry

    { trace( probefunc ); } ' dtrace: description 'pid1442:::entry ' matched 6690 probes ... 0 42724 readline_internal_char:entry readline_internal_char 0 48367 sigsetjmp:entry sigsetjmp 0 48348 __csigsetjmp:entry __csigsetjmp 0 43018 _rl_init_argument:entry _rl_init_argument 0 42951 rl_read_key:entry rl_read_key ...
  16. 19 Who opens which file? # dtrace -q -n '

    syscall::open*:entry { printf( "%s (%d):\t \"%s\"\n", execname, pid, copyinstr(arg0) ); }' emifreq-applet (1030): "/usr/share/pixmaps/emifreq-applet/emifreq-icon1.png" lp (127): "/var/run/syslog_door" lp (127): "/var/run/syslog_door" lp (127): "xfA000chumly"
  17. 20 Dtrace and Container Debugging of Multi-tier Applications • Installation

    of Tiers in Zones => everything in one Solaris • Dtrace can differentiate the Zones > Examine the parts > View the timing
  18. 21 Solaris Middleware Application Zone: Web Solaris Middleware Application Zone:

    App-Server Solaris Middleware Application Zone: DB 3 Tier Application installed in 3 Zones Dtrace and Container
  19. 22 Dtrace Environments • Provider in OS > Solaris (alle

    x86 and SPARC > Solaris Express > FreeBSD > MacOS (Leopard)
  20. 23 Dtrace Environments • Provider in all Applications > F.e.

    pid1234 for process 1234 > Use of symbolic informations • Instrumented Applications > Postgres, MySQL > Java 5 mit patch, Java 6,... • Own Applications > 1 macro per module / function / name / variable
  21. 24 DTrace Tools • Examples from the docs: /usr/demo/dtrace •

    Tools: http://www.sun.com/bigadmin/dtrace # dappprof -ceoT banner hello # # ###### # # #### # # # # # # # ###### ##### # # # # # # # # # # # # # # # # # # # # ###### ###### ###### #### CALL COUNT __fsr 1 main 1 banprt 1 banner 1 banset 1 convert 5 banfil 5 TOTAL: 15 CALL ELAPSED banset 38733 banfil 150280 convert 152113 banner 907212 __fsr 1695068 banprt 1887674 TOTAL: 4831080 CALL CPU banset 7710 convert 9566 banfil 11931 __fsr 15199 banner 52685 banprt 776429 TOTAL: 873520
  22. 25 Dtrace - Summary • New tool for supervision of

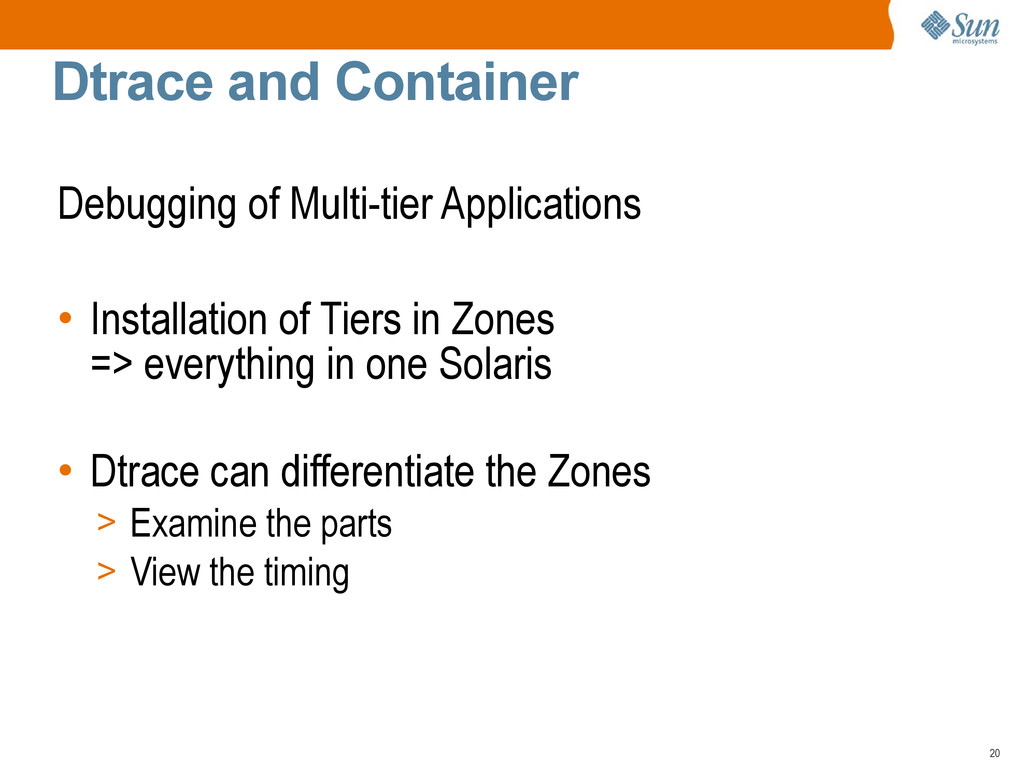
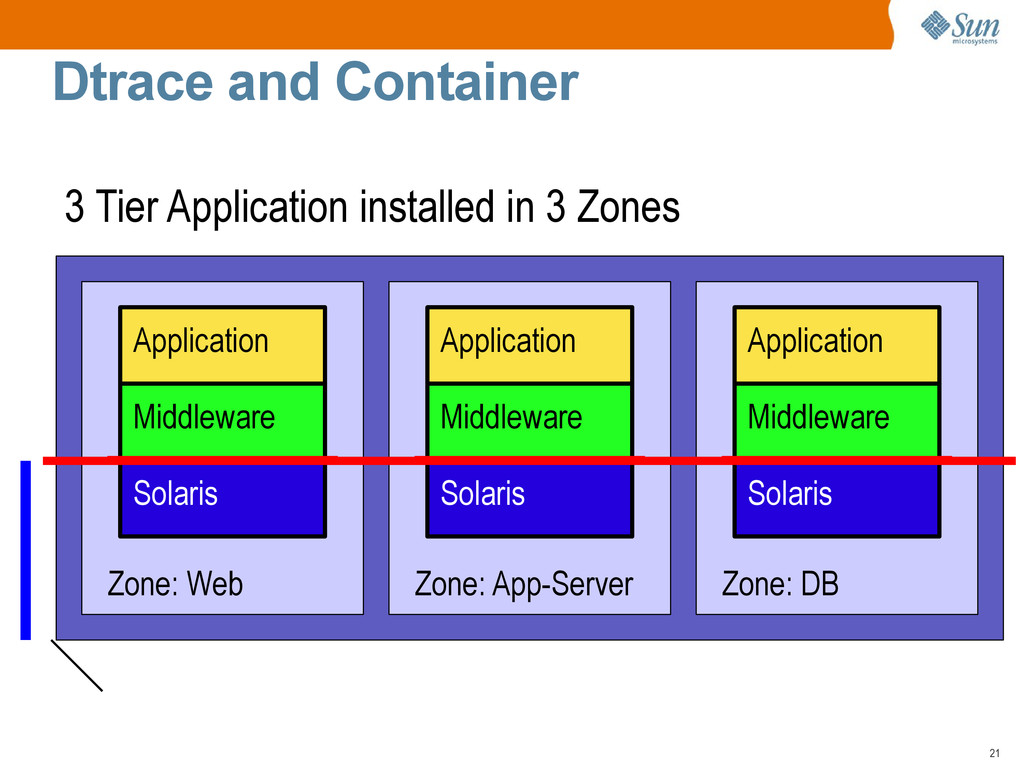
    system and applications > Development > Preparation of Production > Production and Performance Analysis • Properties > Secure > Covering Kernel and Applications > Low Overhead, usable on production systems > Statistics for applications, determining applications > Lots of standard reports available > ad-hoc queries