Upgrade to Pro — share decks privately, control downloads, hide ads and more …

TaDa it's magic: Predicting the performance of functions through automated doubling experiments

TaDa it's magic: Predicting the performance of functions through automated doubling experiments

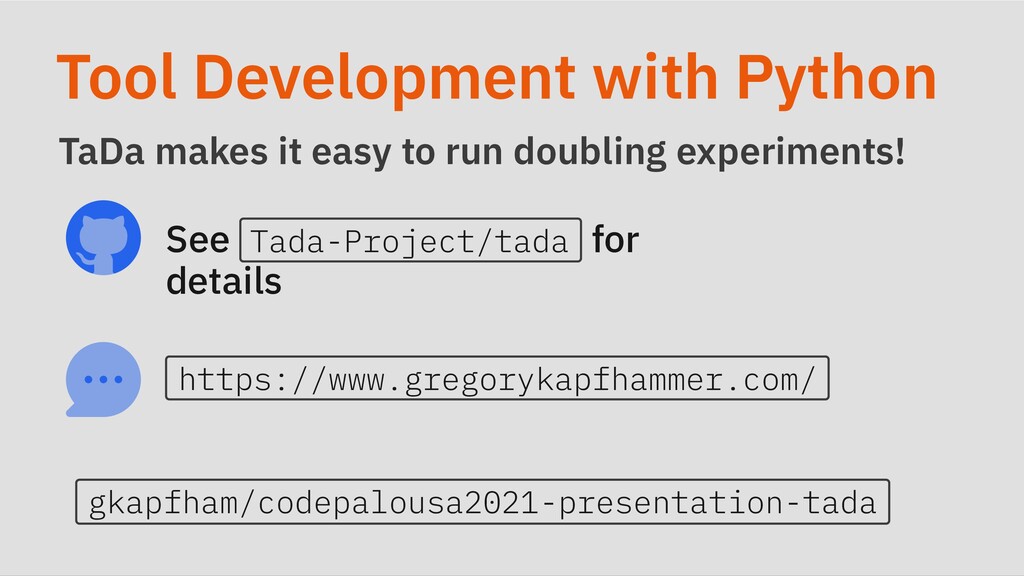
Interested in learning more about this topic? Please visit my research page for more details: https://www.gregorykapfhammer.com/research/
Please note that two slides are blank because their graphs did not export to PDF correctly. Sorry!

Gregory Kapfhammer

August 18, 2021
Tweet

More Decks by Gregory Kapfhammer

Other Decks in Research

Transcript

  1. TaDa it’s Magic!
    Predicting the Performance of
    Programs through Automated
    Doubling Experiments
    Gregory M. Kapfhammer, Lancaster Wu, Enpu You
    CodepaLOUsa 2021

    View Slide

  2. Huh, what is this about?
    Key Questions
    Can a tool automatically predict a program’s performance? Is it possible to
    automatically estimate the worst-case time complexity of a program?
    Intended Audience
    An adventuresome technology enthusiast who wants to explore how a new
    approach to performance evaluation can make their programs faster!
    Let's learn how to predict a function's performance!

    View Slide

  3. Why focus on Python programming?
    Prevalence of Python
    Python is 
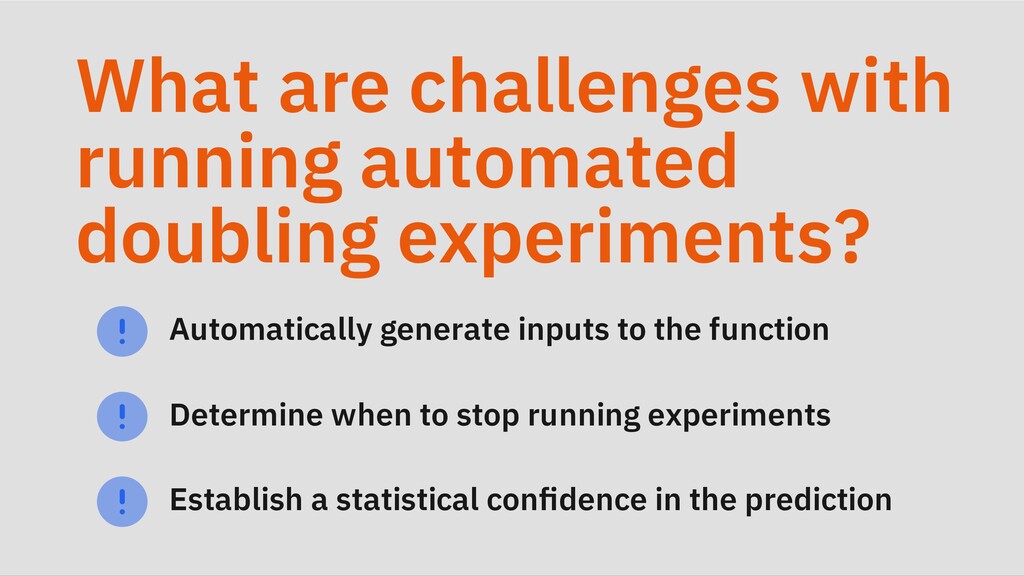
consistently ranked as one of the top programming languages for
    web development, data science, machine learning, and general
    programming
    Importance of Performance
    Programmers who create, say, serverless functions with AWS Lambda need
    to carefully monitor and improve the performance of these functions
    Challenging about performance evaluation in Python?

    View Slide

  4. Analytical
    Evaluation
    Algorithm
    Constructs
    Growth
    Experimental
    Evaluation
    Program
    Benchmark
    Study
    What are the trade-offs of these two approaches?

    View Slide

  5. Analytical
    Provides a clear means by which to
    compare programs
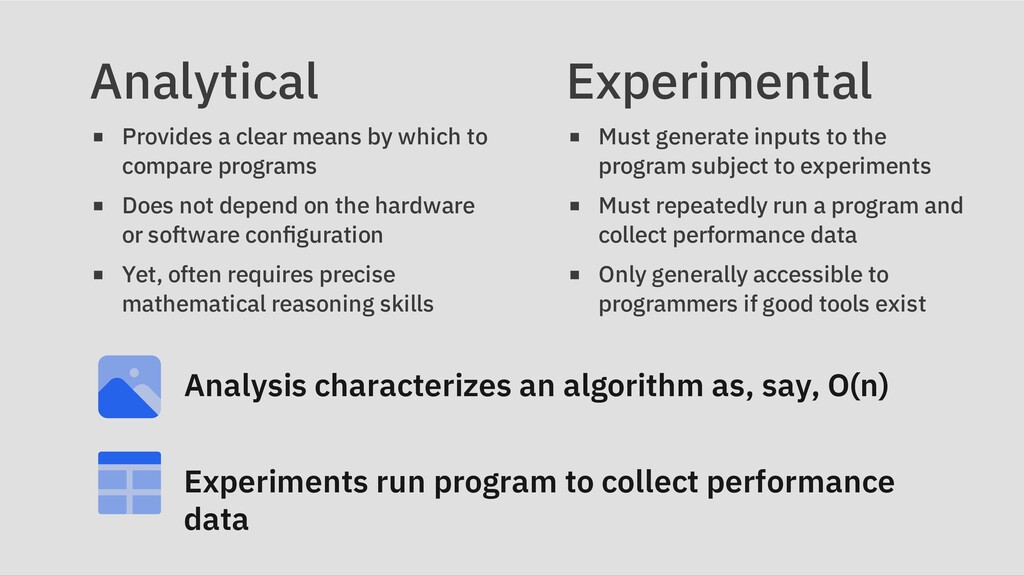
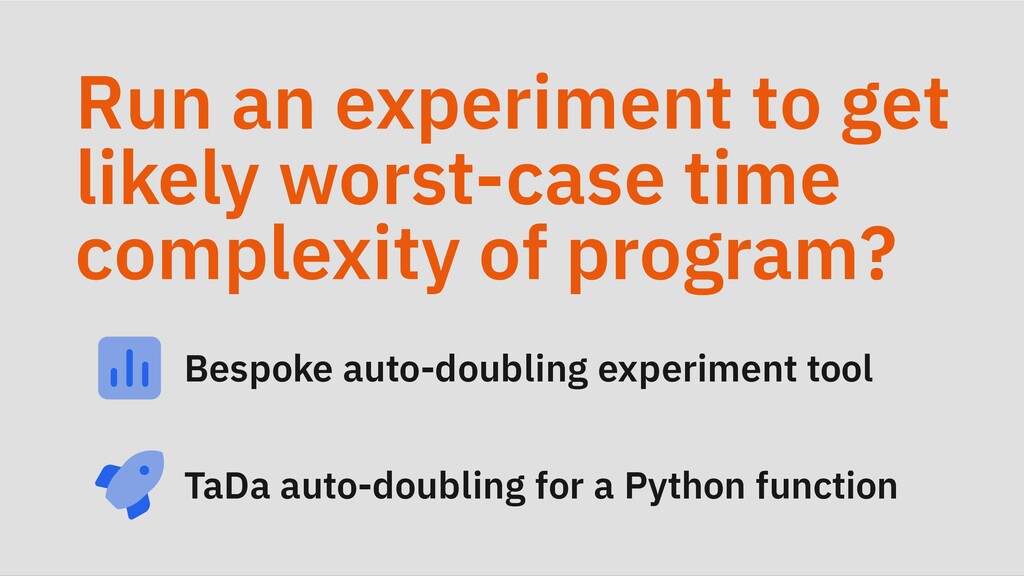
    Does not depend on the hardware
    or software configuration
    Yet, often requires precise
    mathematical reasoning skills
    Experimental
    Must generate inputs to the
    program subject to experiments
    Must repeatedly run a program and
    collect performance data
    Only generally accessible to
    programmers if good tools exist
    Analysis characterizes an algorithm as, say, O(n)
    Experiments run program to collect performance
    data

    View Slide

  6. How to analytically
    evaluate a program's
    performance?
    Commonly used growth functions
    Study program's code constructs

    View Slide

  7. "Fast" Order of Growth Functions

    View Slide

  8. "Slow" Order of Growth Functions

    View Slide

  9. Relationship between
    growth function and
    program's performance?
    Slow growth functions → fast programs
    Fast growth functions → slow programs

    View Slide

  10. Analyzing the add_digits Function
    def add_digits(digits: str) -> int:

    value 
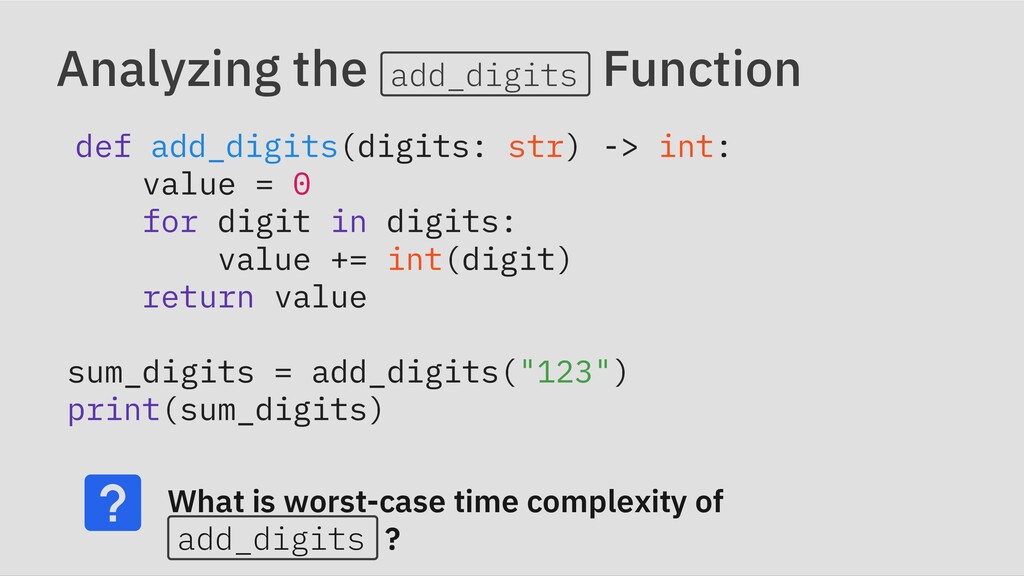
= 0

    for digit in digits:

    value += int(digit)

    return value

    sum_digits = add_digits("123")

    print(sum_digits)
    What is worst-case time complexity of
    add_digits ?

    View Slide

  11. Analyzing the factorial Function
    def factorial(x: int) -> int:

    if x == 1:

    return 1

    else:

    return x*factorial(x-1)

    factorial_value = factorial(3)

    print(factorial_value)
    What is worst-case time complexity of
    factorial ?

    View Slide

  12. Analyzing the is_subset Function
    def is_subset(one: List, two: List) -> 
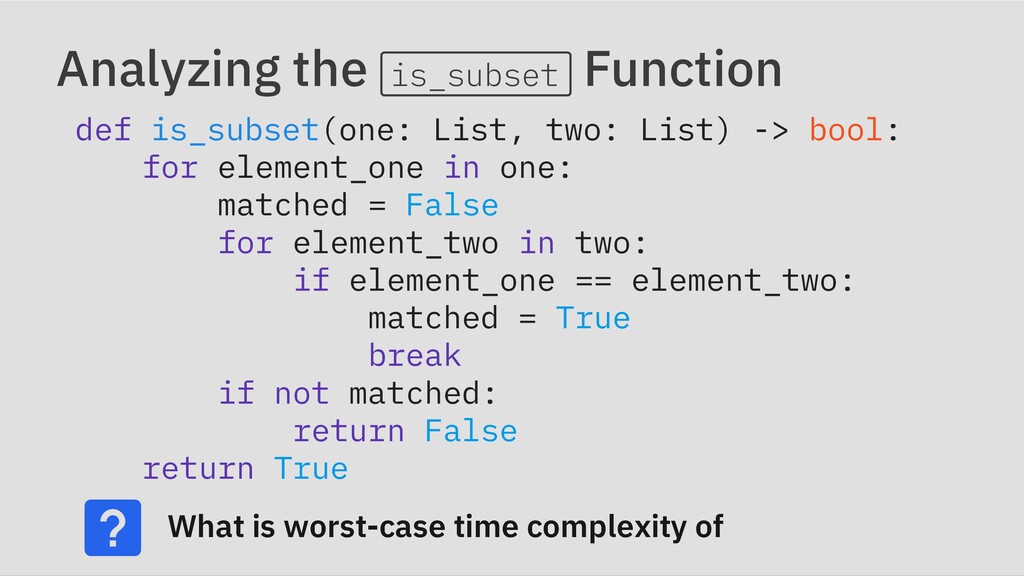
bool:

    for element_one in one:

    matched = False

    for element_two in two:

    if element_one == element_two:

    matched = True

    break

    if not matched:

    return False

    return True
    What is worst-case time complexity of

    View Slide

  13. Run an experiment to get
    likely worst-case time
    complexity of program?
    Bespoke auto-doubling experiment tool
    TaDa auto-doubling for a Python function

    View Slide

  14. Doubling Experiment: Linear
    Double the size of the program’s input
    14.98 seconds 31.45 seconds
    Doubling ratio is approximately 2
    Likely worst-case time complexity is O(n)

    View Slide

  15. Doubling Experiment: Quadratic
    Double the size of the program’s input
    12.63 seconds 51.48 seconds
    Doubling ratio is approximately 4
    Likely worst-case time complexity is O(n^2)

    View Slide

  16. Doubling Experiment: Cubic
    Double the size of the program’s input
    11.23 seconds 89.72 seconds
    Doubling ratio is approximately 8
    Likely worst-case time complexity is O(n^3)

    View Slide

  17. What are challenges with
    running automated
    doubling experiments?
    Automatically generate inputs to the function
    Determine when to stop running experiments
    Establish a statistical confidence in the prediction

    View Slide

  18. TaDa Runs a Doubling Experiment
    Input is a Python function
    and configuration options
    Output is a data table and
    a performance prediction
    See Tada-Project/tada for
    details

    View Slide

  19. Analyzing the insertion_sort Function
    def insertion_sort(lst: list[int]) -> list[int]:

    for i in range(1, len(lst)):

    value = lst[i]

    pos = i

    while pos > 0 and value < lst[pos - 1]:

    lst[pos] = lst[pos - 1]

    pos -= 1

    lst[pos] = value

    return lst
    Can TaDa predict worst-case of
    insertion_sort ?

    View Slide

  20. Analyzing the bubble_sort Function
    def bubble_sort(lst: list[int]) -> list[int]:

    for 
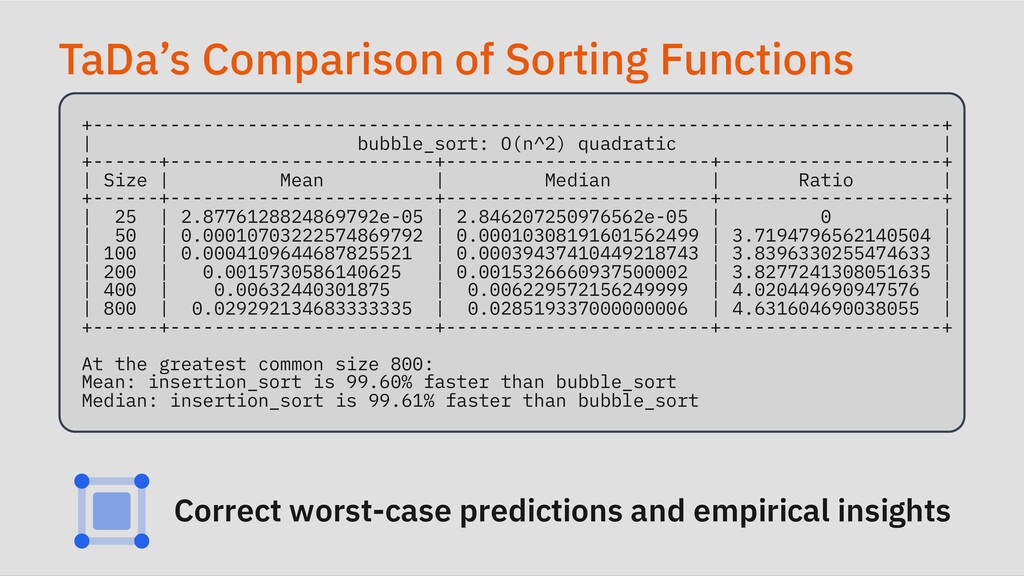
num in range(len(lst) - 1, 0, -1):

    for i in range(num):

    if lst[i] > lst[i + 1]:

    temp = lst[i]

    lst[i] = lst[i + 1]

    lst[i + 1] = temp

    return lst
    Can TaDa predict worst-case of
    bubble_sort ?

    View Slide

  21. How to automatically
    generate function inputs
    during experiments?
    Hypothesis: Property-based testing tool
    JSON Schema: Describe format of input

    View Slide

  22. Hypothesis and JSON Schema for Data
    [{

    "type": "array",

    "items": {

    "type": "integer"

    },

    "uniqueItems": true,

    "maxItems": 0,

    "minItems": 0

    }]
    Describe structure to support automated data
    generation

    View Slide

  23. TaDa’s Automated Analysis of Insertion Sort
    +-----------------------------------------------------------------------------+

    | insertion_sort: O(n) linear or O(nlogn) linearithmic |

    +------+------------------------+------------------------+--------------------+

    | Size | Mean | Median | Ratio |

    +------+------------------------+------------------------+--------------------+

    | 25 | 3.644364811706543e-06 | 3.498709533691405e-06 | 0 |

    | 50 | 6.535123836263021e-06 | 6.483351989746092e-06 | 1.793213405878218 |

    | 100 | 1.2902192108154296e-05 | 1.2540842590332028e-05 | 1.9742842571032526 |

    | 200 | 2.5023900944010416e-05 | 2.4608139038085928e-05 | 1.9395077002608803 |

    | 400 | 5.526396857910156e-05 | 5.3515207031250005e-05 | 2.2084473840729952 |

    | 800 | 0.00011801120257161459 | 0.00011251379296875 | 2.1354094829925283 |

    +------+------------------------+------------------------+--------------------+

    Interpreting TaDa’s output:
    Ran multiple threads for multiple input sizes
    Doubled the input size and recorded time
    Used ratio to correctly predict worst-case

    View Slide

  24. TaDa’s Comparison of Sorting Functions
    +-----------------------------------------------------------------------------+

    | bubble_sort: O(n^2) quadratic |

    +------+------------------------+------------------------+--------------------+

    | Size | Mean | Median | Ratio |

    +------+------------------------+------------------------+--------------------+

    | 25 | 2.8776128824869792e-05 | 2.846207250976562e-05 | 0 |

    | 50 | 0.00010703222574869792 | 0.00010308191601562499 | 3.7194796562140504 |

    | 100 | 0.0004109644687825521 | 0.00039437410449218743 | 3.8396330255474633 |

    | 200 | 0.0015730586140625 | 0.0015326660937500002 | 3.8277241308051635 |

    | 400 | 0.00632440301875 | 0.006229572156249999 | 4.020449690947576 |

    | 800 | 0.029292134683333335 | 0.028519337000000006 | 4.631604690038055 |

    +------+------------------------+------------------------+--------------------+

    At the greatest common size 800:

    Mean: insertion_sort is 99.60% faster than bubble_sort

    Median: insertion_sort is 99.61% faster than bubble_sort

    Correct worst-case predictions and empirical insights

    View Slide

  25. Performance Evaluation
    TaDa tool bridges the experimental and analytical!
    Analytical study of performance is challenging
    Experimental study requires data and tooling
    TaDa runs doubling experiments and predicts

    View Slide

  26. Tool Development with Python
    TaDa makes it easy to run doubling experiments!
    See Tada-Project/tada for
    details
    https://www.gregorykapfhammer.com/
    gkapfham/codepalousa2021-presentation-tada

    View Slide