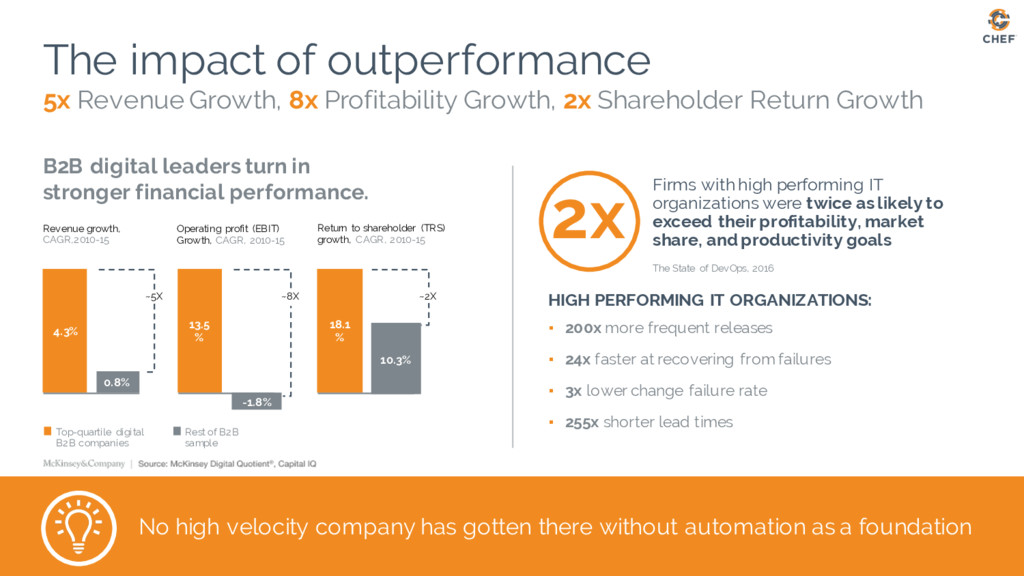
2x Shareholder Return Growth 4.3% 13.5 % 18.1 % 0.8% -1.8% 10.3% B2B digital leaders turn in stronger financial performance. Top-quartile digital B2B companies Rest of B2B sample Revenue growth, CAGR,2010-15 Operating profit (EBIT) Growth, CAGR, 2010-15 Return to shareholder (TRS) growth, CAGR, 2010-15 ~5X ~8X ~2X Firms with high performing IT organizations were twice as likely to exceed their profitability, market share, and productivity goals The State of DevOps, 2016 HIGH PERFORMING IT ORGANIZATIONS: ▪ 200x more frequent releases ▪ 24x faster at recovering from failures ▪ 3x lower change failure rate ▪ 255x shorter lead times No high velocity company has gotten there without automation as a foundation 2x
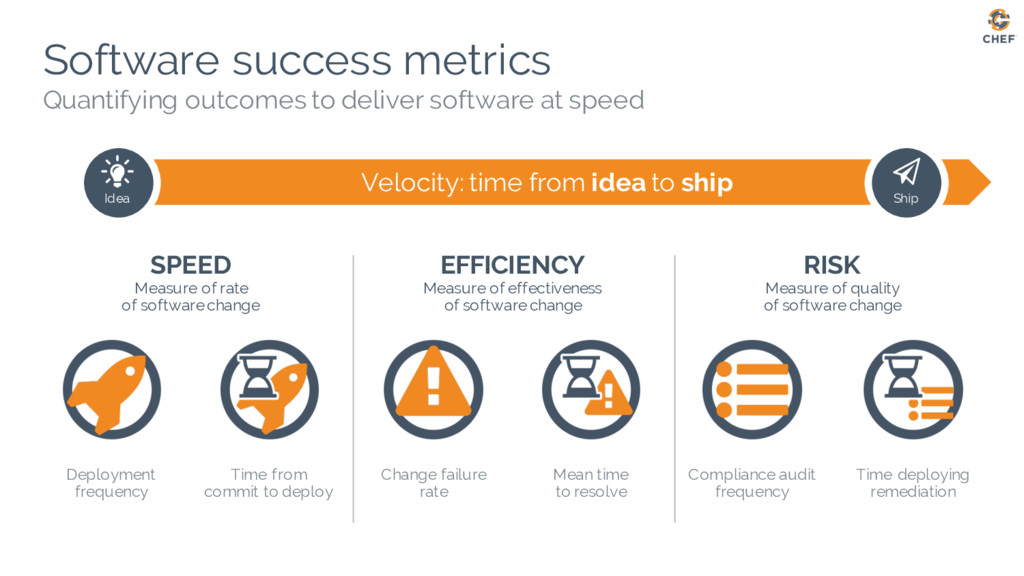
outcomes to deliver software at speed Deployment frequency Time from commit to deploy Mean time to resolve Time deploying remediation Change failure rate SPEED Measure of rate of software change EFFICIENCY Measure of effectiveness of software change RISK Measure of quality of software change Compliance audit frequency Idea Ship
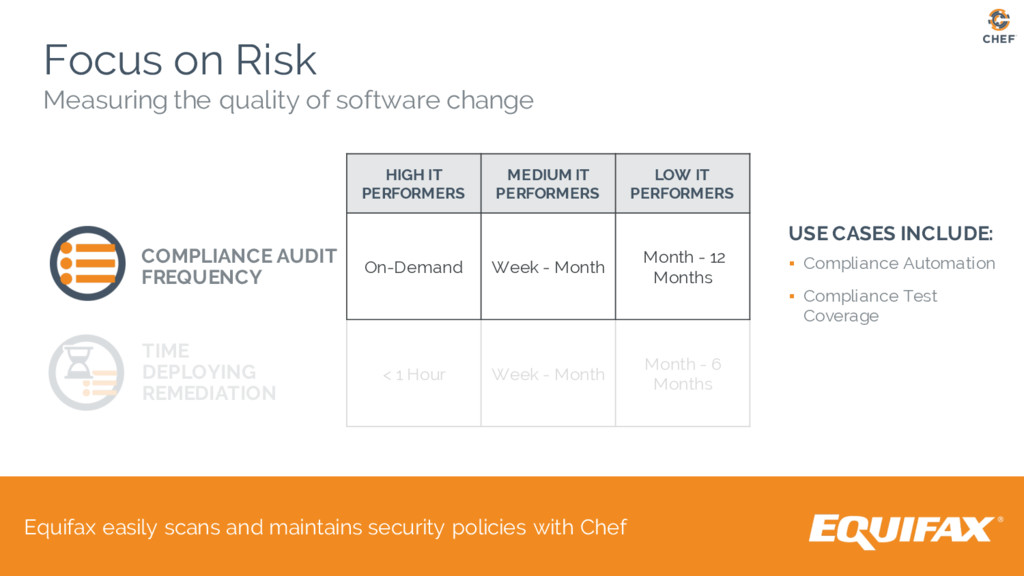
on Risk Measuring the quality of software change HIGH IT PERFORMERS MEDIUM IT PERFORMERS LOW IT PERFORMERS On-Demand Week - Month Month - 12 Months < 1 Hour Week - Month Month - 6 Months USE CASES INCLUDE: ▪ Compliance Automation ▪ Compliance Test Coverage COMPLIANCE AUDIT FREQUENCY TIME DEPLOYING REMEDIATION
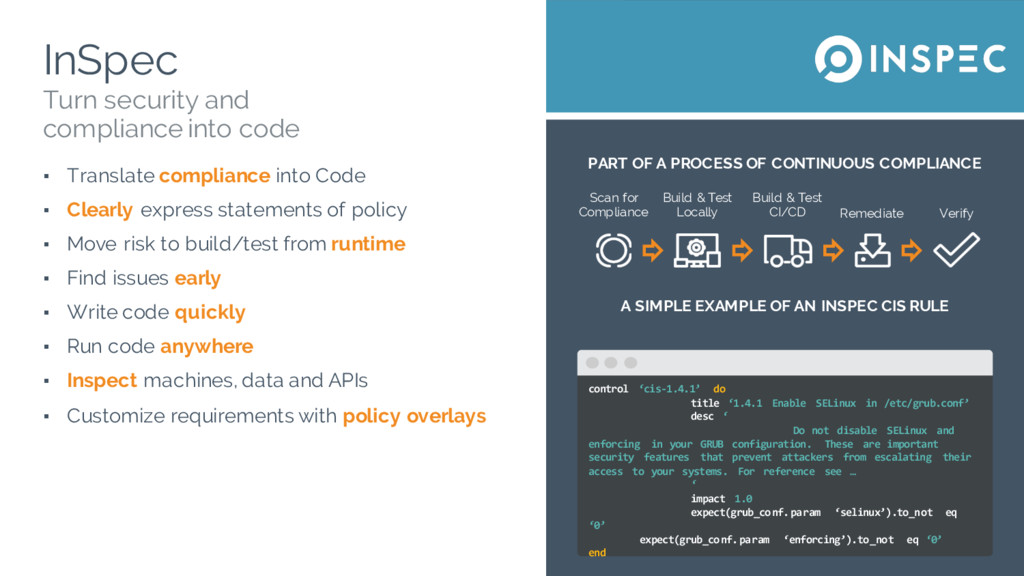
Build & Test Locally Build & Test CI/CD Remediate Verify A SIMPLE EXAMPLE OF AN INSPEC CIS RULE InSpec ▪ Translate compliance into Code ▪ Clearly express statements of policy ▪ Move risk to build/test from runtime ▪ Find issues early ▪ Write code quickly ▪ Run code anywhere ▪ Inspect machines, data and APIs ▪ Customize requirements with policy overlays Turn security and compliance into code control ‘cis-1.4.1’ do title ‘1.4.1 Enable SELinux in /etc/grub.conf’ desc ‘ Do not disable SELinux and enforcing in your GRUB configuration. These are important security features that prevent attackers from escalating their access to your systems. For reference see … ‘ impact 1.0 expect(grub_conf.param ‘selinux’).to_not eq ‘0’ expect(grub_conf.param ‘enforcing’).to_not eq ‘0’ end
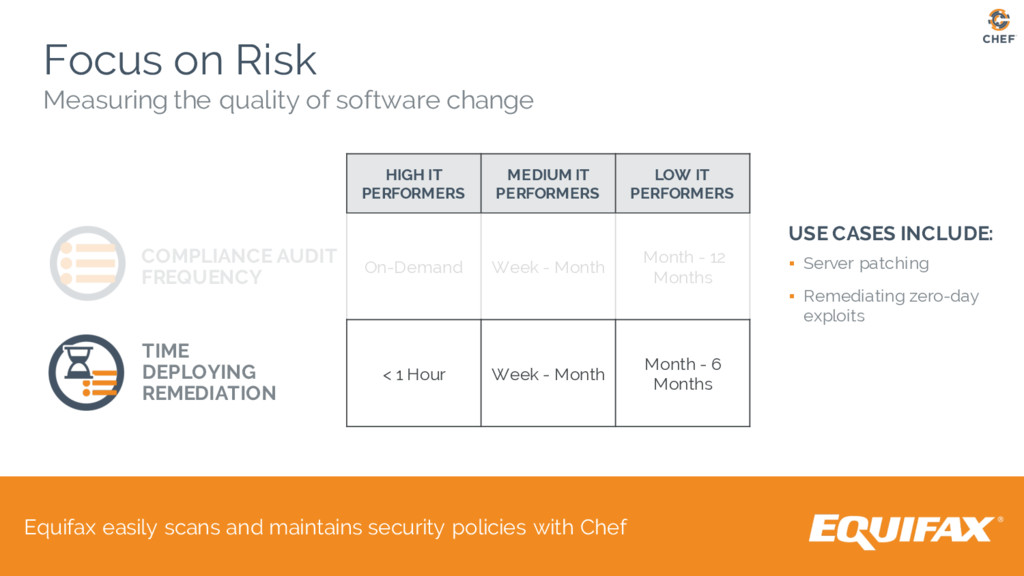
on Risk Measuring the quality of software change HIGH IT PERFORMERS MEDIUM IT PERFORMERS LOW IT PERFORMERS On-Demand Week - Month Month - 12 Months < 1 Hour Week - Month Month - 6 Months USE CASES INCLUDE: ▪ Server patching ▪ Remediating zero-day exploits COMPLIANCE AUDIT FREQUENCY TIME DEPLOYING REMEDIATION
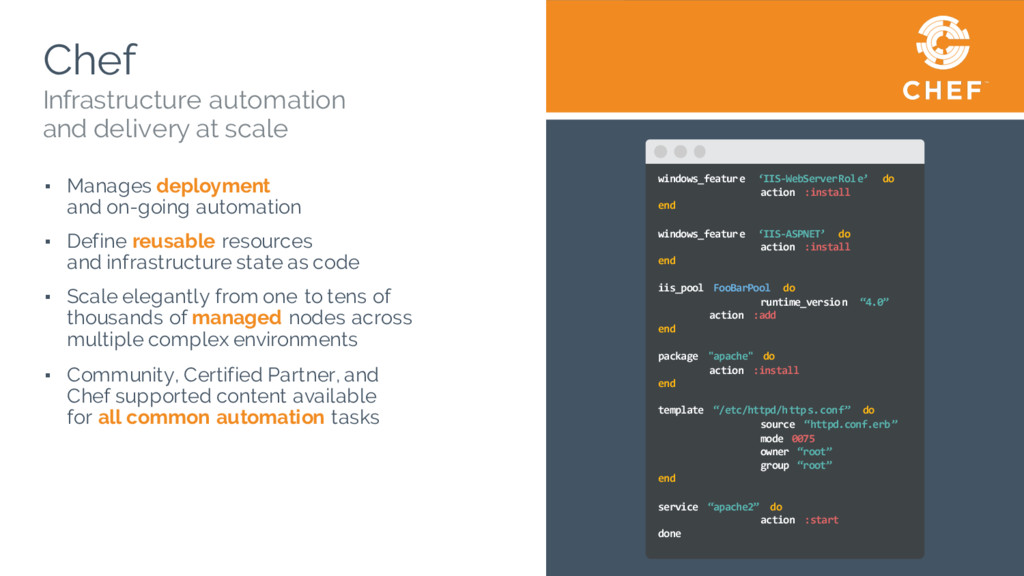
resources and infrastructure state as code ▪ Scale elegantly from one to tens of thousands of managed nodes across multiple complex environments ▪ Community, Certified Partner, and Chef supported content available for all common automation tasks Infrastructure automation and delivery at scale windows_feature ‘IIS-WebServerRole’ do action :install end windows_feature ‘IIS-ASPNET’ do action :install end iis_pool FooBarPool do runtime_version “4.0” action :add end package "apache" do action :install end template “/etc/httpd/https.conf” do source “httpd.conf.erb” mode 0075 owner “root” group “root” end service “apache2” do action :start done
outcomes to deliver software at speed Deployment frequency Time from commit to deploy Mean time to resolve Time deploying remediation Change failure rate SPEED Measure of rate of software change EFFICIENCY Measure of effectiveness of software change RISK Measure of quality of software change Compliance audit frequency Idea Ship