Upgrade to Pro — share decks privately, control downloads, hide ads and more …

ggcov: A Practical Guide To Making Your Test Suite Suck Less

Greg Banks
December 20, 2006

ggcov: A Practical Guide To Making Your Test Suite Suck Less

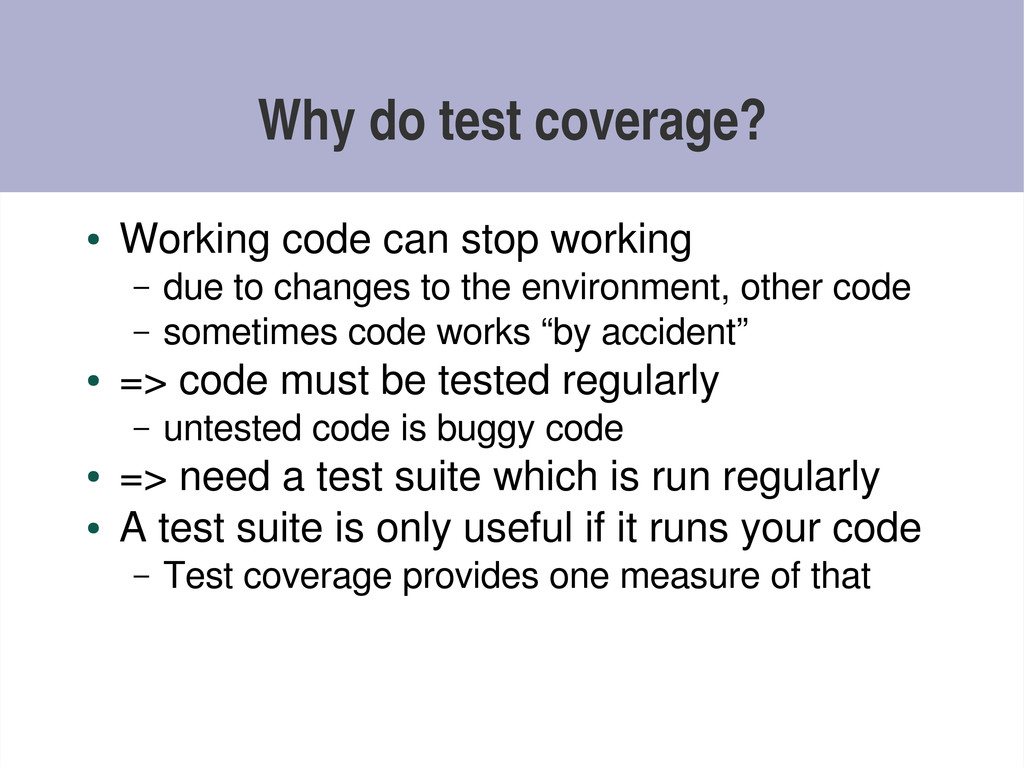
Test coverage is a well known but underused technique for
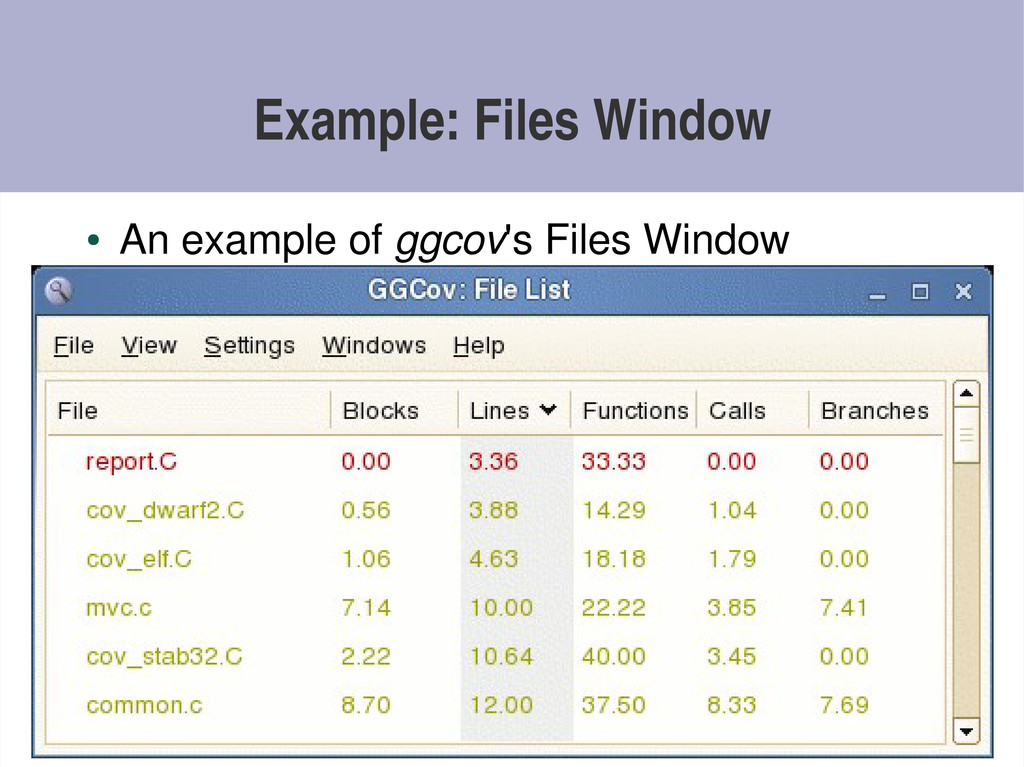
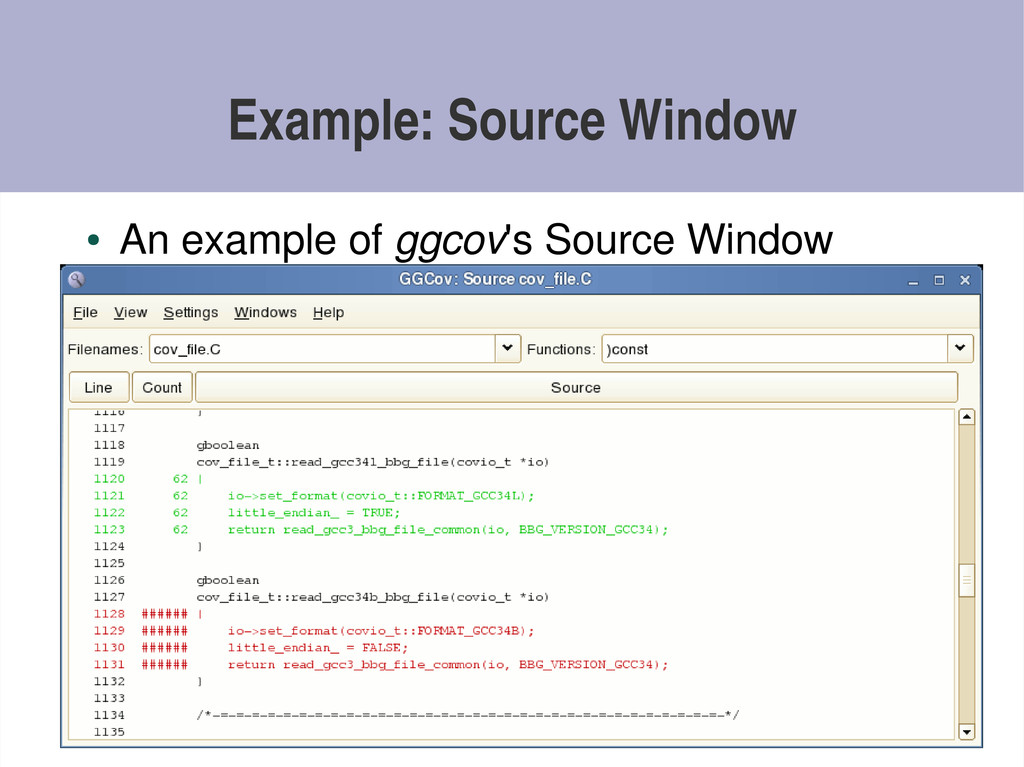
measuring the effectiveness of test suites. This presentation provides advice derived from personal experience performing coverage studies using ggcov, the author's graphical coverage browser tool. This includes guidelines for interpreting results, advice on what to expect from coverage studies, issues with multithreaded programs, and a brief description of issues discovered when coveraging the Linux kernel.

Greg Banks

December 20, 2006
Tweet

More Decks by Greg Banks

Other Decks in Programming

Transcript

  1. ggcov A Practical Guide To Making Your Test Suite Suck

    Less Greg Banks <[email protected]> Open Source Developers' Conference Melbourne, Australia Dec 2006
  2. Overview • Scope • What is test coverage? • How

    does test coverage work? • How to interpret results • What to expect • What NOT to expect • Extra topics
  3. Scope • GNU Compiler Collection 4.1 • C and C++

    • UNIX­like platforms • Similar techniques apply to – other platforms – other compilers – other languages • Licence neutral (IANAL)
  4. What is test coverage? • Measuring how much of your

    code is run (“covered”) when your code's test suite runs
  5. Why do test coverage? • Working code can stop working

    – due to changes to the environment, other code – sometimes code works “by accident” • => code must be tested regularly – untested code is buggy code • => need a test suite which is run regularly • A test suite is only useful if it runs your code – Test coverage provides one measure of that
  6. Just Do It! • Test coverage is sorely underused •

    Testing is often “2nd class” – management pays lip service – but nothing actually happens • “Our test suite takes 8 hours to run, it must be good!” – 1000s of runs of the same 2% of the code • The first coverage study is often a shock – but it WILL improve code quality
  7. How does it work: build time • Add a special

    make target – adds ­­coverage gcc option • interesting compile lines • all link lines • gcc<4.0: ­fprofile­arcs ­ftest­coverage (both) – adds ­g, removes ­O • Compiler adds instrumentation to object files – code at basic block boundaries to counter++ – array of counters, 1 per bb­>bb arc – descriptor for the file & counters • global c'tor registers descriptor before main
  8. Sidebar: what's a basic block? • Obscure internal compiler unit

    • A sequence of instructions ending at a change of control flow
  9. How does it work: build time (2) • Compiler writes

    graph file – foo.gcno in the same directory as foo.o – contains extra information • more detailed than normal debug info • line numbers <­> basic blocks • basic block graph per function – gcc<3.4: foo.bbg
  10. How does it work: run time • Instrumented code counter++

    as it's run • Special atexit handler – writes counters to a data file per source file – foo.gcda in the same directory as foo.o – also on fork and execve.
  11. How does it work: analysis time • Post processor reads

    .gcno, .gcda and source to build a report – gcov: text tool, comes with gcc – lcov: massages gcov output into HTML – ggcov: a GUI (by me) • Report shows which code was run • The art is in figuring out what to do with all that information
  12. How to interpret results • ggcov Summary window – don't

    read too much into these numbers, yet
  13. Suggested procedure (1) • Get the latest ggcov from SourceForge

    • Run the entire test suite to completion, once • Do not try to focus on individual tests (yet) • Open ggcov's File List window • Sort on the Lines column • Start with the file with the lowest Lines %
  14. Suggested procedure (2) • For each interesting file... • Open

    the file in the Source window • Scroll through looking for large fragments coloured red = code not run
  15. Suggested procedure (3) • Using your knowledge of the code,

    map red fragments back to 1 or more of: – a software feature – a user action – a configuration option – possible input data – an environmental effect (compiler, libc) – an error condition • As you go, keep a list of the untested features etc – this is your list of new test cases to write
  16. Why do it this way? • In your first coverage

    study, there will be large amounts of untested code • You want to improve the test suite as fast as possible • The suggested procedure aims to test more code in broad brush strokes first • No tool to merge data from separate runs (!)
  17. What to expect • Setting up your first study will

    take lots of time & effort – but worth it...persevere! • Your test suite sucks – probably more than you think – the first numbers are usually pretty frightening – e.g. Samba4: 17% • Entire features of your code are not tested – even if your coverage numbers are good – e.g. XFS QA: 70% but RT volumes not tested!
  18. What NOT to expect (1) • Don't expect perfect numbers

    – bugs and corner cases in the toolchain – compiler optimisation does strange things – other effects (more on this later) – so, concentrate on finding uncovered code – look for the red code! – and don't sweat the details • “OMG, this line was executed 3 times instead of 4!!”
  19. What NOT to expect (2) • Don't aim for 100%

    coverage – you will never exercise 100% of real world code – beyond the point of diminishing returns – don't waste time trying • unless they pay you by the hour • assert() problem – macro generates code which in a correct program is never run • spuriously reduces coverage counts
  20. What NOT to expect (3) • malloc()/new failure branches –

    in most programs, the only useful way to handle this is exit(). – unless you have external resources which need cleaning up, there is no point testing these paths • C++ exception paths – compiler adds hidden code to functions • stack unwinding, calling d'tors • many of these simply won't happen • spuriously reduces coverage counts
  21. What NOT to expect (4) • No coverage tool will

    tell you when to stop testing – if it does, don't believe it – fundamentally an economic choice – suggested criteria: • every user­input option tested • every source fragment >= 3 lines is tested • but not error paths
  22. What NOT to expect (5) • Coverage will not write

    tests for you – programmers still needed, yay • ggcov will not help you reduce your test suite – coverage does not provide enough information to make this decision wisely – you probably have too few tests anyway • Coverage will not help you write test001 – but you already know that all your code is untested...
  23. Extra topics • Separate test machine • Performance impact •

    Build system integration • Multi­process programs • Multi­threaded programs • Linux kernel
  24. Separate test machine • Instrumented code writes .gcda files into

    the source directory – using an absolute path – source directory needs to be visible, writable from test machine • Solutions: – NFS mount the source on the same path – Make a dummy directory and copy the .gcda files back before analysis • Cross­platform problematic – use same arch for analysis as runtime
  25. Performance impact • Actually, quite light • Instrumentation is sparse

    – only arcs between blocks – not all the arcs (spanning tree) • Instrumentation is cheap – increment of a 64b or 32b global variable • Impact << valgrind, Purify. • Disabling optimisation may have an effect
  26. Build system integration • Depends on your build system •

    A single make target to instrument all code – larger projects may want to be more specific • One target to enable all the compile options – add ­­coverage – remove ­O etc – add ­g – don't strip executables – e.g. overrides $CCOVFLAGS, normally empty, used in $CFLAGS and $LDFLAGS
  27. Multi­process programs • Works fine • When writing .gcda files,

    instrumented code takes file locks and accumulates counts
  28. Multi­threaded programs • On a single CPU, works fine •

    On multiple CPUs, doesn't work – instrumented code increments global counts non­atomically – spanning tree => one corrupted count breaks the whole function • GCC patch to do atomic increments – gcc bug#28441 – waiting on paperwork
  29. Linux kernel (1) • IBM patch – allows kernel code

    to be built with ­­coverage – exports counts via /proc – ability to zero counts – compiler version specific • Issues on SMP – need gcc atomic increment patch – or disable all except 1 CPU – or run a UP kernel
  30. Linux kernel (2) • If coveraging filesystems, ensure all instances

    are unmounted before extracting data – => / should be a different fs • Some core fs/ or mm/ code is nearly impossible to coverage properly
  31. References • http://ggcov.sourceforge.net/ • gcc docs – http://gcc.gnu.org/onlinedocs/gcc4.1.1/gcc/Gcov. html •

    IBM kernel coverage patch – http://ltp.sf.net/coverage/gcov­ kernel.readme.php • Linux Test Project – http://ltp.sf.net/