Upgrade to Pro — share decks privately, control downloads, hide ads and more …

Profiling Ruby

Profiling Ruby

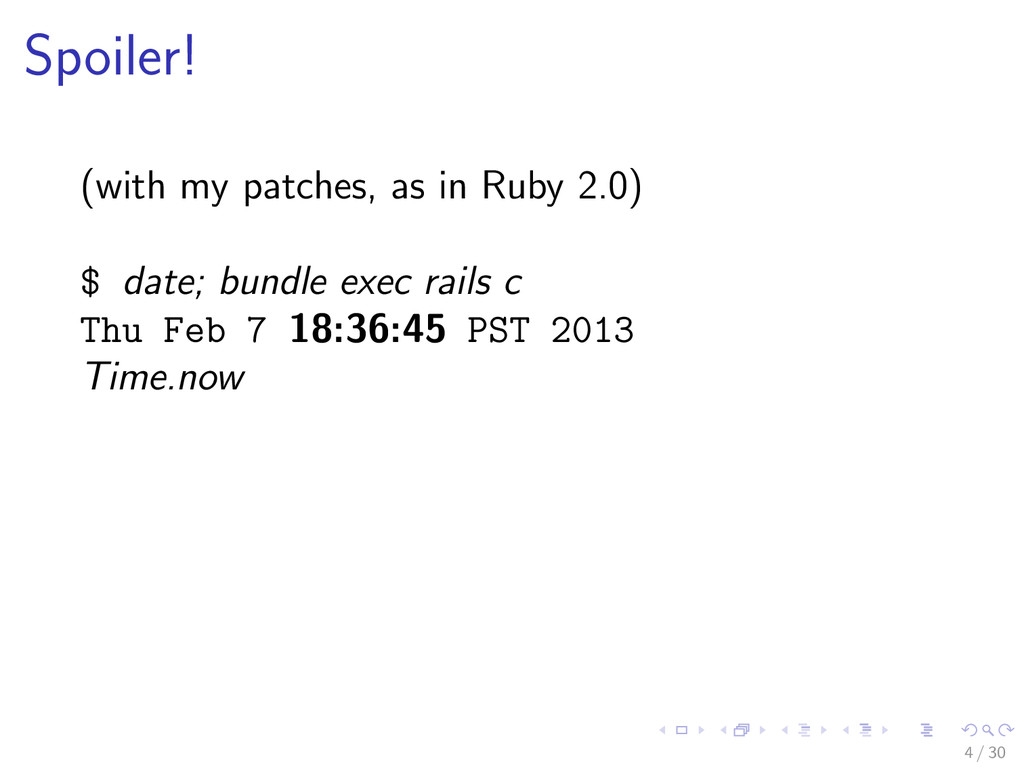
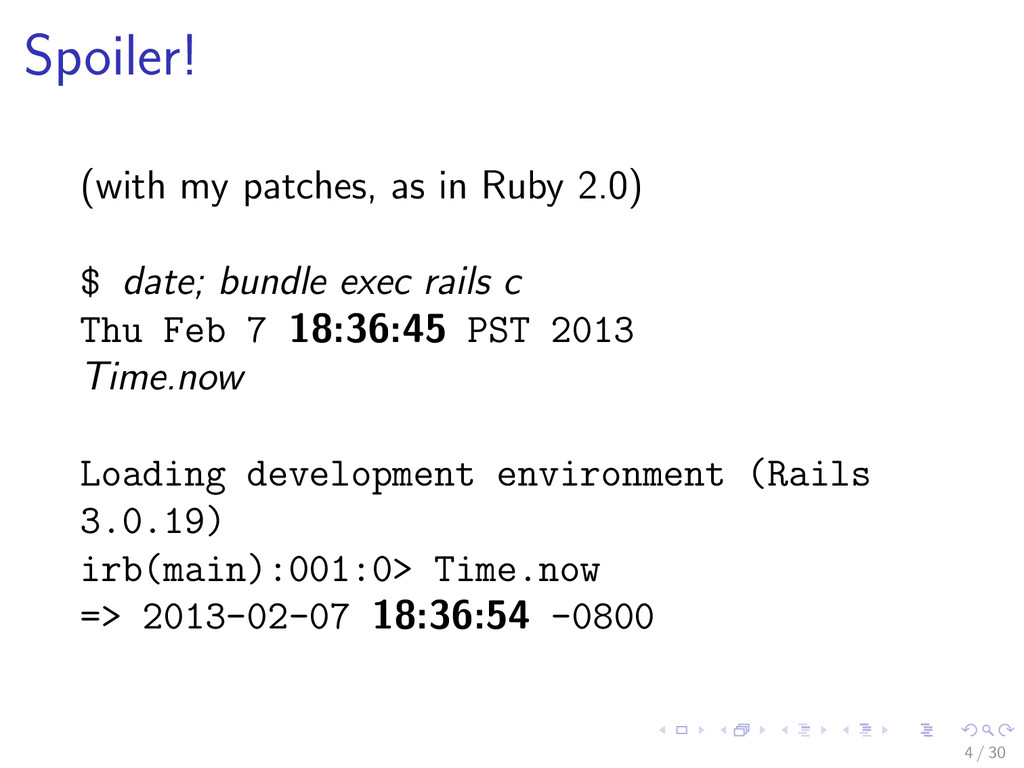
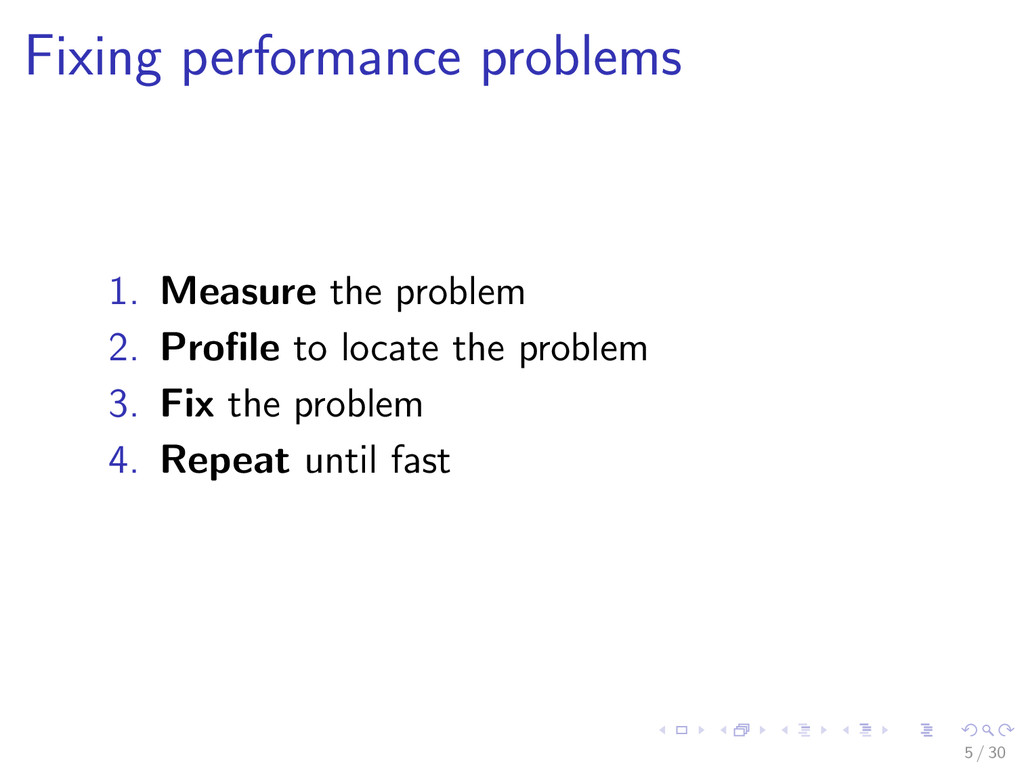
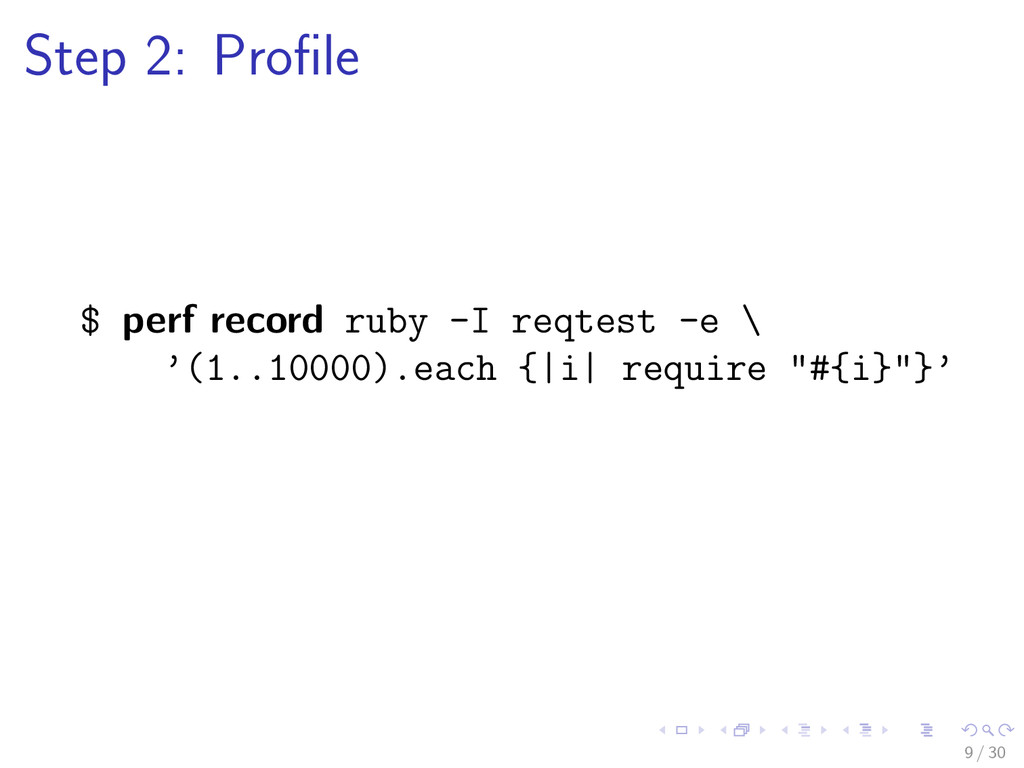
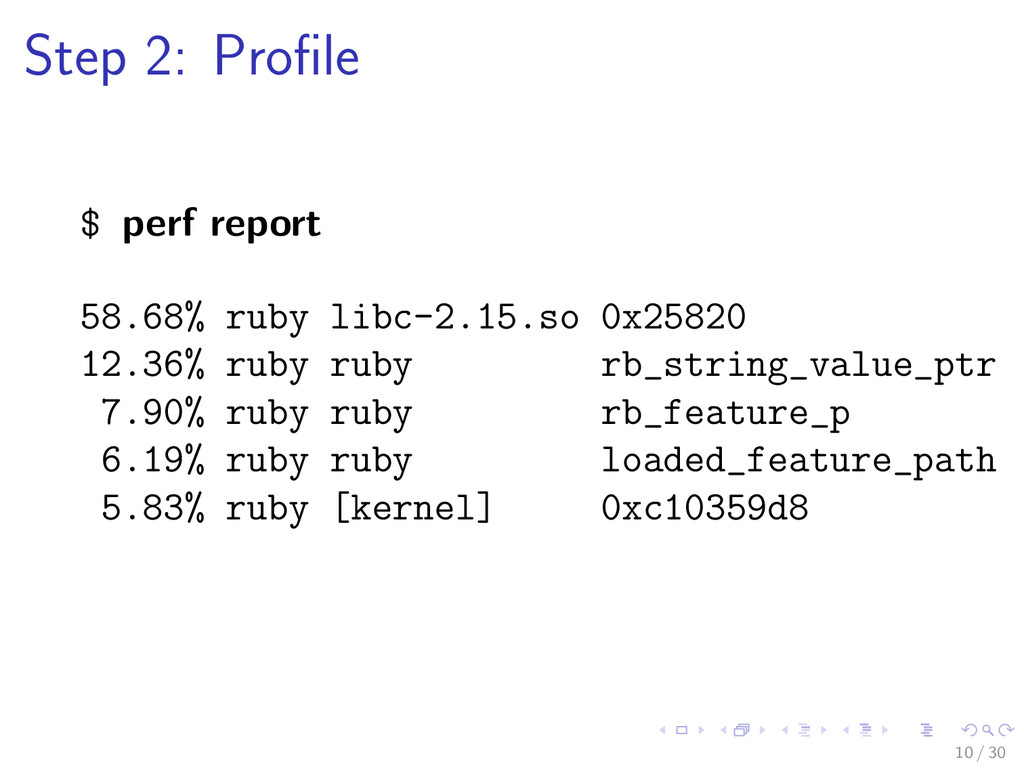
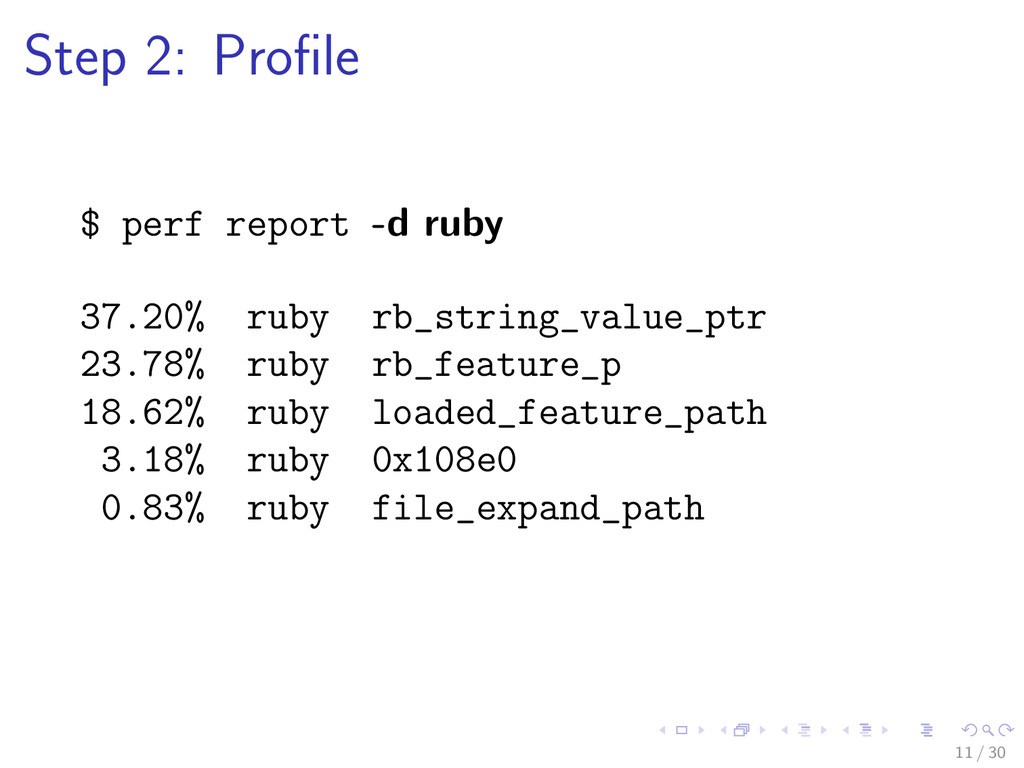
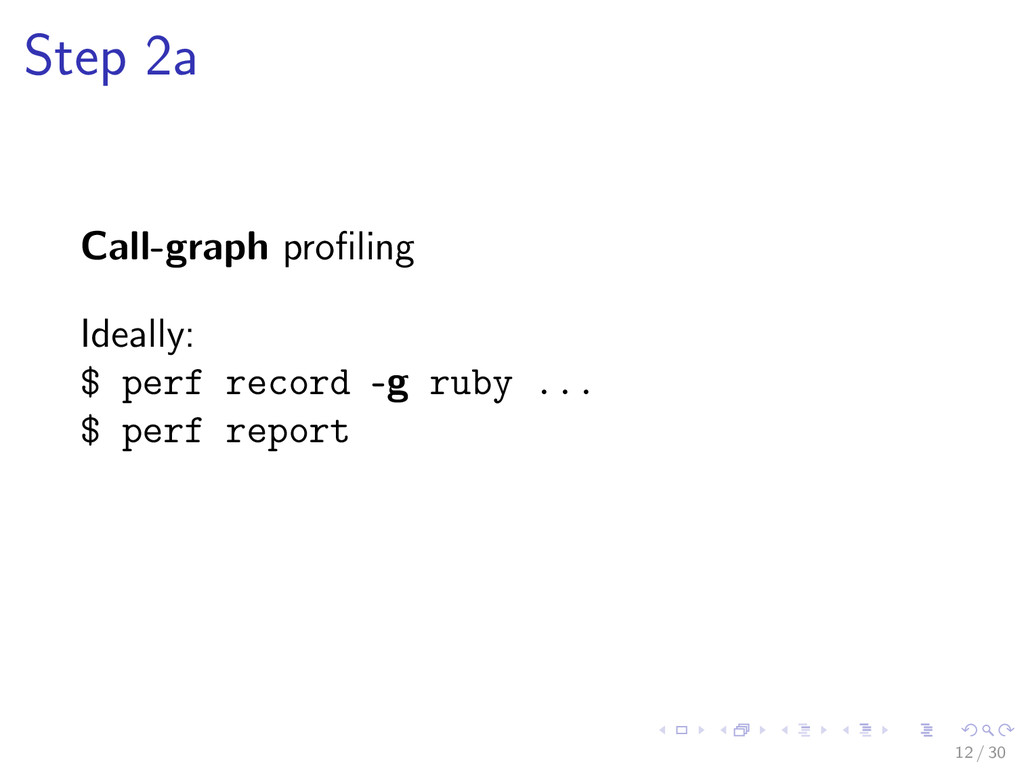
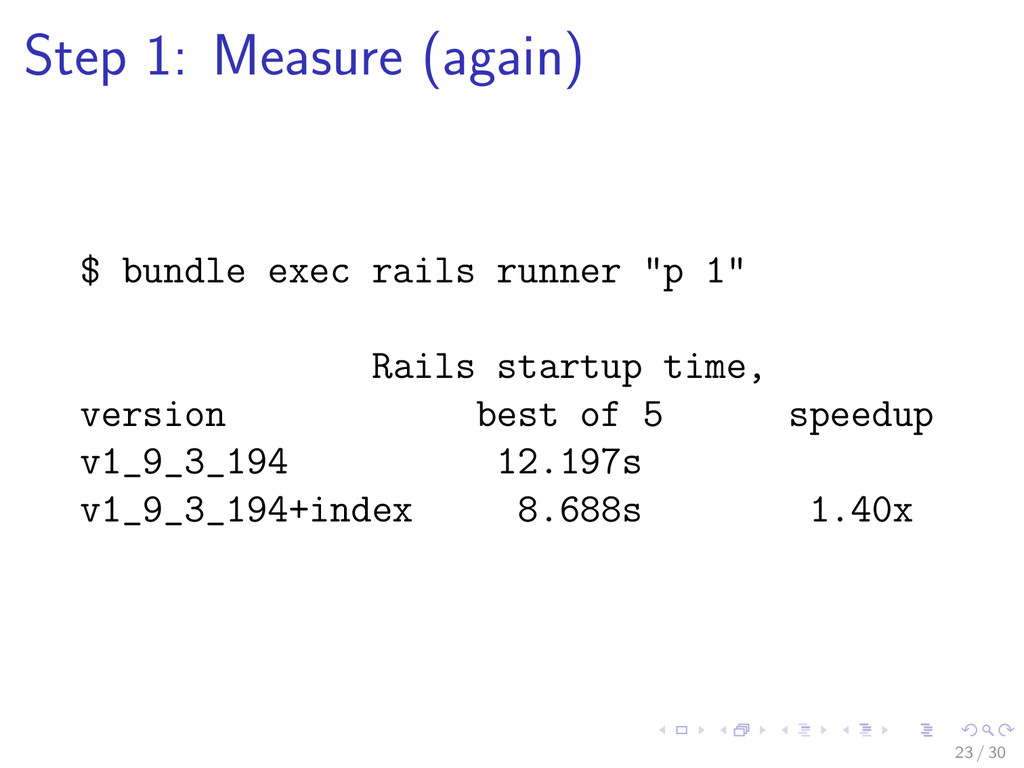
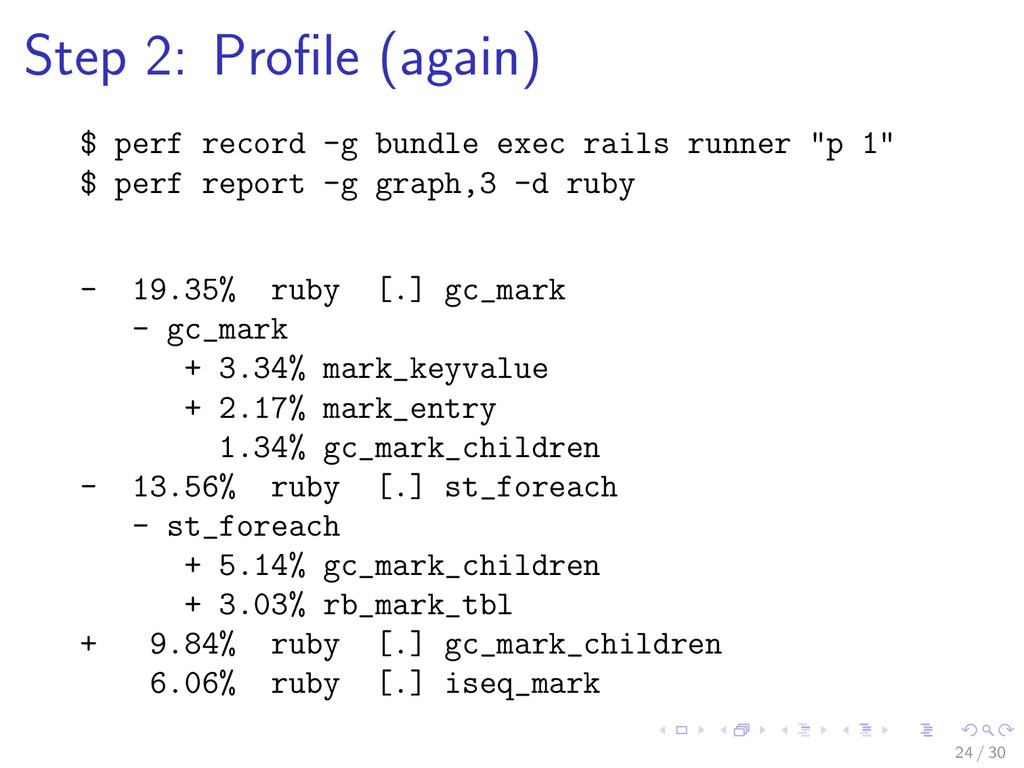
Ruby 2.0 starts applications in less than half the time taken by 1.9.3. We'll see the techniques I used to diagnose (and fix) the problem, which can be used for any performance problem in MRI or a C extension. The same principles apply to fixing performance problems in Ruby code.

(As delivered at Pivotal Labs in San Francisco, 2013-04-02.)

For a recording of the complete in-person presentation, see http://bostonrb.org/presentations/profiling-ruby (a slightly different version.)

Greg Price

April 02, 2013
Tweet

More Decks by Greg Price

Other Decks in Programming

Transcript

  1. Profiling Ruby, or, How I Made Rails Start Up 2x

    Faster Greg Price Solano Labs Pivotal Labs SF 2013-04-02 1 / 30
  2. (with 1.9.3-p194) $ date; bundle exec rails c Mon Oct

    29 18:26:11 PDT 2012 Time.now [waiting, waiting...] 3 / 30
  3. (with 1.9.3-p194) $ date; bundle exec rails c Mon Oct

    29 18:26:11 PDT 2012 Time.now Loading development environment (Rails 3.0.17) irb(main):001:0> Time.now => 2012-10-29 18:26:28 -0700 3 / 30
  4. Spoiler! (with my patches, as in Ruby 2.0) $ date;

    bundle exec rails c Thu Feb 7 18:36:45 PST 2013 Time.now 4 / 30
  5. Spoiler! (with my patches, as in Ruby 2.0) $ date;

    bundle exec rails c Thu Feb 7 18:36:45 PST 2013 Time.now Loading development environment (Rails 3.0.19) irb(main):001:0> Time.now => 2013-02-07 18:36:54 -0800 4 / 30
  6. Fixing performance problems 1. Measure the problem 2. Profile to

    locate the problem 3. Fix the problem 4. Repeat until fast 5 / 30
  7. Step 1: Measure $ bundle exec rails runner \ ’p

    $LOADED_FEATURES.size’ 2125 6 / 30
  8. Step 1: Measure $ mkdir reqtest $ for i in

    {1..10000}; do \ touch reqtest/$i.rb; done $ time ruby -I reqtest -e \ ’(1..10000).each {|i| require "#{i}"}’ 7 / 30
  9. Step 1: Measure require N empty files time avg. /

    N (best of 5) file 2000 0.286s 0.1ms 4000 0.838 0.2 8000 2.775 0.3 16000 10.677 0.7 32000 42.531 1.3 8 / 30
  10. Step 2: Profile $ perf record ruby -I reqtest -e

    \ ’(1..10000).each {|i| require "#{i}"}’ 9 / 30
  11. Step 2: Profile $ perf report 58.68% ruby libc-2.15.so 0x25820

    12.36% ruby ruby rb_string_value_ptr 7.90% ruby ruby rb_feature_p 6.19% ruby ruby loaded_feature_path 5.83% ruby [kernel] 0xc10359d8 10 / 30
  12. Step 2: Profile $ perf report -d ruby 37.20% ruby

    rb_string_value_ptr 23.78% ruby rb_feature_p 18.62% ruby loaded_feature_path 3.18% ruby 0x108e0 0.83% ruby file_expand_path 11 / 30
  13. Step 2a Call-graph profiling Ideally: $ perf record -g ruby

    ... $ perf report MRI adds a step 12 / 30
  14. Step 2a: Call-Graph Profiling for MRI 1. Build the Ruby

    interpreter with make debugflags=’-ggdb -fno-omit-frame-pointer’ (small slowdown, < 3%) 13 / 30
  15. Step 2a: Call-Graph Profiling for MRI 1. Build the Ruby

    interpreter with make debugflags=’-ggdb -fno-omit-frame-pointer’ (small slowdown, < 3%) then 2. perf record -g ruby ... 3. perf report (maybe -g to customize) 13 / 30
  16. Step 2a: Call-Graph Profiling $ perf report -g graph,1 -d

    ruby - 32.16% ruby rb_string_value_ptr - rb_string_value_ptr + 28.38% rb_feature_p + 3.78% rb_require_safe + 27.41% ruby rb_feature_p - 22.10% ruby loaded_feature_path - loaded_feature_path + 21.00% rb_feature_p + 1.11% rb_require_safe 14 / 30
  17. Step 2a: Call-Graph Profiling $ perf report -g graph,1 -d

    ruby - 32.16% ruby rb_string_value_ptr - rb_string_value_ptr + 28.38% rb feature p + 3.78% rb_require_safe + 27.41% ruby rb feature p - 22.10% ruby loaded_feature_path - loaded_feature_path + 21.00% rb feature p + 1.11% rb_require_safe 15 / 30
  18. Step 2a: Call-Graph Profiling $ perf report -g graph,1 -d

    ruby - 32.16% ruby rb_string_value_ptr - rb_string_value_ptr + 28.38% rb feature p + 3.78% rb_require_safe + 27.41% ruby rb feature p - 22.10% ruby loaded_feature_path - loaded_feature_path + 21.00% rb feature p + 1.11% rb_require_safe 76.79% rb feature p() in total 15 / 30
  19. Step 2: Profile For C code: (like MRI & extensions)

    Linux perf perf record $cmd perf report 16 / 30
  20. Step 2: Profile For C code: (like MRI & extensions)

    Linux perf perf record $cmd perf report For Ruby code: perftools.rb (can’t fit invocation here) 16 / 30
  21. Step 3: Fix load.c: static int rb_feature_p(const char *feature, const

    char *ext, int rb, int expanded, const char **fn) { VALUE v, features, p, load_path = 0; const char *f, *e; long i, len, elen, n; st_table *loading_tbl; st_data_t data; int type; if (fn) *fn = 0; if (ext) { elen = strlen(ext); len = strlen(feature) - elen; 17 / 30
  22. Step 3: Fix rb_feature_p(const char *feature, const char *ext, int

    rb, int expanded, const char **fn) { features = /* $LOADED_FEATURES aka $" */; /* for v in features */ { f = StringValuePtr(v); if (loaded feature path(f, /*f.size*/, feature, /*feature.size*/)) return ’u’; } /* also check get_loading_table() */ return 0; } 18 / 30
  23. Step 3: Fix Fix: hash table Complications: intricate match semantics

    $LOADED FEATURES mutable Complete fix: http://bugs.ruby-lang.org/issues/7158 19 / 30
  24. Step 1: Measure (again) $ time ruby -I reqtest -e

    \ ’(1..10000).each {|i| require "#{i}"}’ time speedup avg. / N (best of 5) file 2000 0.145 2.0x 0.07ms 4000 0.241 3.5 0.06 8000 0.700 4.0 0.09 16000 2.547 4.2 0.16 32000 10.053 4.2 0.31 22 / 30
  25. Step 1: Measure (again) $ bundle exec rails runner "p

    1" Rails startup time, version best of 5 speedup v1_9_3_194 12.197s v1_9_3_194+index 8.688s 1.40x 23 / 30
  26. Step 2: Profile (again) $ perf record -g bundle exec

    rails runner "p 1" $ perf report -g graph,3 -d ruby - 19.35% ruby [.] gc_mark - gc_mark + 3.34% mark_keyvalue + 2.17% mark_entry 1.34% gc_mark_children - 13.56% ruby [.] st_foreach - st_foreach + 5.14% gc_mark_children + 3.03% rb_mark_tbl + 9.84% ruby [.] gc_mark_children 6.06% ruby [.] iseq_mark 24 / 30
  27. Step 2: Profile (again), better $ perf report --blackbox garbage

    collect Not available in stock perf; I made it up https://github.com/gnprice/linux/commit/perf Maybe in Linux 3.9? 25 / 30
  28. Step 2: Profile (again), better $ perf record -g bundle

    exec rails runner 1 $ perf report --blackbox garbage_collect \ -g graph,3 -d ruby - garbage_collect + garbage_collect - vm_xmalloc - 82.87% str_new - 96.08% rb_usascii_str_new - 98.32% rb_file_expand_path rb_get_expanded_load_path rb_feature_p + rb_require_safe 26 / 30
  29. Step 3: Fix (again) Cache the result of that work

    Complications: $LOAD PATH mutable (important!) cwd, etc, etc mutable too 27 / 30
  30. Step 3: Fix (again) Cache the result of that work

    Complications: $LOAD PATH mutable (important!) cwd, etc, etc mutable too Complete fix: http://bugs.ruby-lang.org/issues/7158 27 / 30
  31. Step 1: Measure (last time) $ bundle exec rails runner

    "p 1" Rails startup time, version best of 5 speedup v1_9_3_194 12.197s v1_9_3_194+index 8.688s 1.40x v1_9_3_194+index+cache 5.538s 2.20x 29 / 30
  32. End My patches in Ruby 2.0: http://bugs.ruby-lang.org/issues/7158 My --blackbox patch

    to Linux perf: http://github.com/gnprice/linux/commit/perf These slides: http://speakerdeck.com/gnprice/profiling-ruby 30 / 30