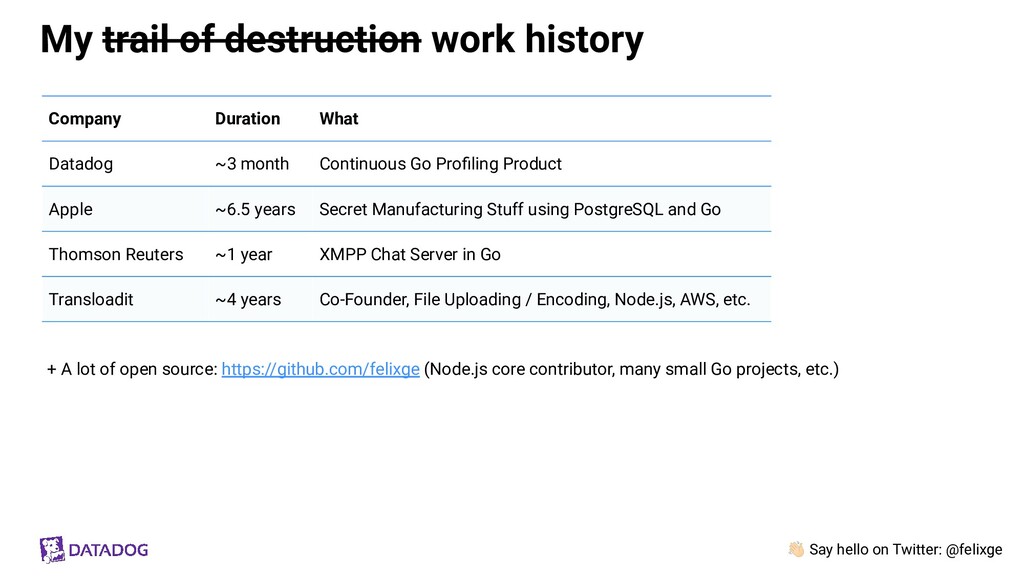
~3 month Continuous Go Profiling Product Apple ~6.5 years Secret Manufacturing Stuff using PostgreSQL and Go Thomson Reuters ~1 year XMPP Chat Server in Go Transloadit ~4 years Co-Founder, File Uploading / Encoding, Node.js, AWS, etc. My trail of destruction work history + A lot of open source: https://github.com/felixge (Node.js core contributor, many small Go projects, etc.)
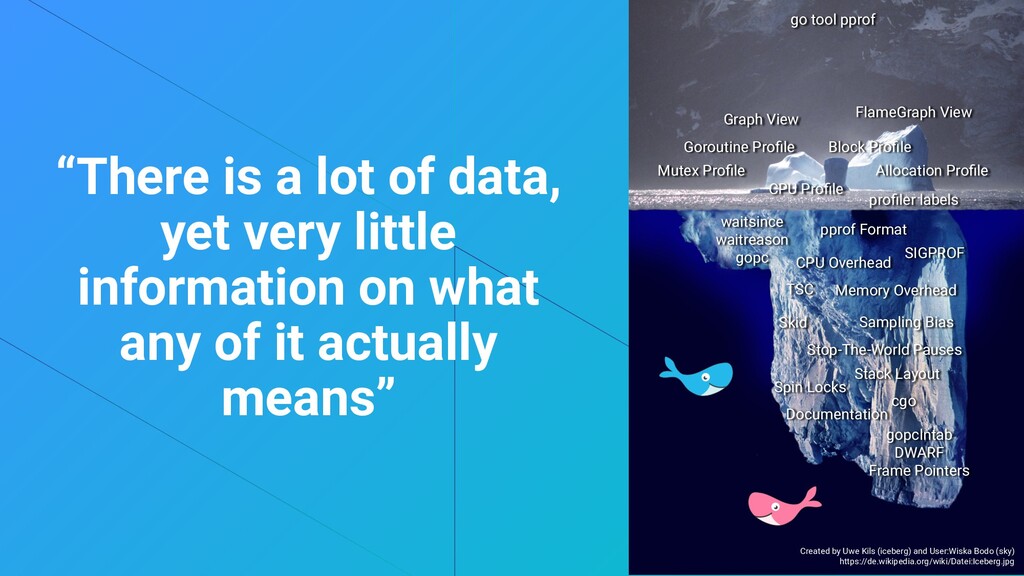
of data, yet very little information on what any of it actually means” FlameGraph View go tool pprof CPU Profile Allocation Profile Goroutine Profile Mutex Profile Block Profile gopclntab DWARF Frame Pointers Stop-The-World Pauses CPU Overhead Sampling Bias pprof Format SIGPROF Memory Overhead TSC Spin Locks profiler labels waitsince waitreason gopc Skid Stack Layout cgo Graph View Created by Uwe Kils (iceberg) and User:Wiska Bodo (sky) https://de.wikipedia.org/wiki/Datei:Iceberg.jpg Documentation
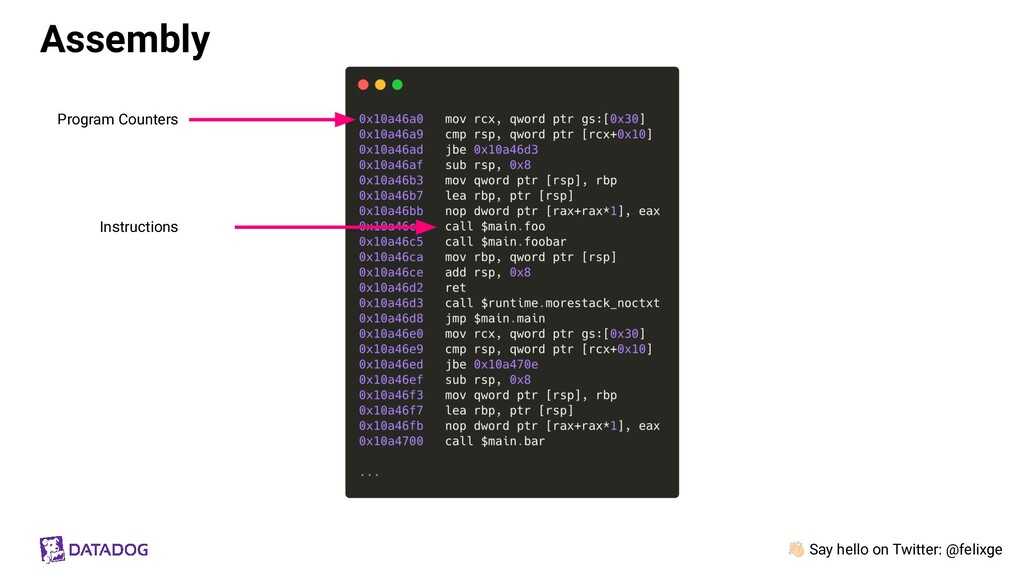
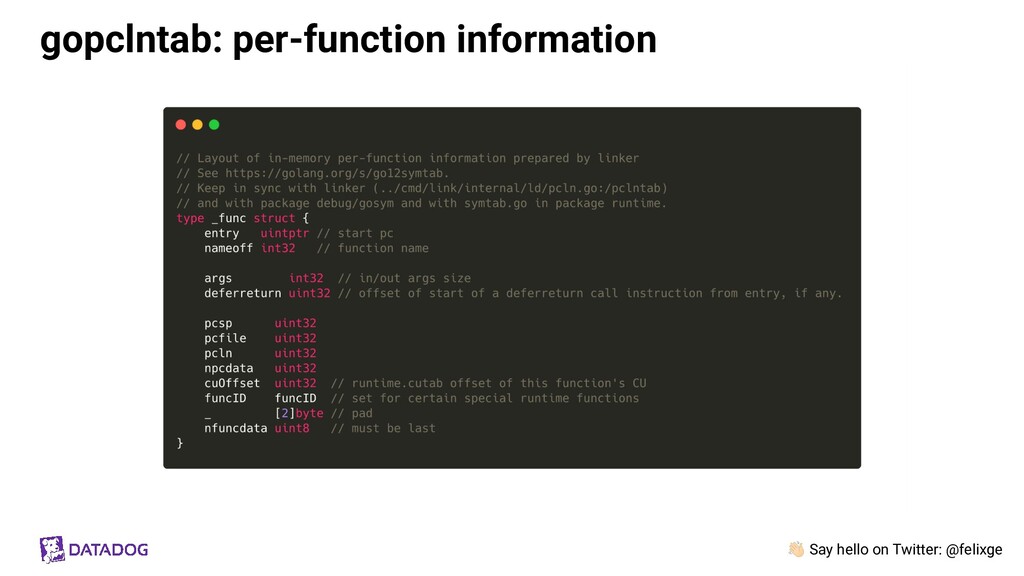
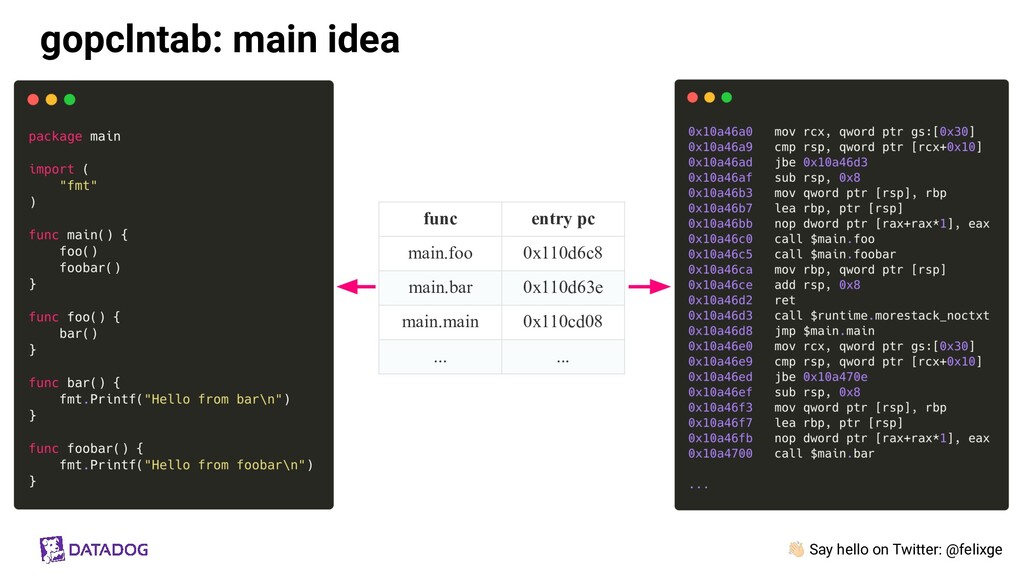
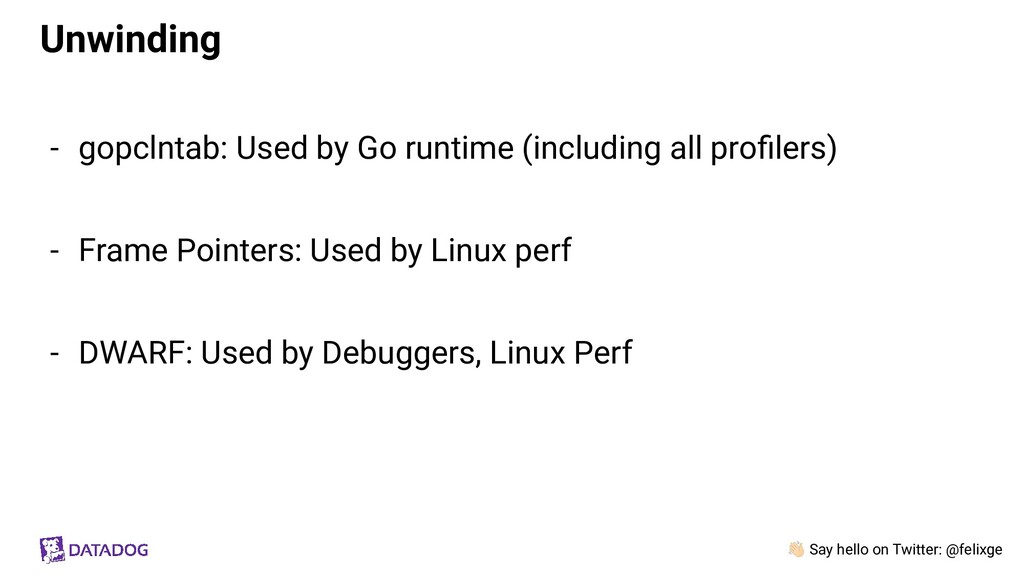
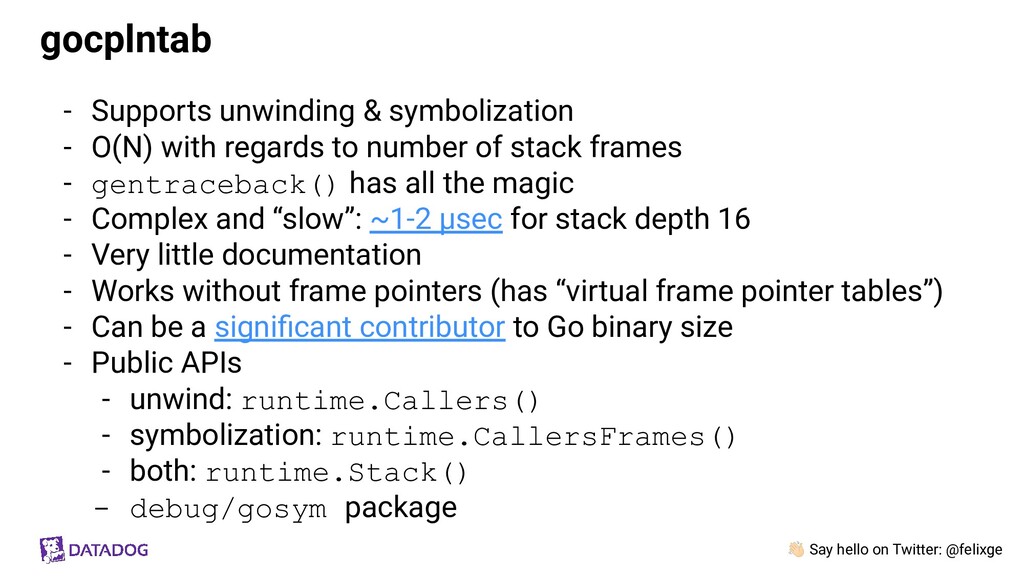
symbolization - O(N) with regards to number of stack frames - gentraceback() has all the magic - Complex and “slow”: ~1-2 µsec for stack depth 16 - Very little documentation - Works without frame pointers (has “virtual frame pointer tables”) - Can be a significant contributor to Go binary size - Public APIs - unwind: runtime.Callers() - symbolization: runtime.CallersFrames() - both: runtime.Stack() - debug/gosym package gocplntab
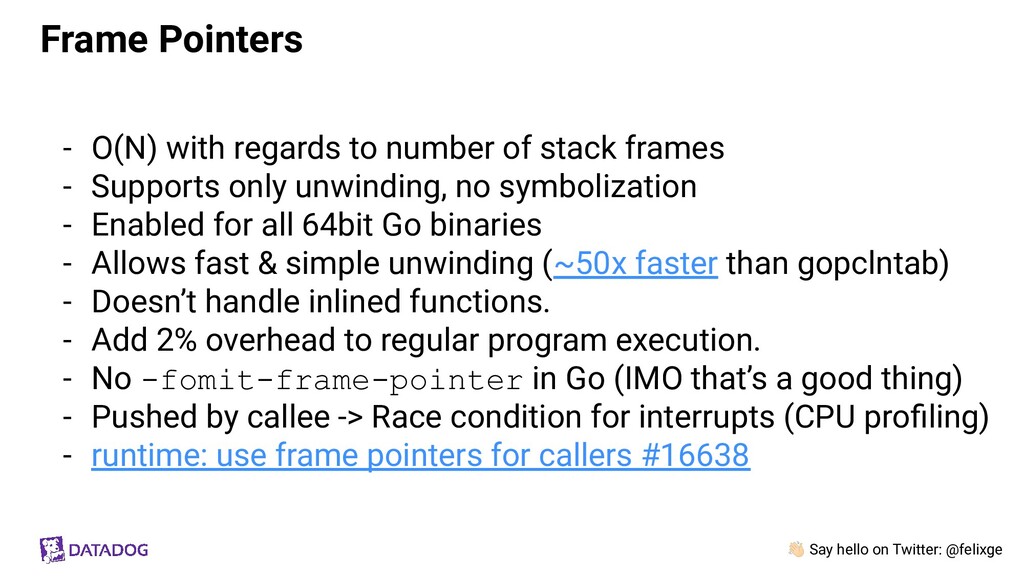
to number of stack frames - Supports only unwinding, no symbolization - Enabled for all 64bit Go binaries - Allows fast & simple unwinding (~50x faster than gopclntab) - Doesn’t handle inlined functions. - Add 2% overhead to regular program execution. - No -fomit-frame-pointer in Go (IMO that’s a good thing) - Pushed by callee -> Race condition for interrupts (CPU profiling) - runtime: use frame pointers for callers #16638 Frame Pointers
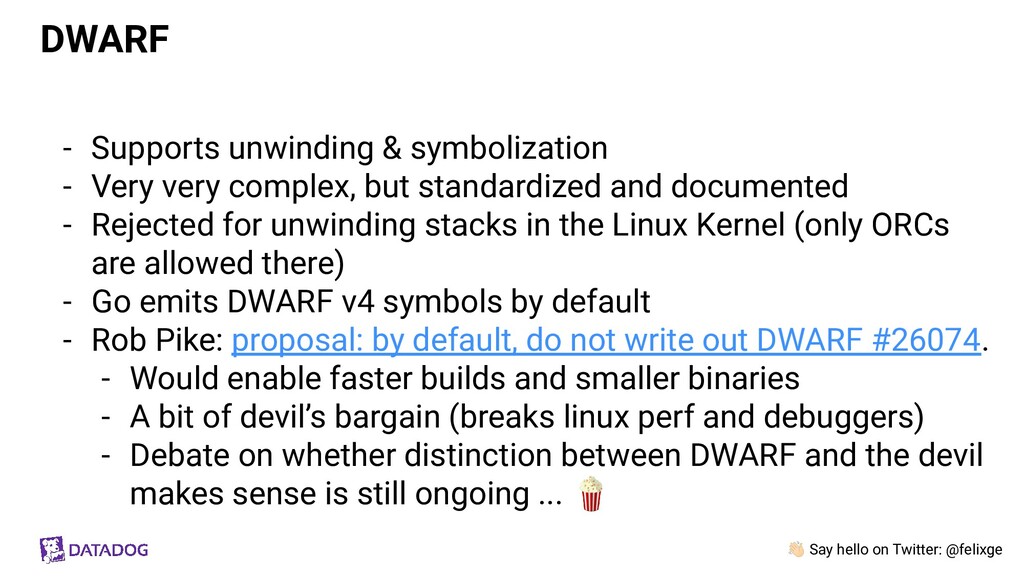
symbolization - Very very complex, but standardized and documented - Rejected for unwinding stacks in the Linux Kernel (only ORCs are allowed there) - Go emits DWARF v4 symbols by default - Rob Pike: proposal: by default, do not write out DWARF #26074. - Would enable faster builds and smaller binaries - A bit of devil’s bargain (breaks linux perf and debuggers) - Debate on whether distinction between DWARF and the devil makes sense is still ongoing ... 🍿 DWARF
Information: https://github.com/DataDog/go-profiler-notes/blob/main/stack-traces.md Michael Pratt from the Go team for helping me with gopclntab questions and review.
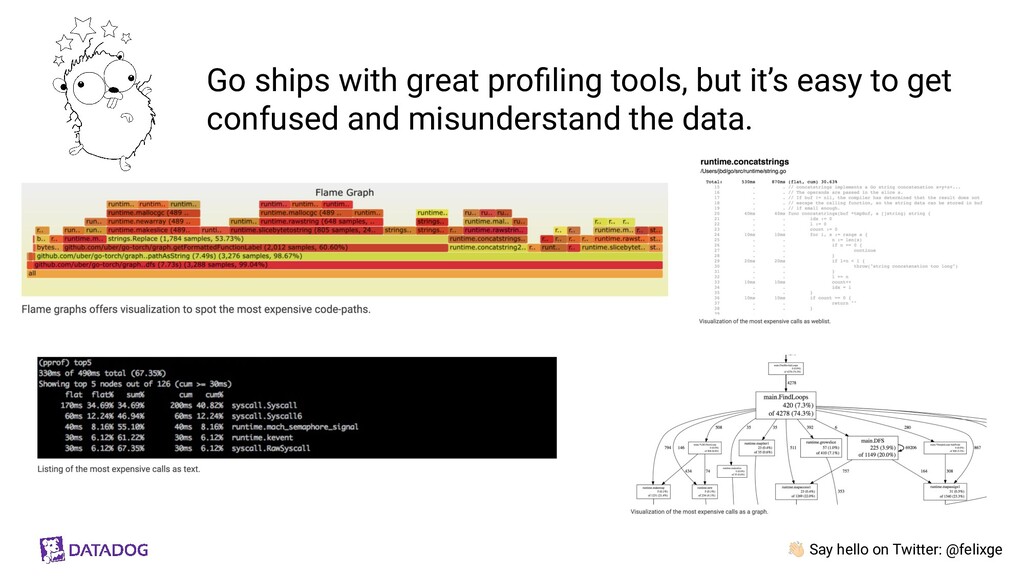
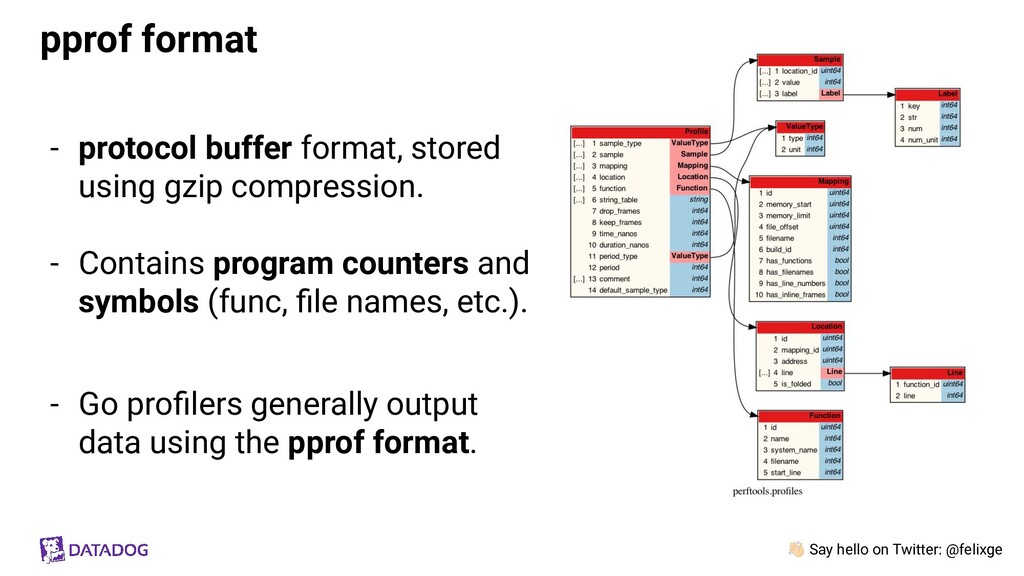
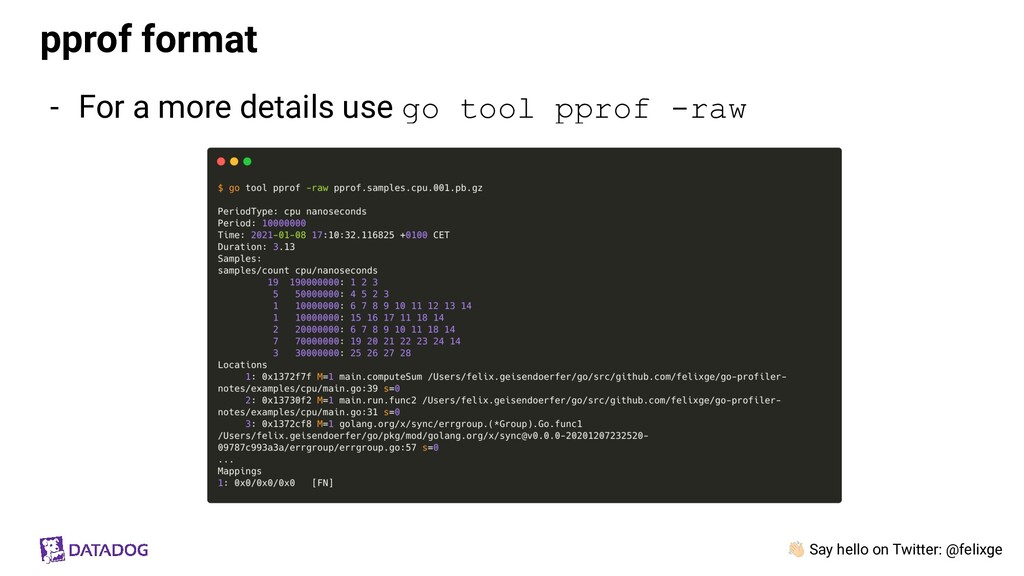
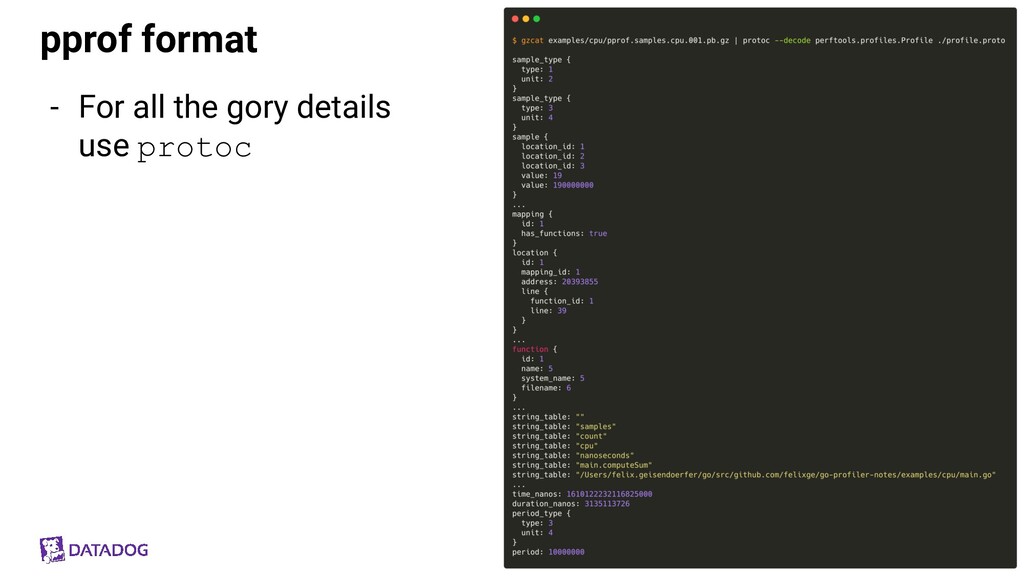
stored using gzip compression. - Contains program counters and symbols (func, file names, etc.). - Go profilers generally output data using the pprof format. pprof format
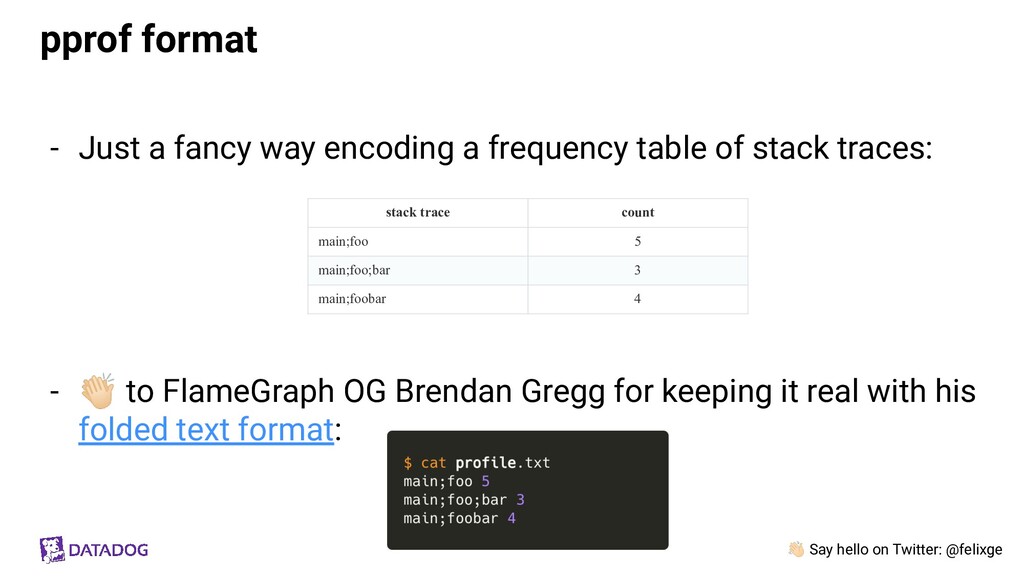
a fancy way encoding a frequency table of stack traces: - to FlameGraph OG Brendan Gregg for keeping it real with his folded text format: stack trace count main;foo 5 main;foo;bar 3 main;foobar 4
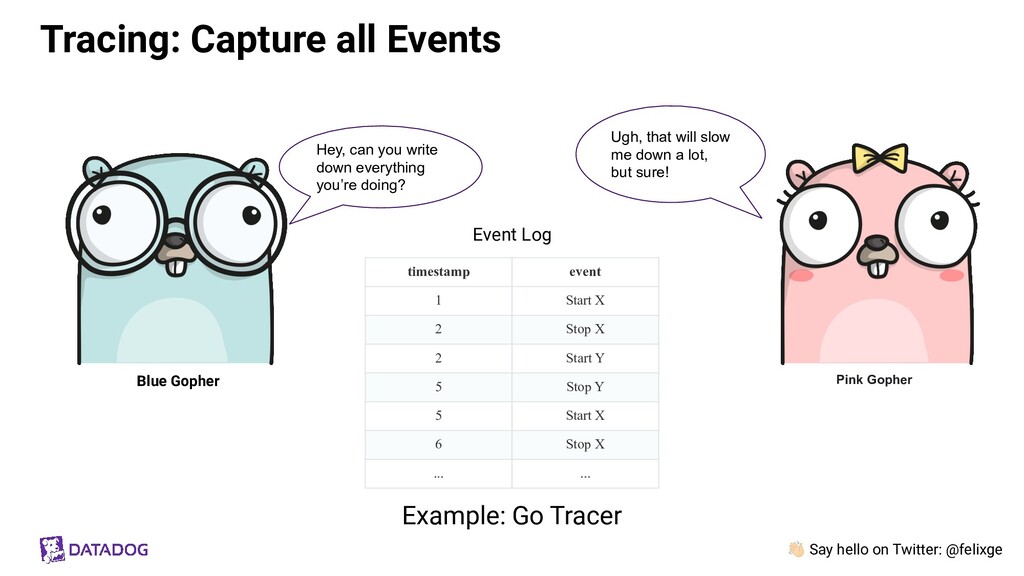
Hey, can you write down everything you’re doing? Ugh, that will slow me down a lot, but sure! timestamp event 1 Start X 2 Stop X 2 Start Y 5 Stop Y 5 Start X 6 Stop X ... ... Event Log Blue Gopher Pink Gopher Example: Go Tracer
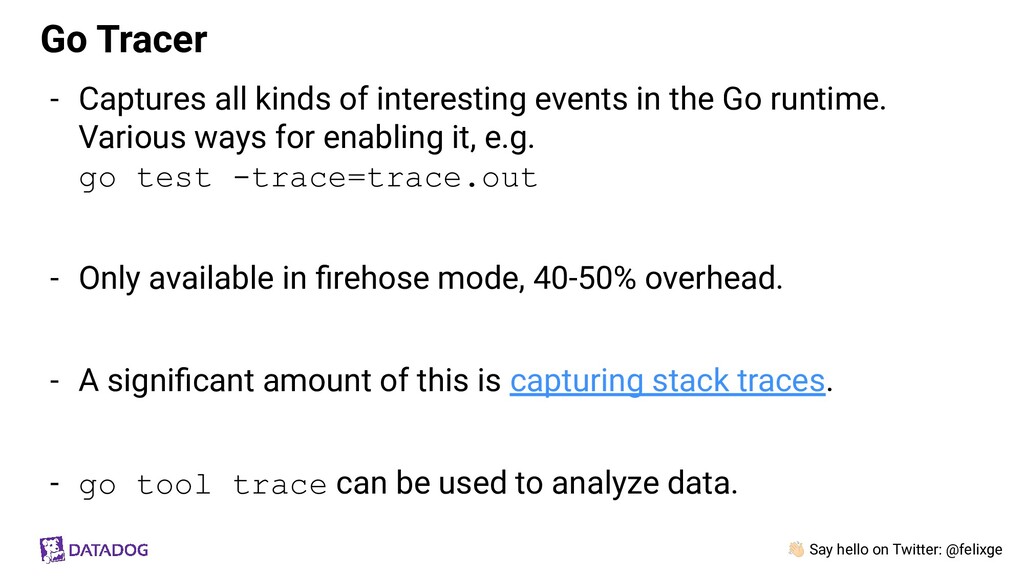
all kinds of interesting events in the Go runtime. Various ways for enabling it, e.g. go test -trace=trace.out - Only available in firehose mode, 40-50% overhead. - A significant amount of this is capturing stack traces. - go tool trace can be used to analyze data.
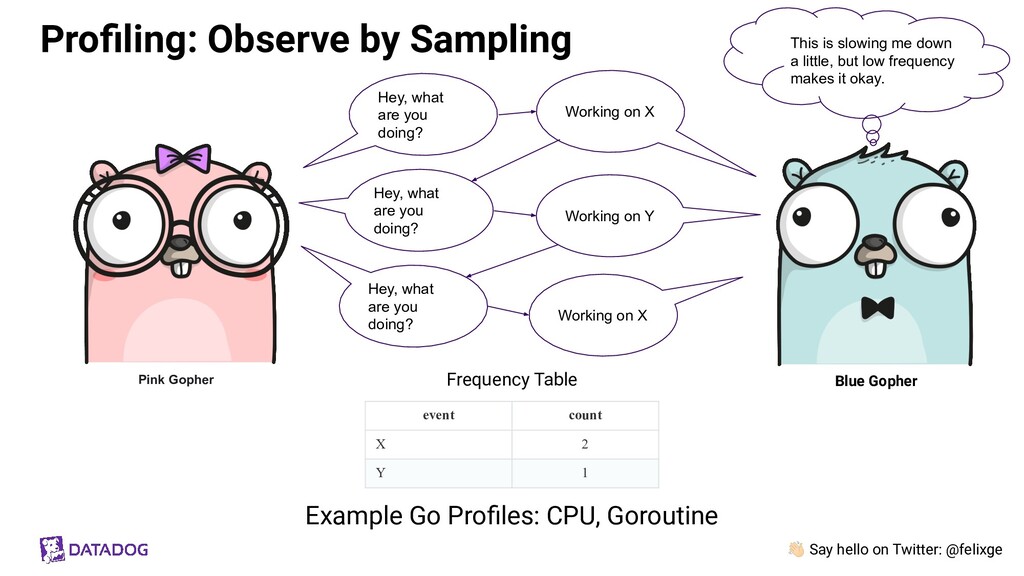
down a little, but low frequency makes it okay. Profiling: Observe by Sampling Hey, what are you doing? Working on X Hey, what are you doing? Working on Y Hey, what are you doing? Working on X event count X 2 Y 1 Frequency Table Blue Gopher Example Go Profiles: CPU, Goroutine Pink Gopher
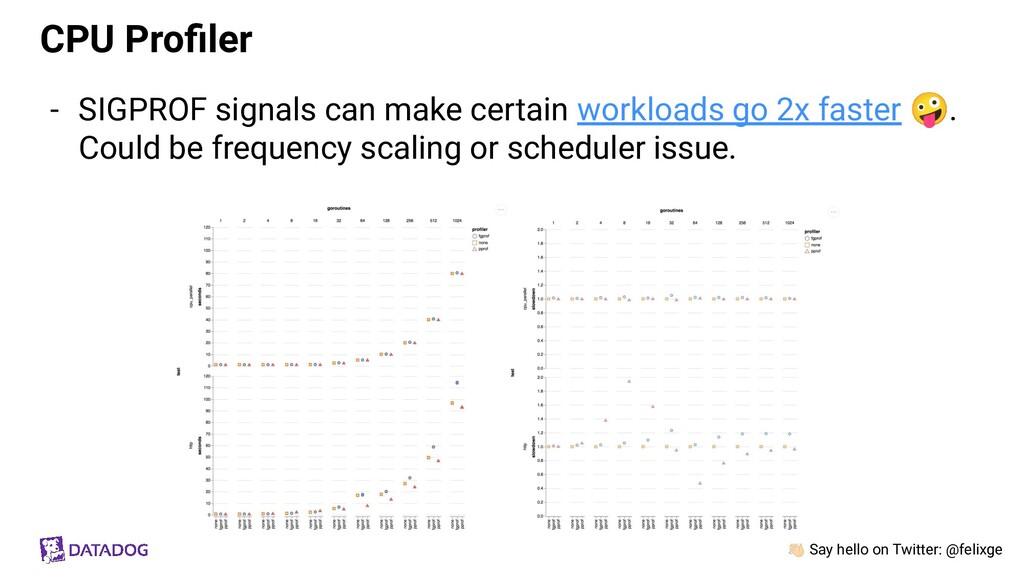
setitimer(2) system call to interrupt and stop Go program 100 times per second. - Interrupt happens via SIGPROF signals delivered to “random” threads. Interrupted thread takes stack trace. - Minor Issues: Signal Deliver Bias, Skid, Overhead (a few %), etc. - pprof profile looks like this: stack trace samples/count cpu/nanoseconds main;foo 5 50000000 main;foo;bar 3 30000000 main;foobar 4 40000000
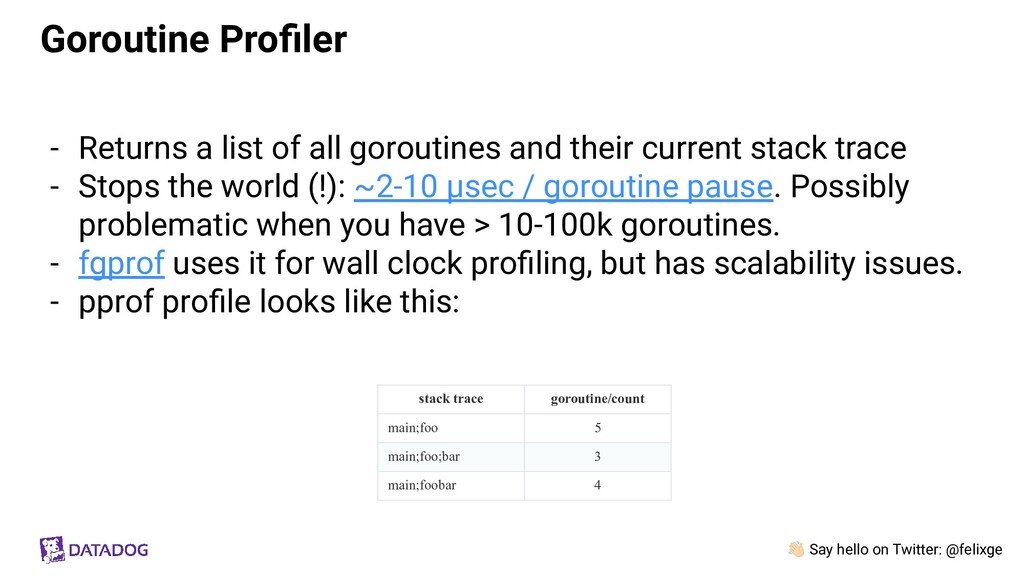
a list of all goroutines and their current stack trace - Stops the world (!): ~2-10 µsec / goroutine pause. Possibly problematic when you have > 10-100k goroutines. - fgprof uses it for wall clock profiling, but has scalability issues. - pprof profile looks like this: stack trace goroutine/count main;foo 5 main;foo;bar 3 main;foobar 4
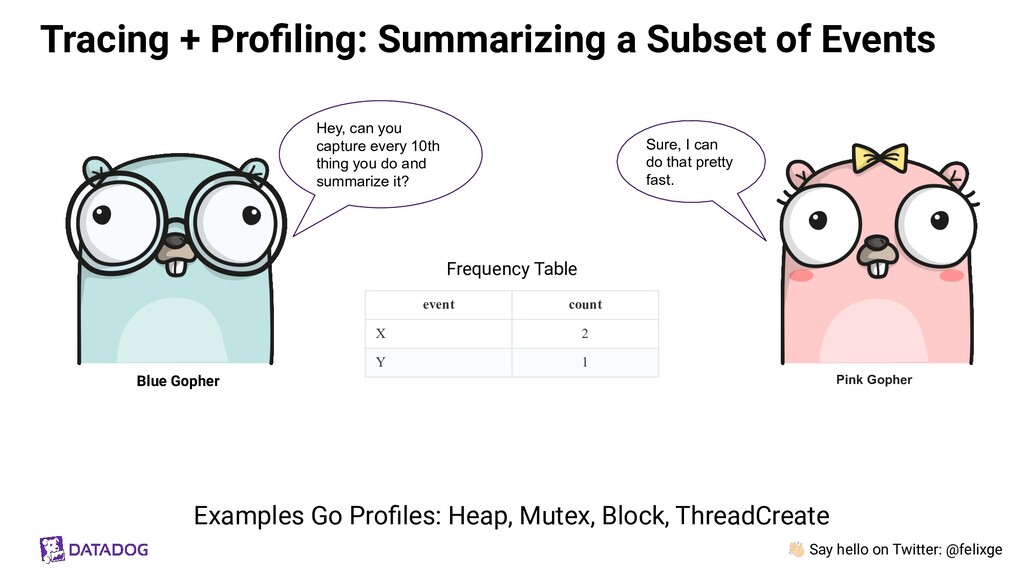
a Subset of Events Hey, can you capture every 10th thing you do and summarize it? Sure, I can do that pretty fast. Pink Gopher event count X 2 Y 1 Frequency Table Examples Go Profiles: Heap, Mutex, Block, ThreadCreate Blue Gopher
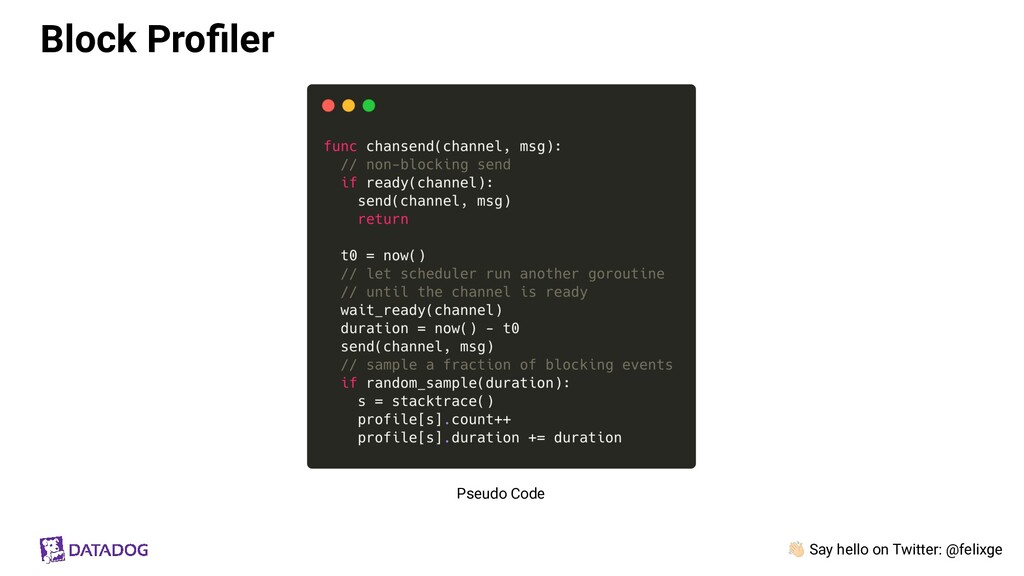
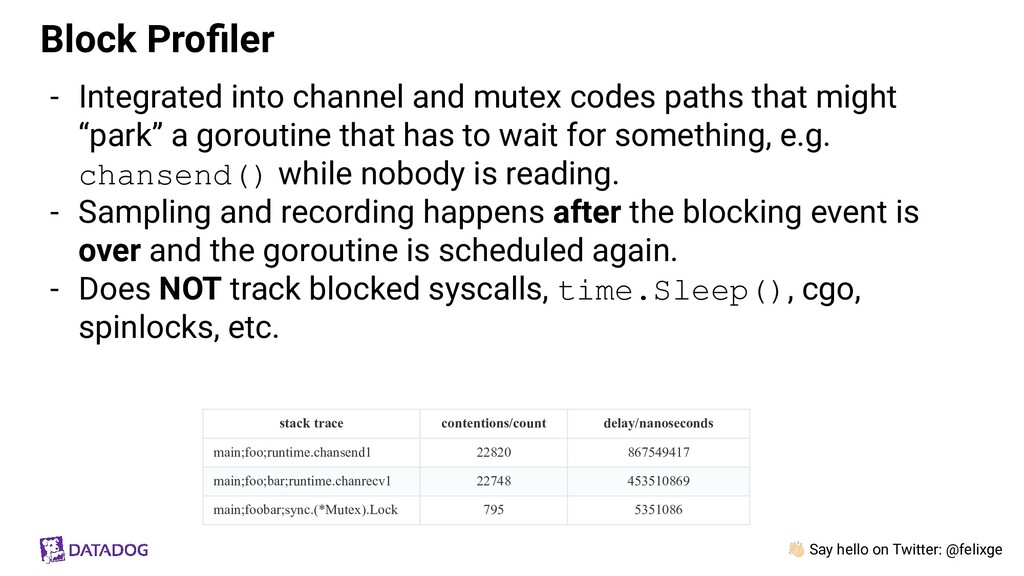
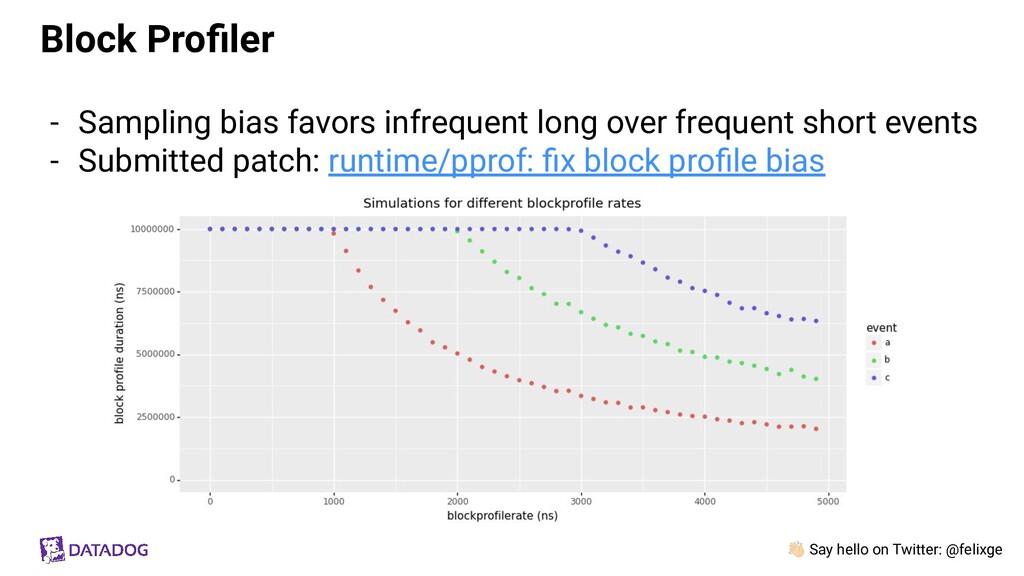
into channel and mutex codes paths that might “park” a goroutine that has to wait for something, e.g. chansend() while nobody is reading. - Sampling and recording happens after the blocking event is over and the goroutine is scheduled again. - Does NOT track blocked syscalls, time.Sleep(), cgo, spinlocks, etc. stack trace contentions/count delay/nanoseconds main;foo;runtime.chansend1 22820 867549417 main;foo;bar;runtime.chanrecv1 22748 453510869 main;foobar;sync.(*Mutex).Lock 795 5351086
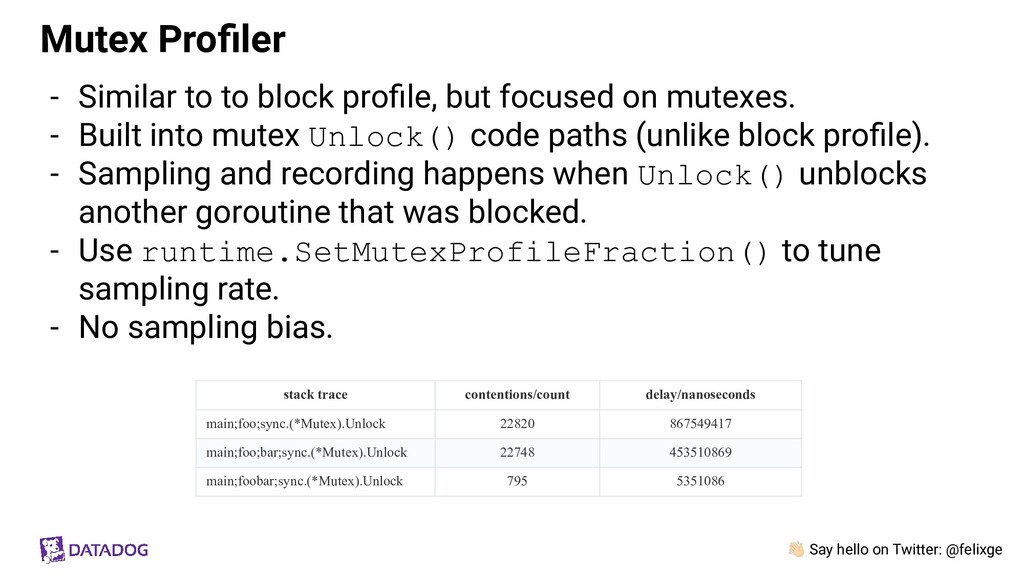
block profile, but focused on mutexes. - Built into mutex Unlock() code paths (unlike block profile). - Sampling and recording happens when Unlock() unblocks another goroutine that was blocked. - Use runtime.SetMutexProfileFraction() to tune sampling rate. - No sampling bias. Mutex Profiler stack trace contentions/count delay/nanoseconds main;foo;sync.(*Mutex).Unlock 22820 867549417 main;foo;bar;sync.(*Mutex).Unlock 22748 453510869 main;foobar;sync.(*Mutex).Unlock 795 5351086
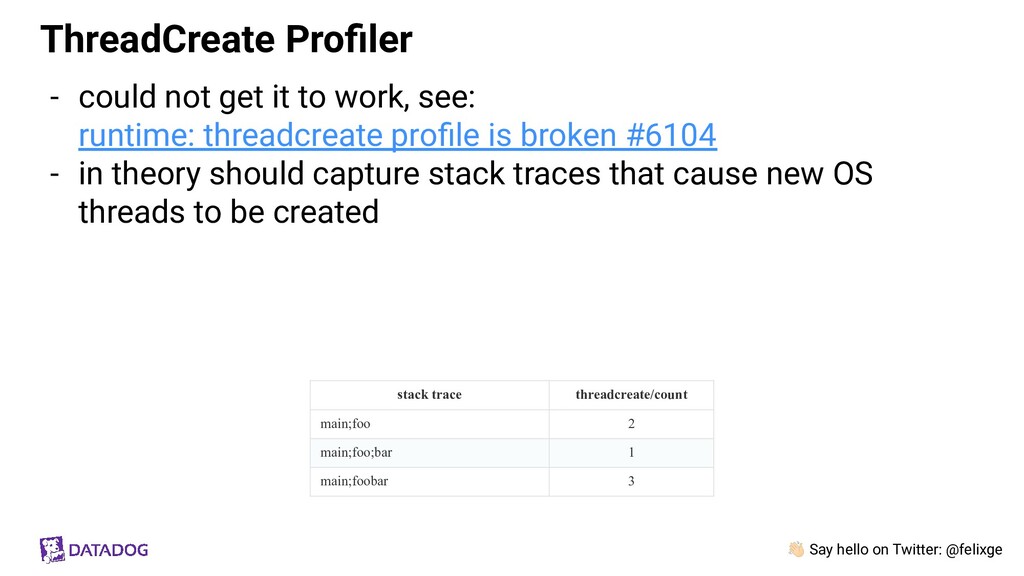
it to work, see: runtime: threadcreate profile is broken #6104 - in theory should capture stack traces that cause new OS threads to be created ThreadCreate Profiler stack trace threadcreate/count main;foo 2 main;foo;bar 1 main;foobar 3
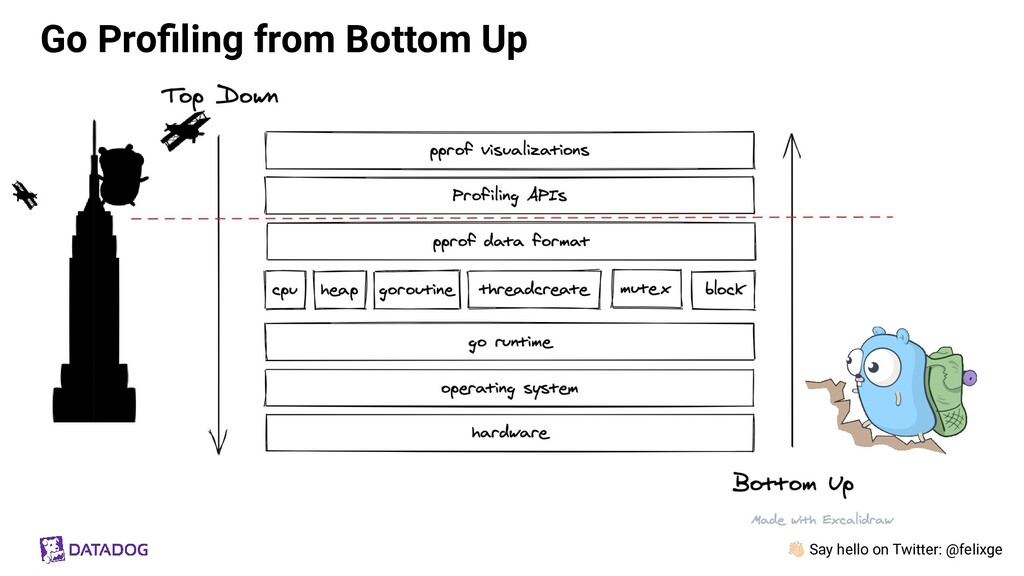
stack traces are load bearing subsystem. - Go uses various techniques: Tracing, Profiling, Hybrid - Understanding how the data is collected is important to do safe profiling in production and interpret the resulting data correctly.
Gopher by Renee French - BBQ Gopher by @RuixRicardo - Black & White Gophers by Olga Shalakhina - Bottom up Gopher & King Kong Gopher by Egon Elbre - GopherNotes Gopher by Marcus Olsson - Lots of Gophers by Ashley McNamara Questions? Watch https://github.com/DataDog/go-profiler-notes for more research