Upgrade to Pro — share decks privately, control downloads, hide ads and more …

EnergyCoupon Project: Demand Response in Retail Markets

gridx.tamu
November 03, 2016

EnergyCoupon Project: Demand Response in Retail Markets

Hao Ming (TAMU), Grid-X Program Presentation on Day 1 (Nov.3) of Workshop on Architecture and Economics of the Future Grid

gridx.tamu

November 03, 2016
Tweet

More Decks by gridx.tamu

Other Decks in Research

Transcript

  1. EnergyCoupon Project: Demand Response in Retail Markets Presenter: Hao Ming

    TAMU EnergyCoupon Group Advisor: Dr. Le Xie, Dr. Srinivas Shakkottai 1
  2. 3 Why we need real-time DR? High price occurs in

    these intervals LSE could benefit from energy savings in hours with high prices
  3. What we are interested in How to… Incentivize people to

    demand response Measure power reduction Analyze personal behavior & benefit 4
  4. Software Development Smartmeter Texas ERCOT Data Weather Data SQL Database

    Peak Time Estimate Tips and Usage Statistics Lottery Coupon Generation Baseline Estimate Android & IOS Versions available
  5. How EnergyCoupon Works Price Prediction Target Setting Coupons & Lottery

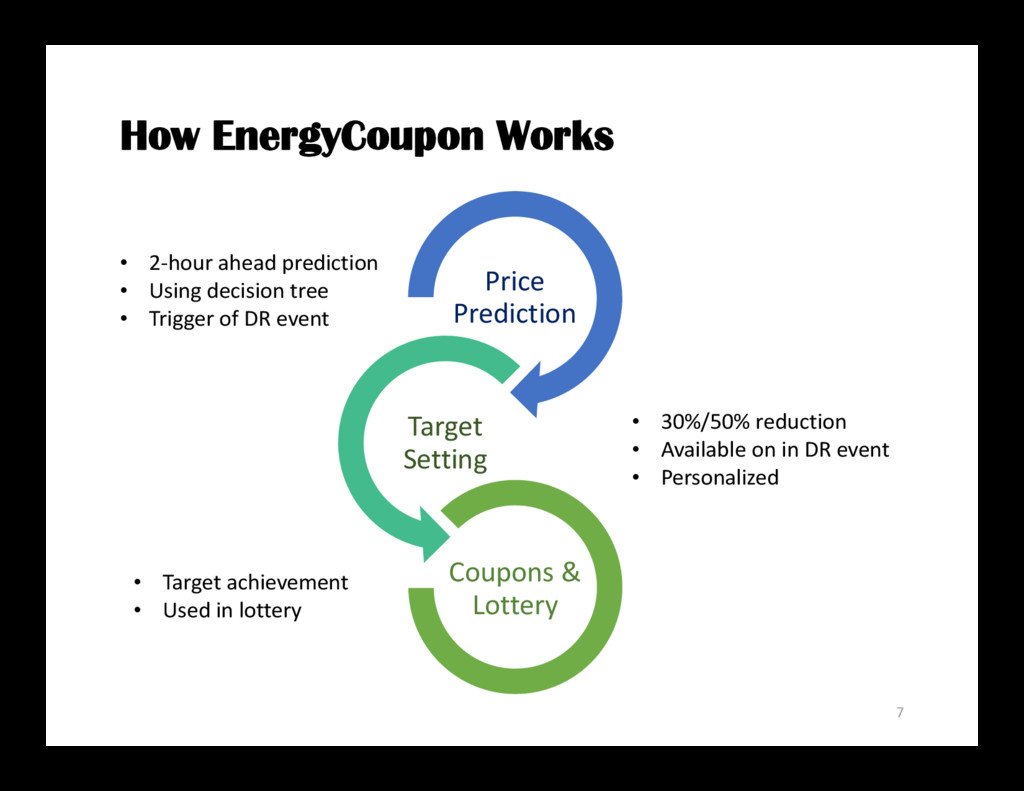
    • 2‐hour ahead prediction • Using decision tree • Trigger of DR event • 30%/50% reduction • Available on in DR event • Personalized • Target achievement • Used in lottery 7
  6. Target Setting & Baseline Prediction How to calculate power reduction?

    Reduction = Baseline ‐ Consumption Obtain data from smart meters Power consumption without DR Used in target settlement & analysis 9
  7. Target Setting & Baseline Prediction Historical data Experimental data Past

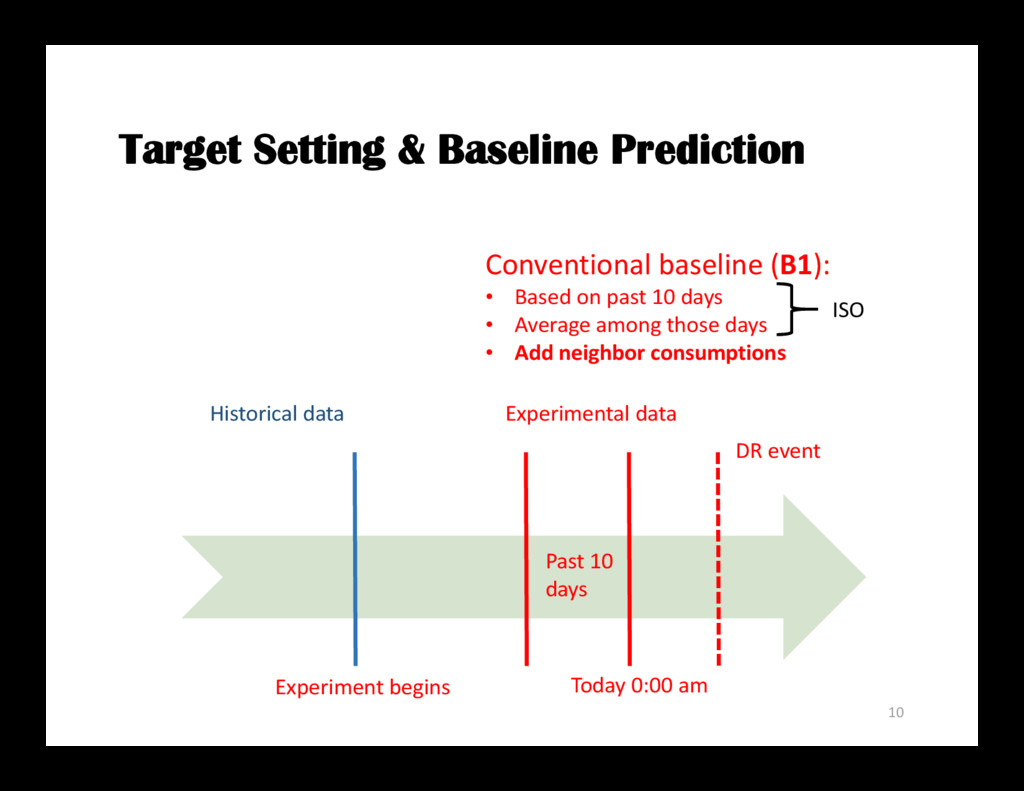
    10 days Experiment begins Conventional baseline (B1): • Based on past 10 days • Average among those days • Add neighbor consumptions ISO Today 0:00 am DR event 10
  8. Target Setting & Baseline Prediction Updated baseline (B2): • Based

    on historical data • Find days with similar temperature • Average among those days 11 Average over corresponding consumption curves
  9. Customer Behavior: An Inactive User symmetric distribution Jun 11‐30 energy

    saving = 6.8% Jul 1‐31 energy saving = 7.6% Aug 1‐26 energy saving = 1.3% Updated Baseline 12 (B1) (B2) (B2) (B2) (B1) (B1)
  10. Customer Behavior: An Active User concentrated in the positive axle

    Inactive behavior on Aug Jun 11‐30 energy saving = 39.8% Jul 1‐31 energy saving = 32.3% Aug 1‐26 energy saving = 1.7% 13 (B1) (B1) (B1) (B2) (B2) (B2)
  11. Experiment: Summary ‐30.00% ‐20.00% ‐10.00% 0.00% 10.00% 20.00% 30.00% 40.00%

    50.00% 1 2 3 4 5 6 7 8 9 Monthly Energy Saving for Participants maximum saving minimum saving 14
  12. Experiment: Summary ‐30.00% ‐20.00% ‐10.00% 0.00% 10.00% 20.00% 30.00% 40.00%

    50.00% 1 2 3 4 5 6 7 8 9 Monthly Energy Saving for Participants maximum saving minimum saving Active users Inactive users 15
  13. • Conventional baseline using past workdays have bias, especially when

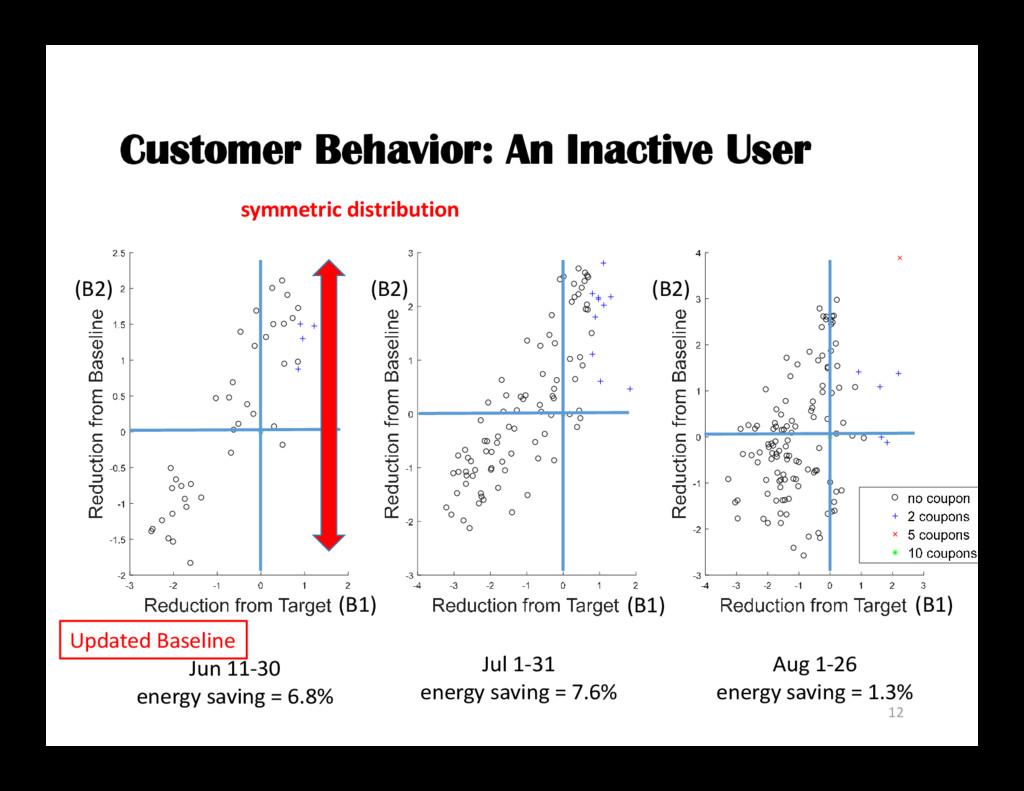
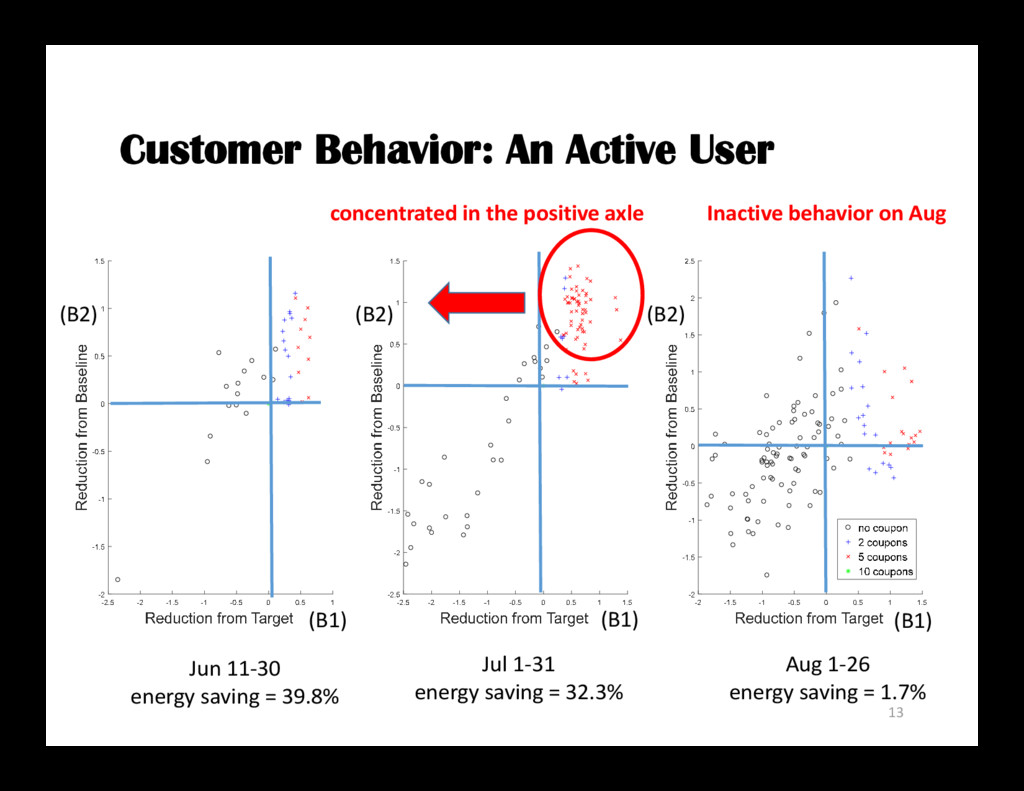
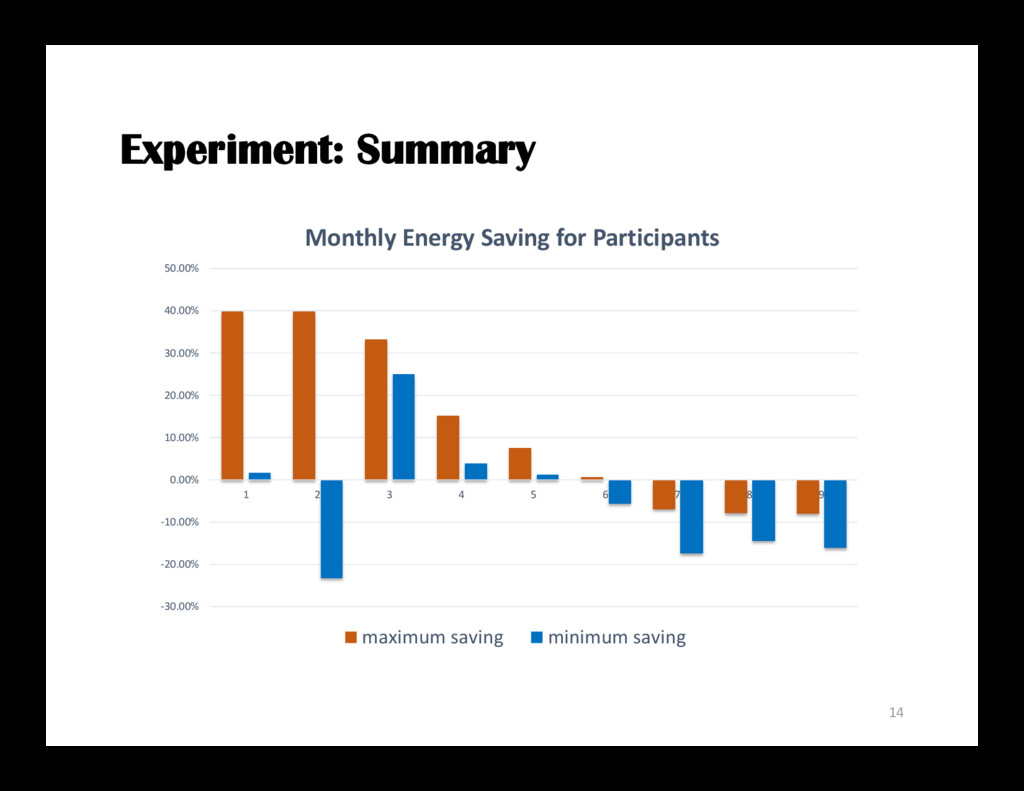
    past consumption is influenced by any DR events • According to our experiment, active user can save as much as 30% of energy (monthly average) in DR events • Inactive users’ power consumption is symmetrically distributed using updated baseline • Future work will concentrate on profitability analysis on our EnergyCoupon project. Conclusion 16
  14. 17

  15. User ID 38 44 45 46 47 48 49 50

    51 Total coupons 268 148 118 133 546 83 73 157 205 Coupons (Jun) 151 19 19 17 94 23 17 17 25 Coupons (Jul) 58 49 25 45 321 35 25 27 87 Coupons (Aug) 59 80 74 71 131 25 31 113 93 Max monthly reduction 39.79% ‐7.81% 0.71% ‐6.86% 39.80% 7.63% ‐7.98% 33.24% 15.29% Min monthly reduction ‐23.20% ‐14.37% ‐5.58% ‐17.31% 1.72% 1.32% ‐16.04% 25.08% 3.97% Appendix II: Behavior on each user 19