Investigation of Strategic Behavior in Energy and Reserve co optimizing Markets with DER Participation Texas A&M, November 4, 2016 Michael Caramanis [email protected]
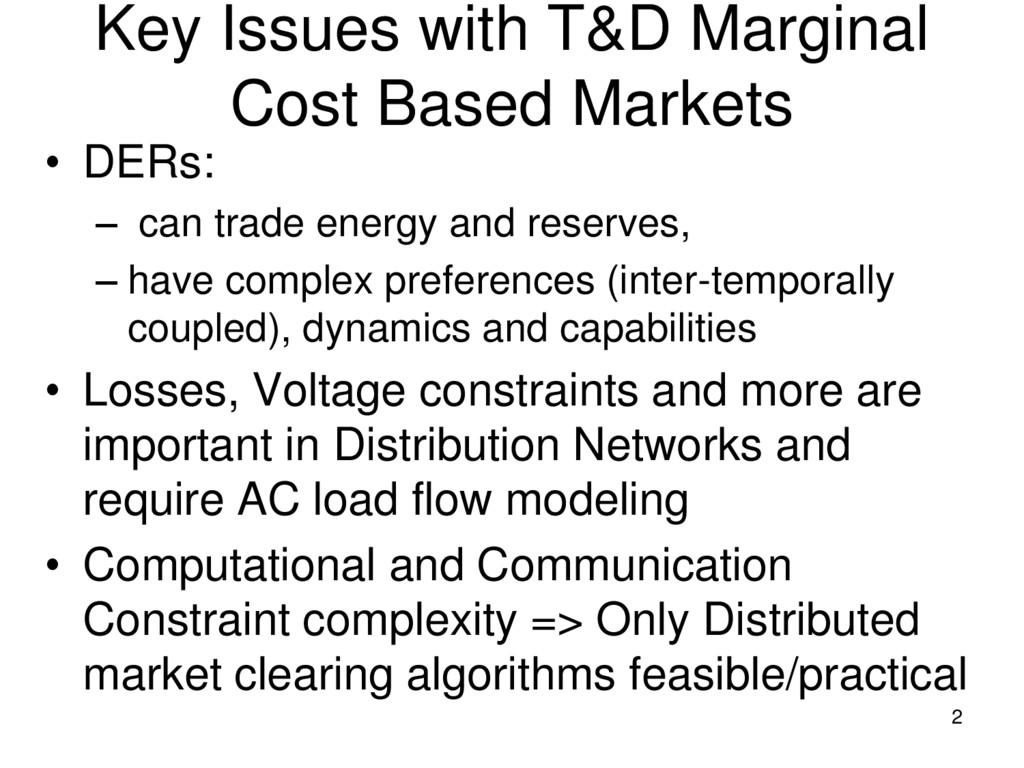
– can trade energy and reserves, – have complex preferences (inter-temporally coupled), dynamics and capabilities • Losses, Voltage constraints and more are important in Distribution Networks and require AC load flow modeling • Computational and Communication Constraint complexity => Only Distributed market clearing algorithms feasible/practical 2
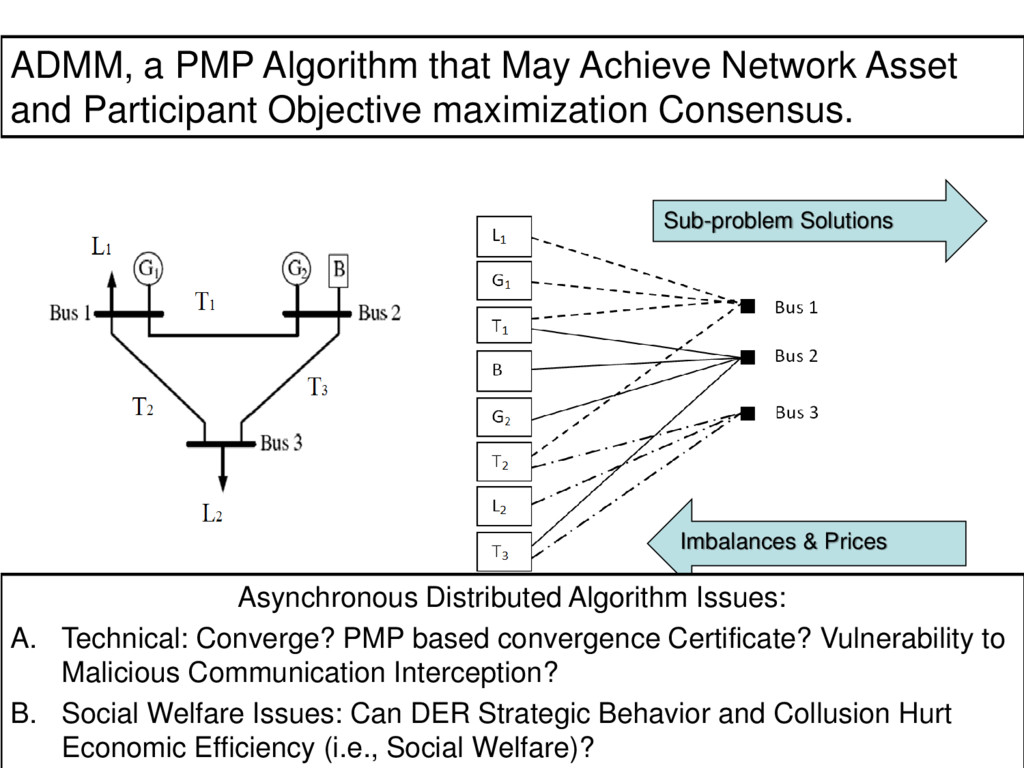
May Achieve Network Asset and Participant Objective maximization Consensus. Asynchronous Distributed Algorithm Issues: A. Technical: Converge? PMP based convergence Certificate? Vulnerability to Malicious Communication Interception? B. Social Welfare Issues: Can DER Strategic Behavior and Collusion Hurt Economic Efficiency (i.e., Social Welfare)?
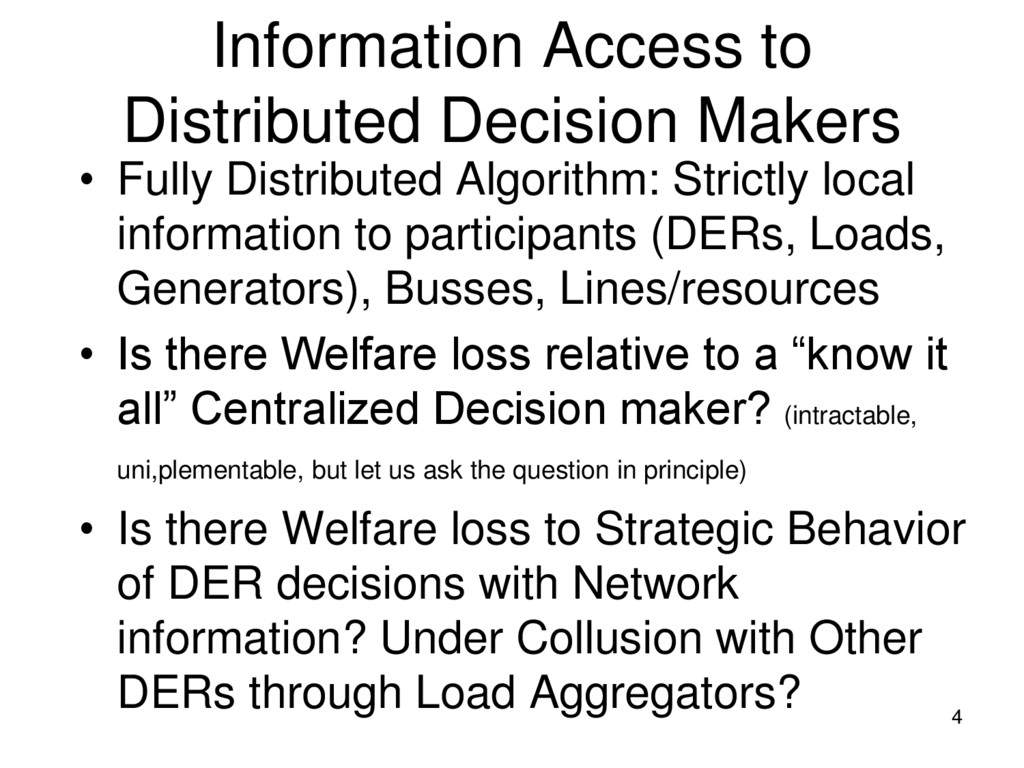
Strictly local information to participants (DERs, Loads, Generators), Busses, Lines/resources • Is there Welfare loss relative to a “know it all” Centralized Decision maker? (intractable, uni,plementable, but let us ask the question in principle) • Is there Welfare loss to Strategic Behavior of DER decisions with Network information? Under Collusion with Other DERs through Load Aggregators? 4
preferences, Dynamics, and Capabilities of all DERs • But ISO either knows all DSO information OR Interfaces with DSO on losses Info. Distribution Network info, CN , => Centralized Decision Maker Schedules Generators and DERs while knowing Detailed Loss and marginal loss functional terms No Distribution Network info, C, => Centralized Decision Maker Schedules Generator and DERs with DSO providing Loss and Marginal Loss Estimates. (Some iterations are needed here to convergence) 5
Estimates, each DER Schedules it self iteratively based on Information Access: DN,A Full Network information, in collution with other DERs DN Full Network info but no collusion D No network Information, DLMP estimate provided • Given DER Tentative Schedule ISO Scheduled generators, calculates Expost LMPs and provides new estimate of LMP. Updated DLMP estimated by DERs based on Network Info or DSO conversion of LMP to DLMP estimates • With appropriate DLMP Estimate update process convergence is possible. 6
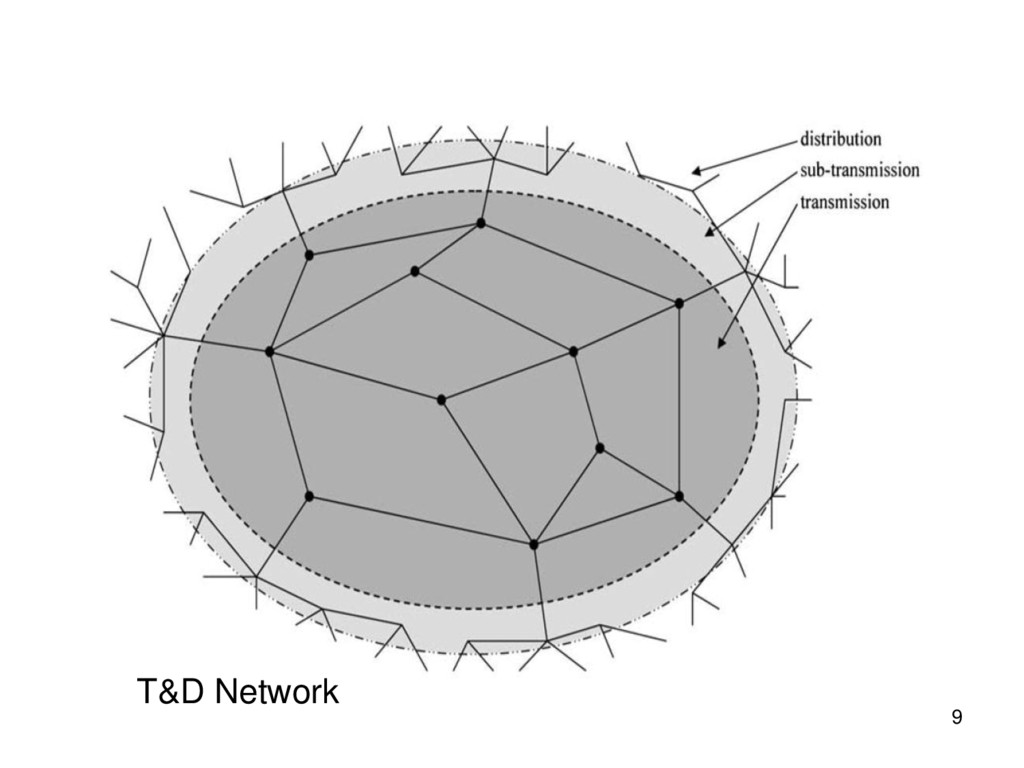
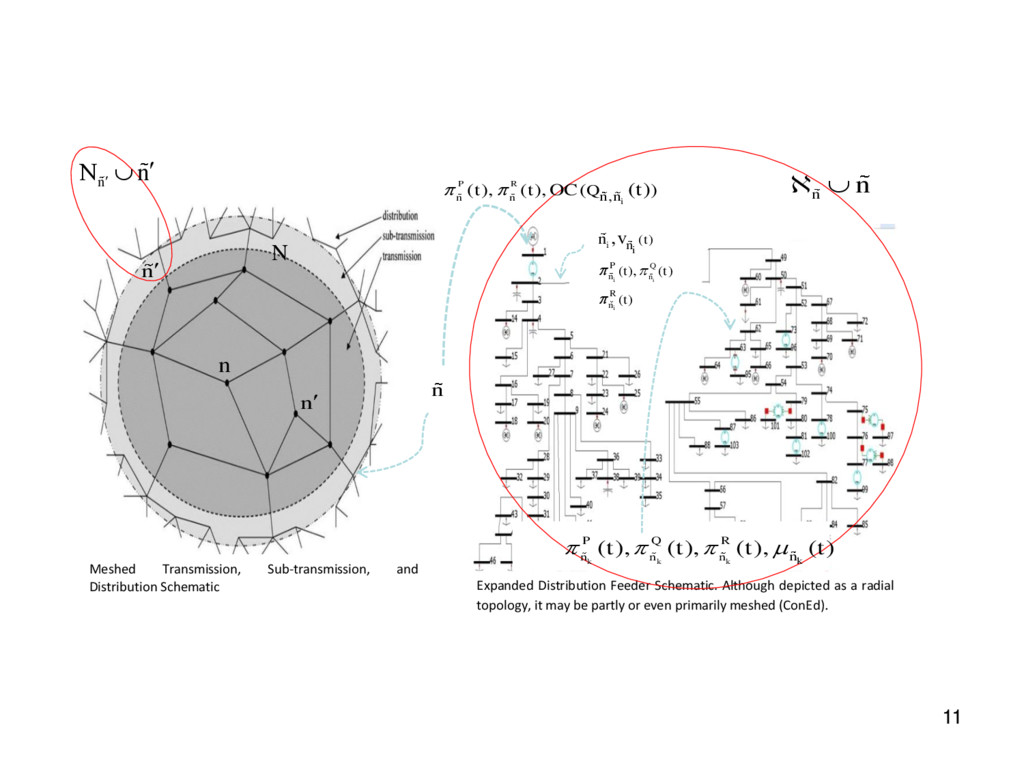
Schematic. Although depicted as a radial topology, it may be partly or even primarily meshed (ConEd). N n n n n n n , ( ), ( ), ( ) ( ) P R i n n n n Q t t OC t n n ( ) ( ( ) ( ) ) , , i i i Q n i P n R n i n t t t t n v ( ), ( ), ( ), ( ) k k k k P Q R n n n n t t t t
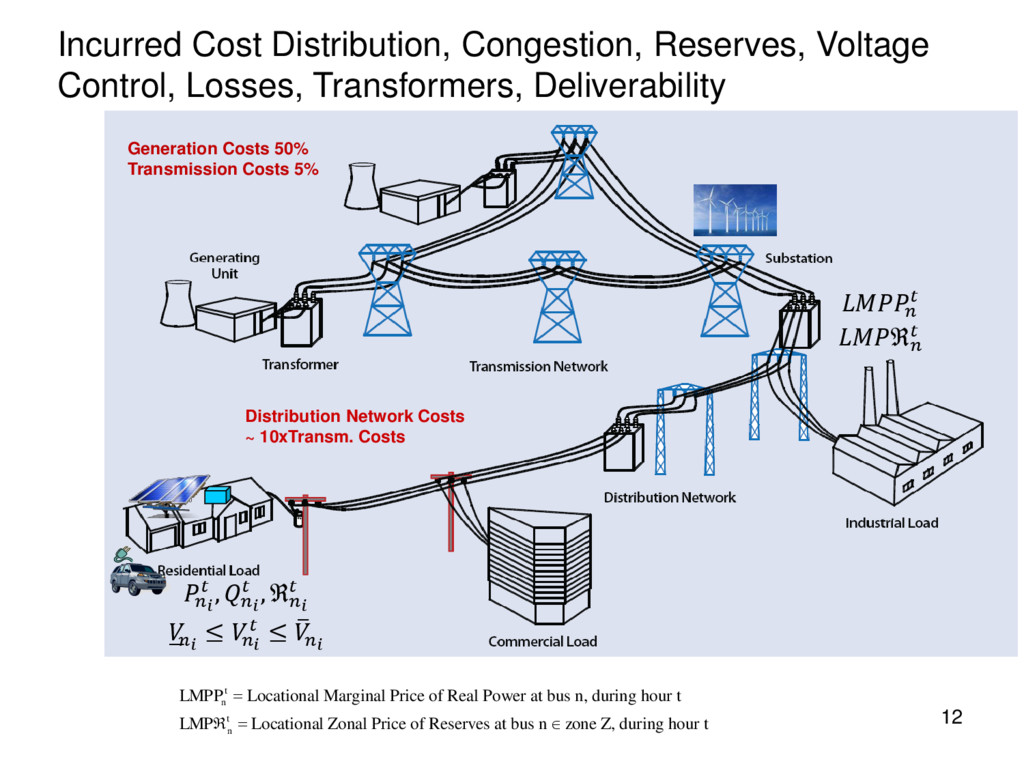
Deliverability Generation Costs 50% Transmission Costs 5% Distribution Network Costs ~ 10xTransm. Costs , , ℜ ഫ ≤ ≤ ത ℜ Locational Marginal Price of Real Power at bus n, during hour t Locational Zonal Price of Reserves at bus n one Z, during hour t t n t n LMPP LMP z
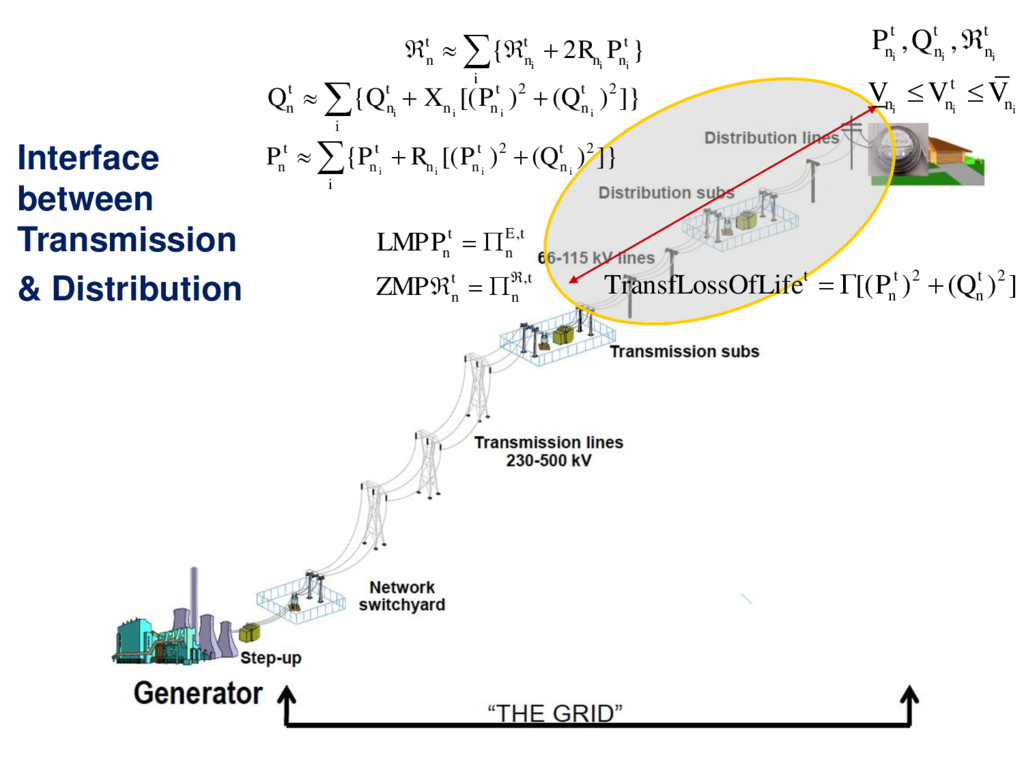
n n LMPP ZMP 2 2 { [( ) (Q ) ]} i i i i t t t t n n n n n i P P R P 2 2 {Q [( ) (Q ) ]} i i i i t t t t n n n n n i Q X P ,Q , i i i i i i t t t n n n t n n n P V V V { 2 } i i i t t t n n n n i R P 2 2 TransfLossOfLife [( ) ( ) ] t t t n n P Q Interface between Transmission & Distribution
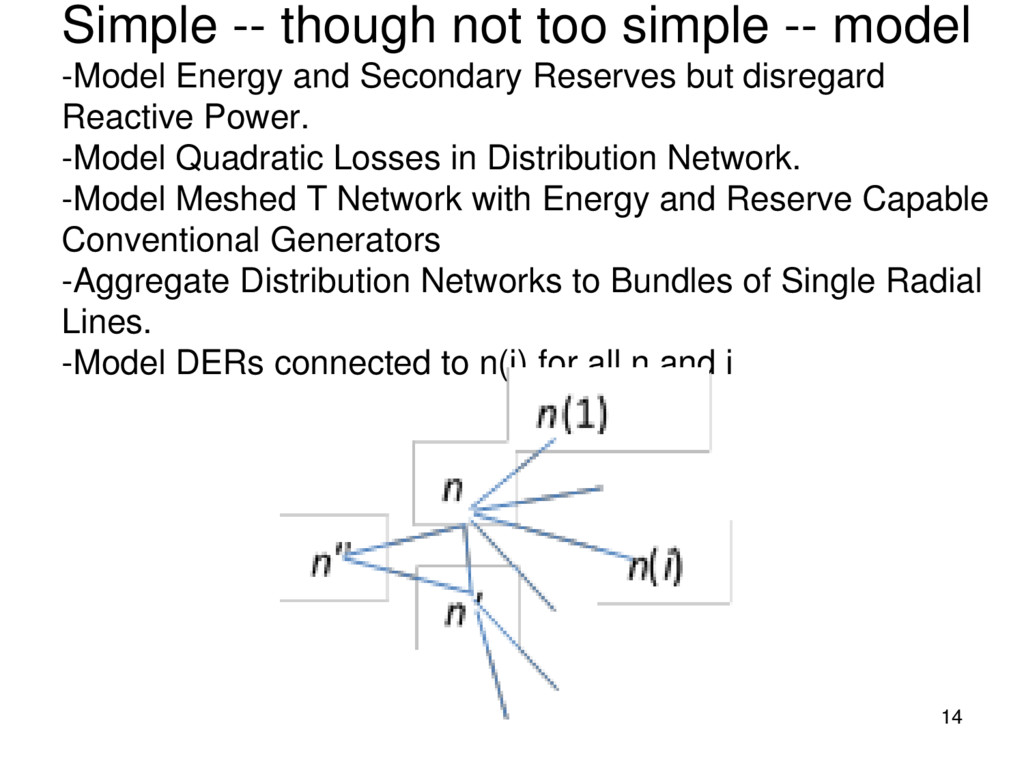
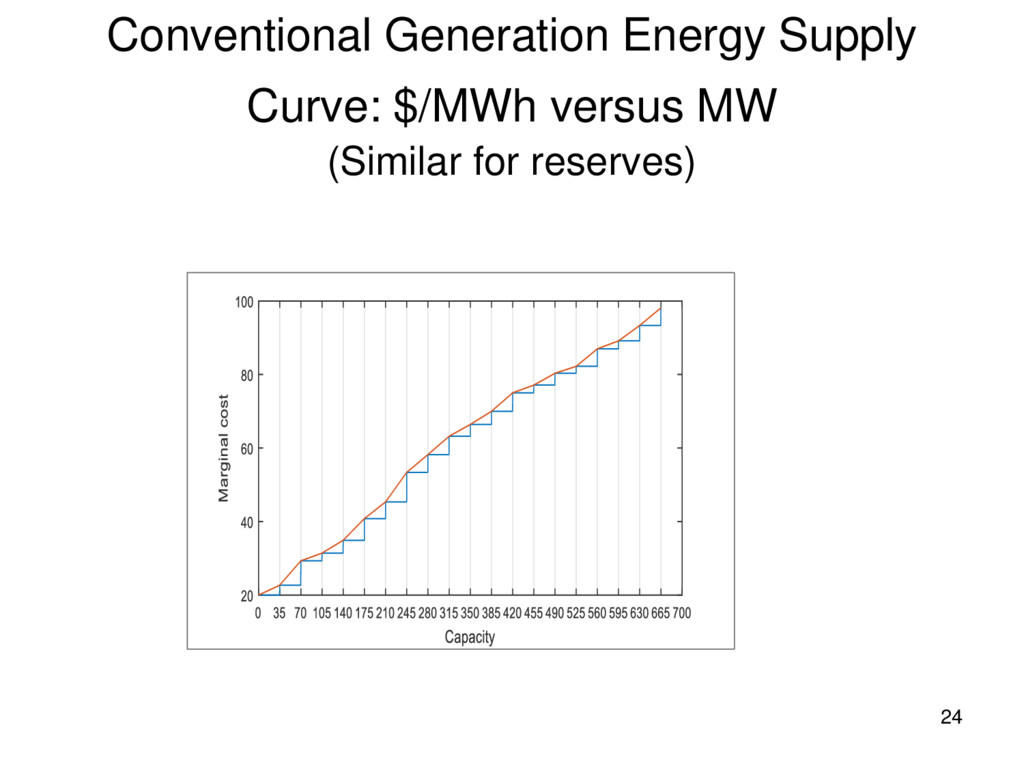
and Secondary Reserves but disregard Reactive Power. -Model Quadratic Losses in Distribution Network. -Model Meshed T Network with Energy and Reserve Capable Conventional Generators -Aggregate Distribution Networks to Bundles of Single Radial Lines. -Model DERs connected to n(i) for all n and i 14
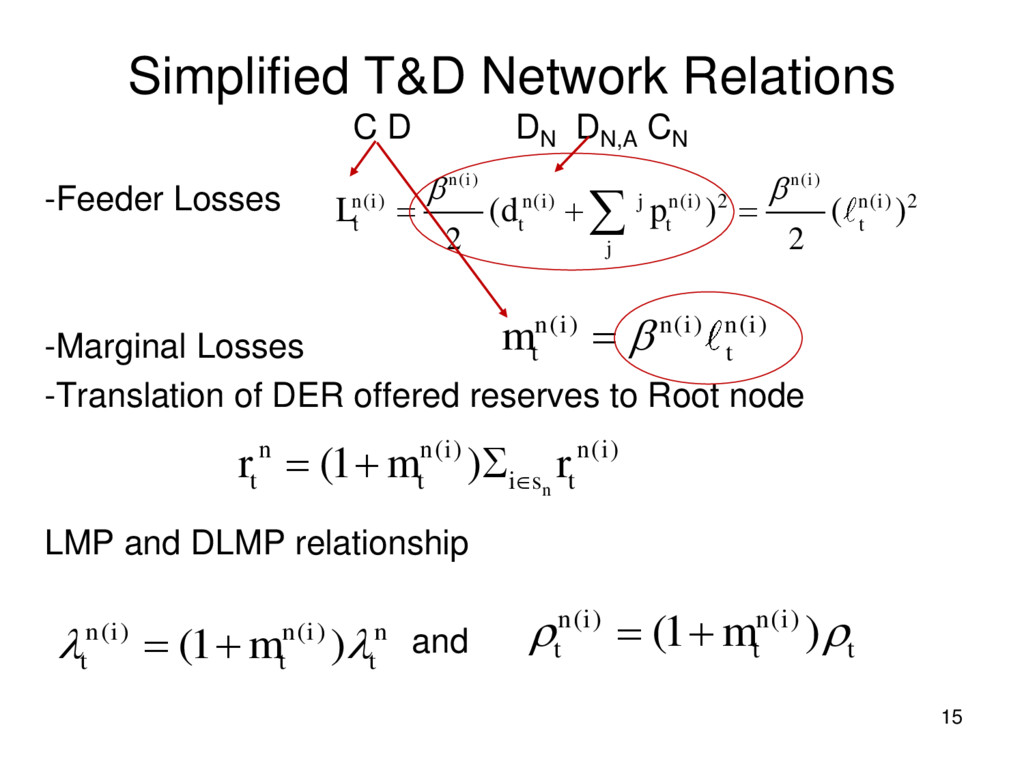
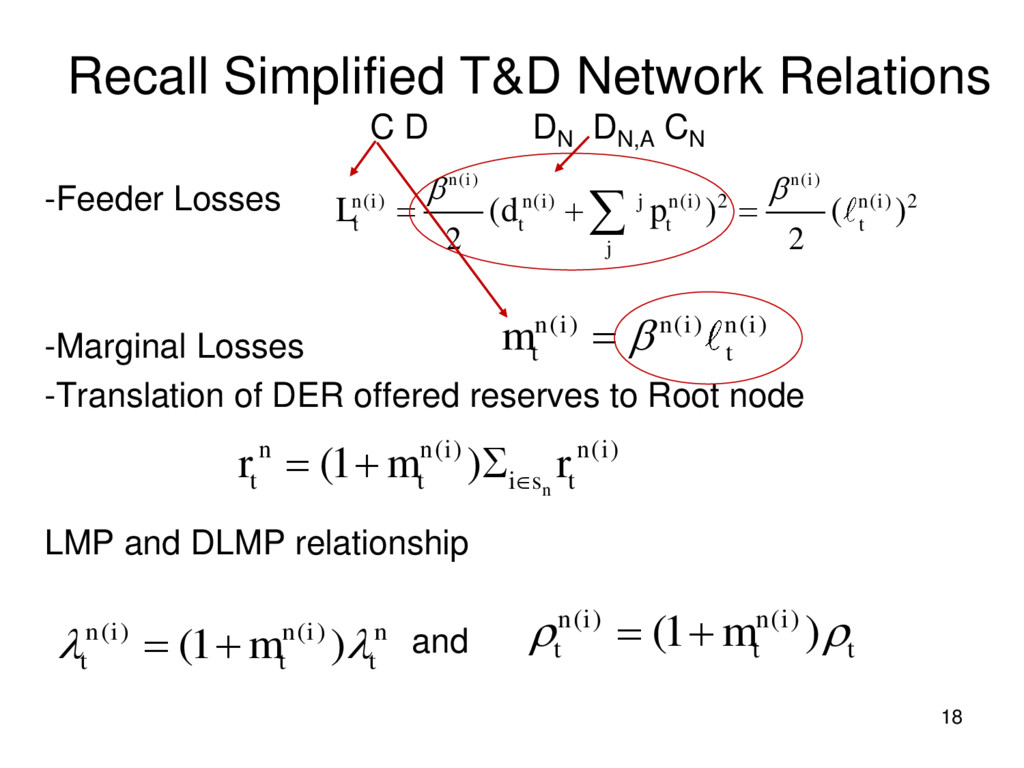
Losses -Marginal Losses -Translation of DER offered reserves to Root node LMP and DLMP relationship and 15 ( ) ( ) ( ) ( ) ( ) 2 ( ) 2 2 2 ( ) ( ) n i n i n i n i j n i n i t t t t j L d p ( ) ( ) ( ) n i n i n i t t m ( ) ( ) (1 ) n n n i n i t t i s t r m r ( ) ( ) (1 ) n i n i n t t t m ( ) ( ) (1 ) n i n i t t t m
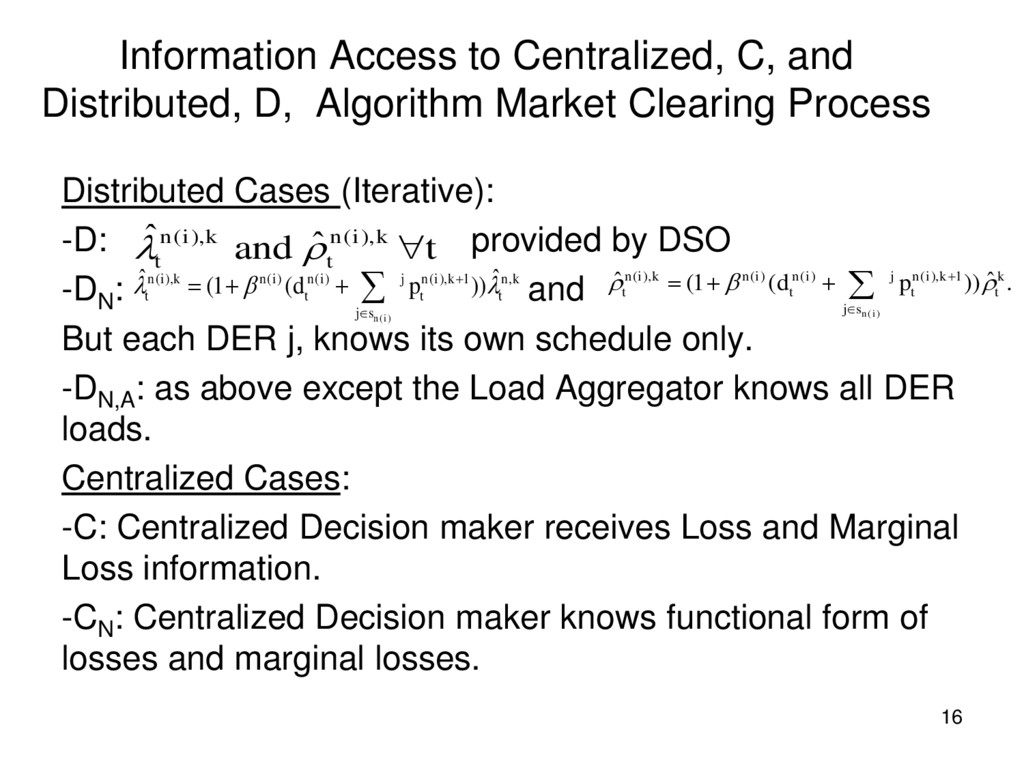
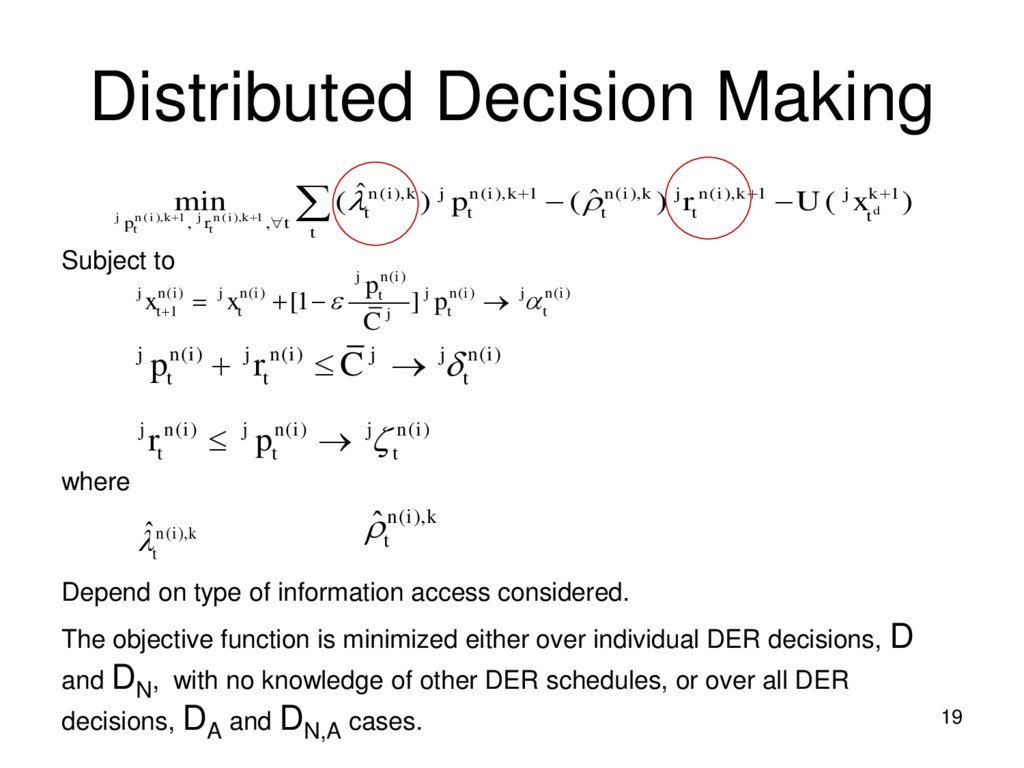
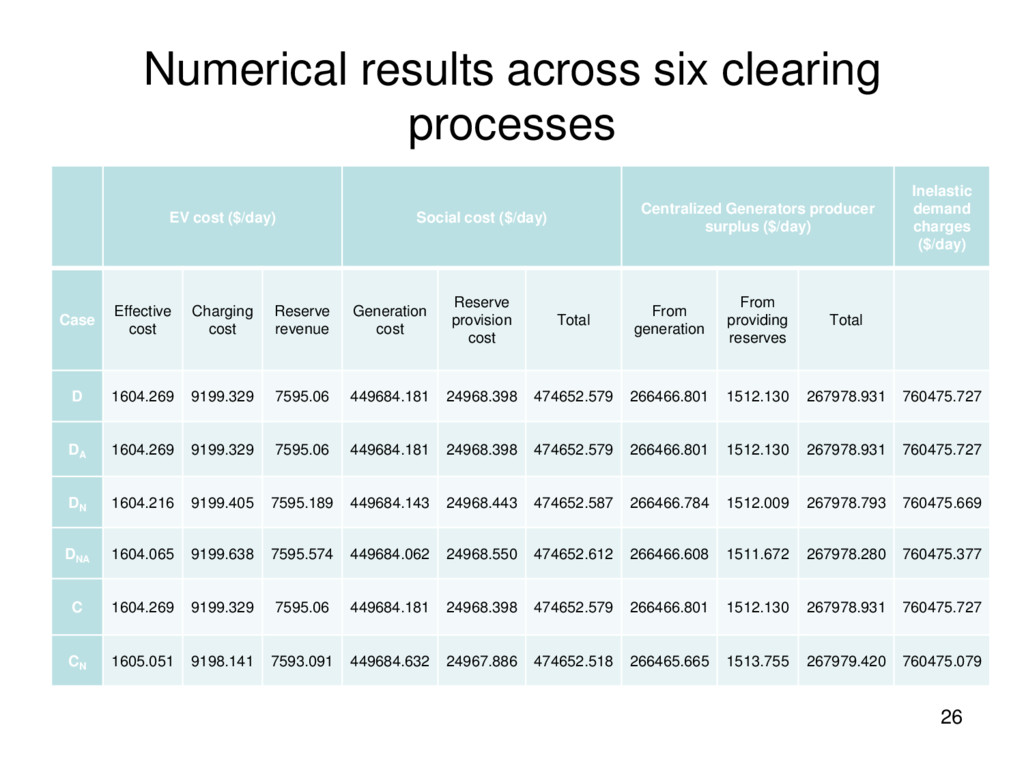
Clearing Process Distributed Cases (Iterative): -D: provided by DSO -DN : and But each DER j, knows its own schedule only. -DN,A : as above except the Load Aggregator knows all DER loads. Centralized Cases: -C: Centralized Decision maker receives Loss and Marginal Loss information. -CN : Centralized Decision maker knows functional form of losses and marginal losses. 16 ( ), ( ), ˆ ˆ and n i k n i k t t t ( ) ( ), ( ) ( ) ( ), 1 , ˆ ˆ (1 ( )) n i n i k n i n i j n i k n k t t t t j s d p ( ) ( ), ( ) ( ) ( ), 1 ˆ ˆ (1 ( )) . n i n i k n i n i j n i k k t t t t j s d p
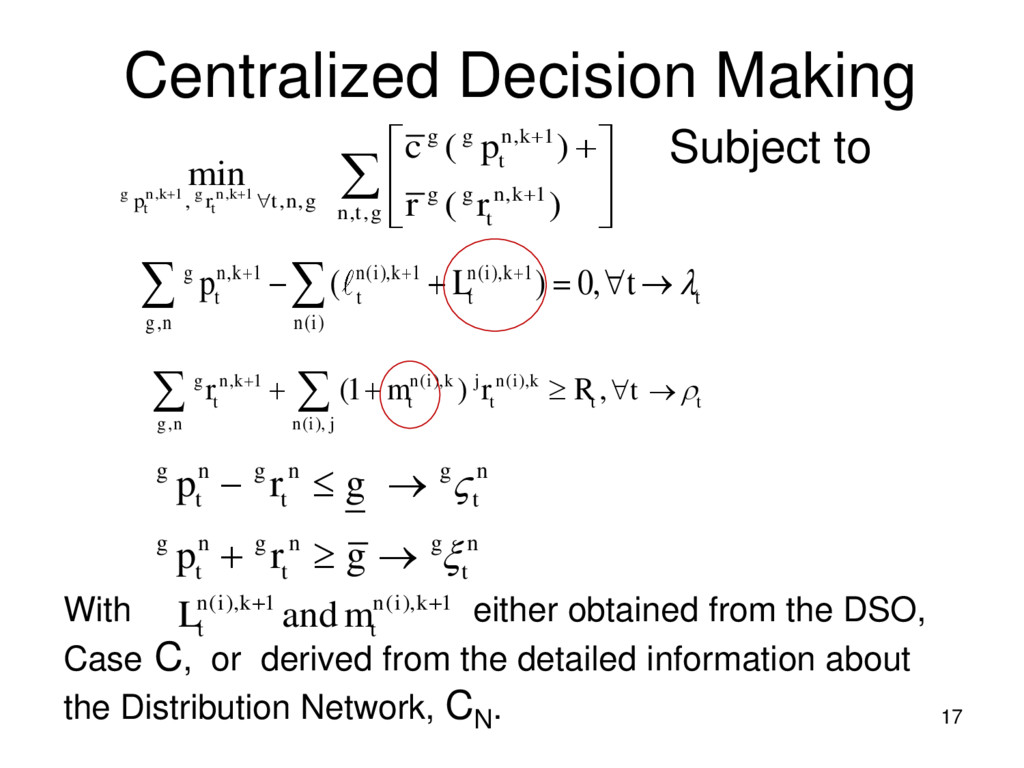
DSO, Case C, or derived from the detailed information about the Distribution Network, CN . 17 , 1 , 1 , 1 , 1 , , , , , ( ) min ( ) g n k g n k t t g g n k t g g n k p r t n g n t g t c p r r , 1 ( ), 1 ( ), 1 , ( ) ( ) 0, g n k n i k n i k t t t t g n n i p L t , 1 ( ), ( ), , ( ), (1 ) , g n k n i k j n i k t t t t t g n n i j t r m r R g n g n g n t t t g n g n g n t t t p r g p r g ( ), 1 ( ), 1 and n i k n i k t t L m
-Feeder Losses -Marginal Losses -Translation of DER offered reserves to Root node LMP and DLMP relationship and 18 ( ) ( ) ( ) ( ) ( ) 2 ( ) 2 2 2 ( ) ( ) n i n i n i n i j n i n i t t t t j L d p ( ) ( ) ( ) n i n i n i t t m ( ) ( ) (1 ) n n n i n i t t i s t r m r ( ) ( ) (1 ) n i n i n t t t m ( ) ( ) (1 ) n i n i t t t m
information access considered. The objective function is minimized either over individual DER decisions, D and DN, with no knowledge of other DER schedules, or over all DER decisions, DA and DN,A cases. 19 ( ), 1 ( ), 1 ( ), ( ), 1 ( ), ( ), 1 1 , , ˆ ˆ min ( ) ( ) ( ) d j n i k j n i k t t n i k j n i k n i k j n i k j k t t t t t p r t t p r U x ( ) ( ) ( ) ( ) ( ) 1 [1 ] j n i j n i j n i j n i j n i t t t t t j p x x p C ( ) ( ) ( ) j n i j n i j j n i t t t p r C ( ) ( ) ( ) j n i j n i j n i t t t r p ( ), ˆn i k t ( ), ˆn i k t
-Feeder Losses -Marginal Losses -Translation of DER offered reserves to Root node LMP and DLMP relationship and 20 ( ) ( ) ( ) ( ) ( ) 2 ( ) 2 2 2 ( ) ( ) n i n i n i n i j n i n i t t t t j L d p ( ) ( ) ( ) n i n i n i t t m ( ) ( ) (1 ) n n n i n i t t i s t r m r ( ) ( ) (1 ) n i n i n t t t m ( ) ( ) (1 ) n i n i t t t m
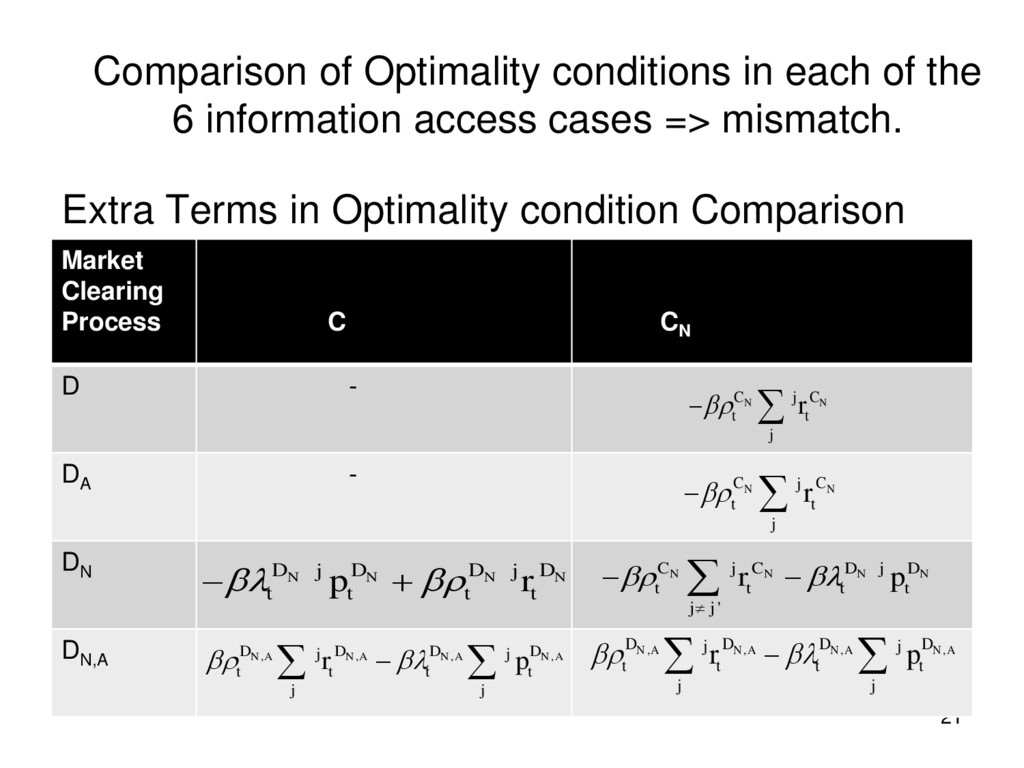
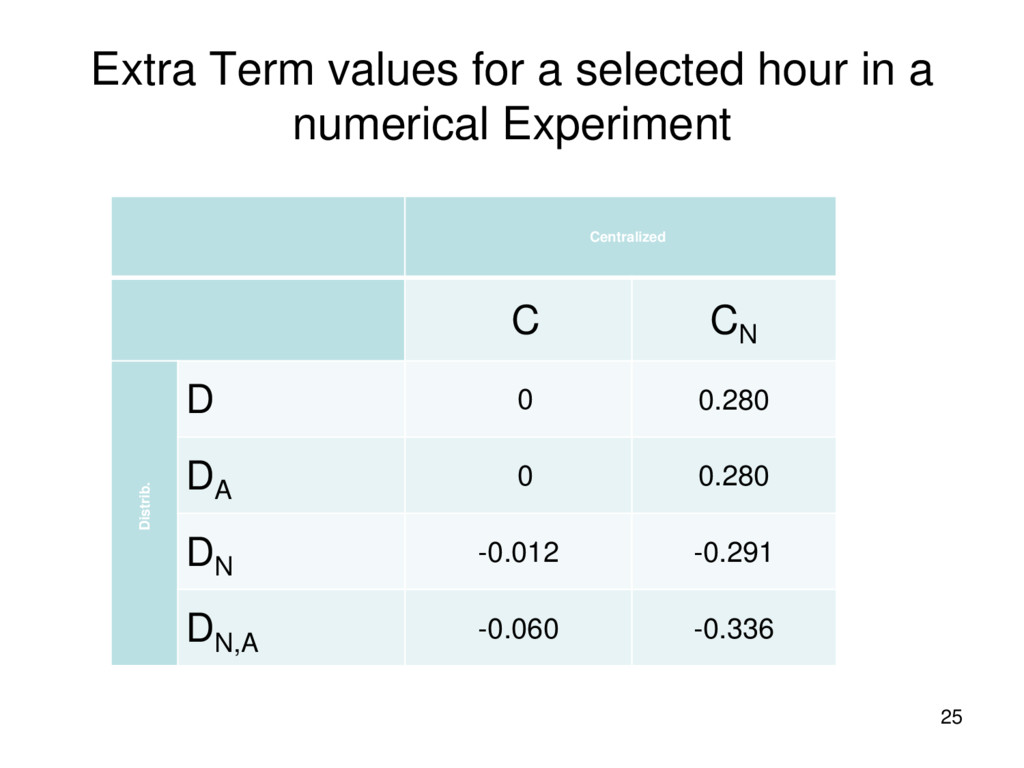
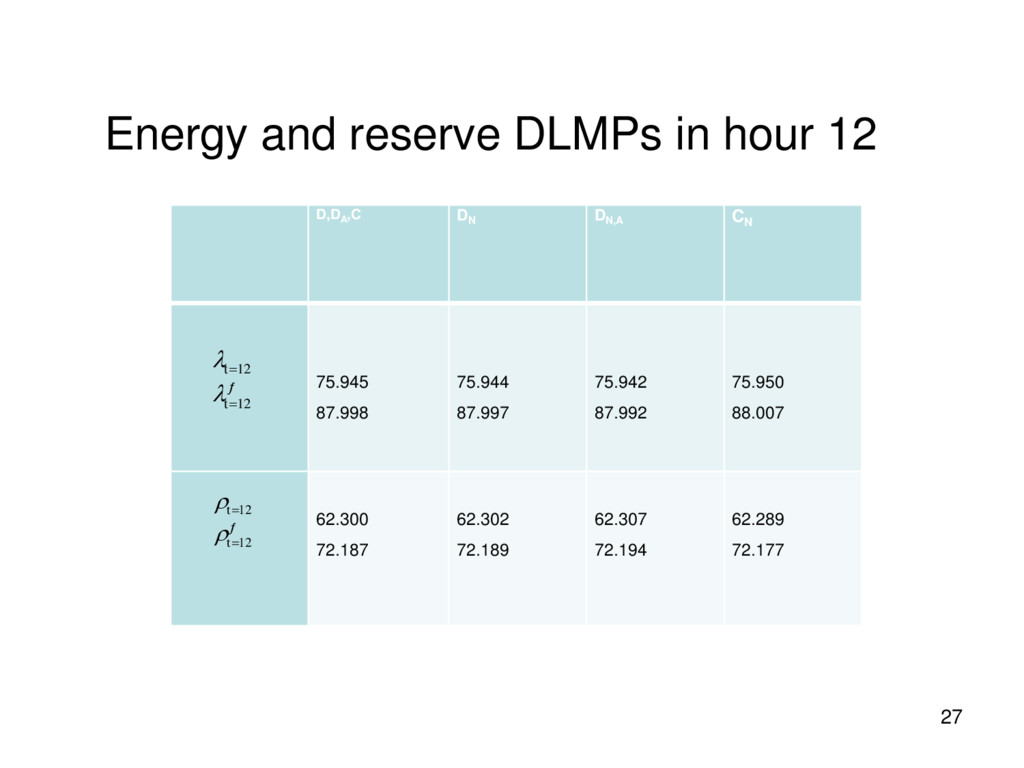
access cases => mismatch. Extra Terms in Optimality condition Comparison 21 Market Clearing Process C CN D - DA - DN DN,A N N N N D D D D j j t t t t p r ' N N N N C C D D j j t t t t j j r p , , , , N A N A N A N A D D D D j j t t t t j j r p , , , , N A N A N A N A D D D D j j t t t t j j r p N N C C j t t j r N N C C j t t j r
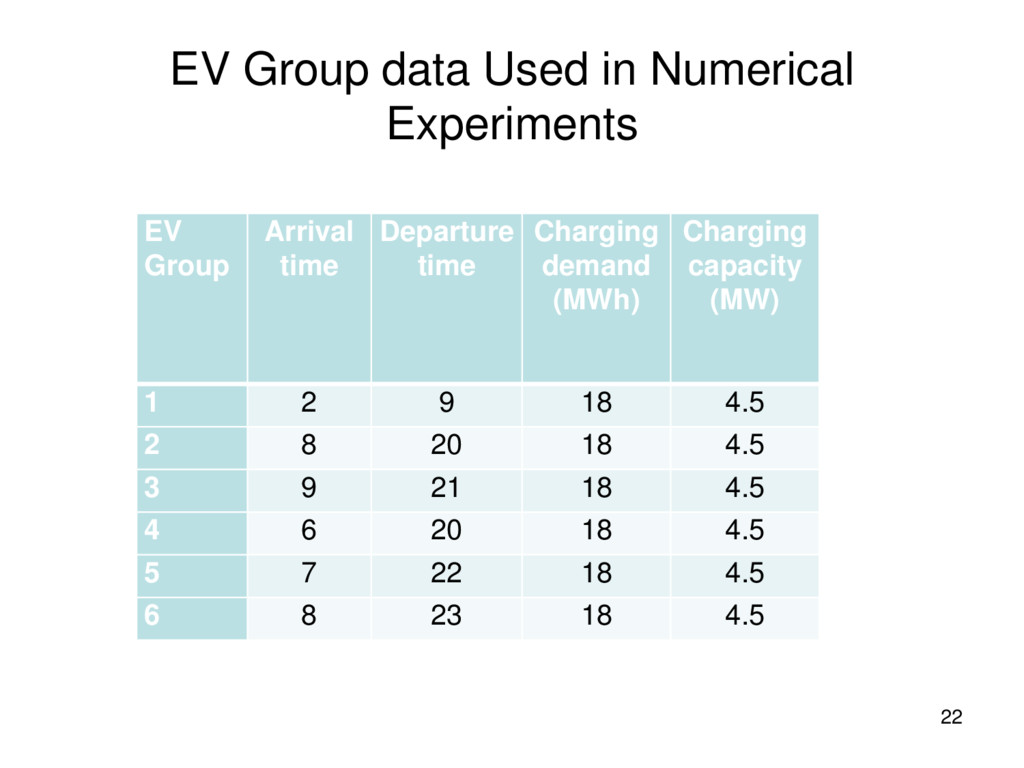
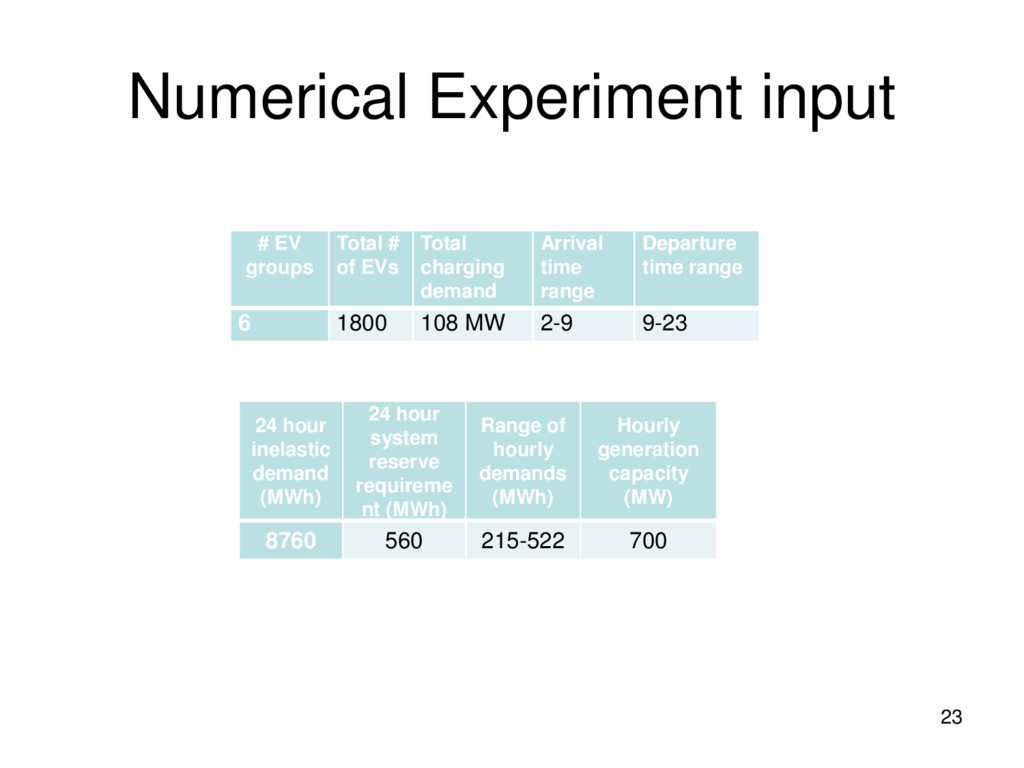
Total charging demand Arrival time range Departure time range 6 1800 108 MW 2-9 9-23 23 24 hour inelastic demand (MWh) 24 hour system reserve requireme nt (MWh) Range of hourly demands (MWh) Hourly generation capacity (MW) 8760 560 215-522 700
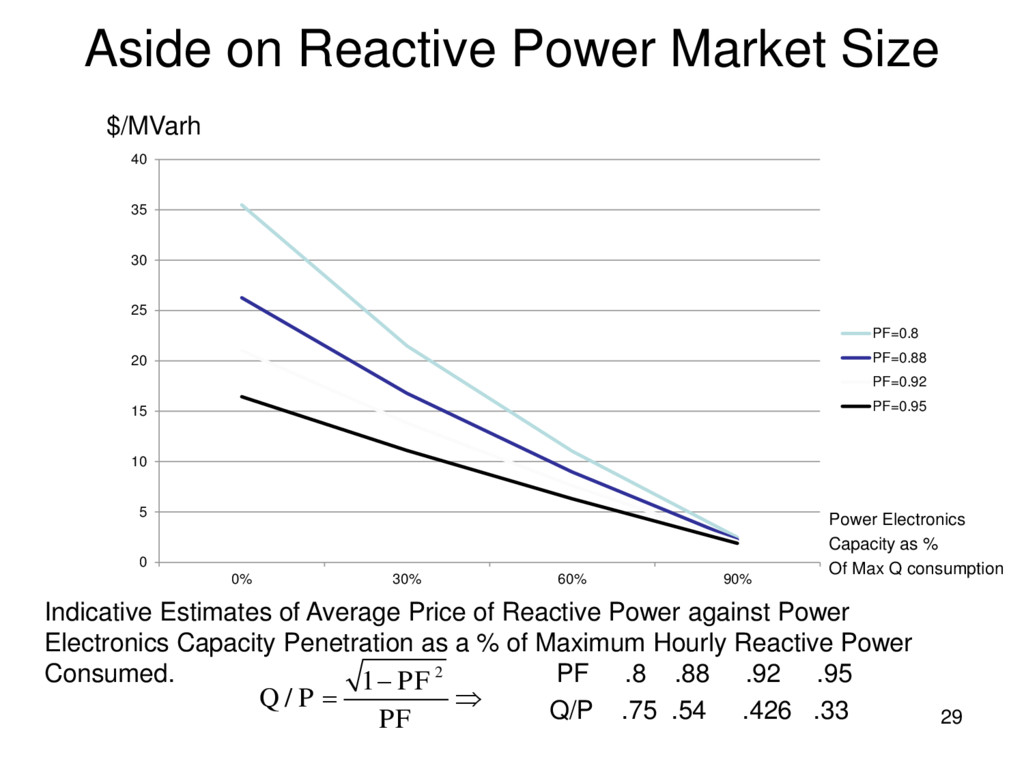
Average Price of Reactive Power against Power Electronics Capacity Penetration as a % of Maximum Hourly Reactive Power Consumed. PF .8 .88 .92 .95 Q/P .75 .54 .426 .33 2 1 / PF Q P PF 0 5 10 15 20 25 30 35 40 0% 30% 60% 90% PF=0.8 PF=0.88 PF=0.92 PF=0.95 $/MVarh Power Electronics Capacity as % Of Max Q consumption
Behavior. • Impact pf aggregators on competitive markets? • BUT What does tractability in terms of both computation and communication constraint tell us? Detailed Distribution Network Information Acces not Practical!!=> OK!! Aggregaors or Not!! • However, Reactive Power capacity withholding Certain under Load Aggregator Facilitated Collusion! 30
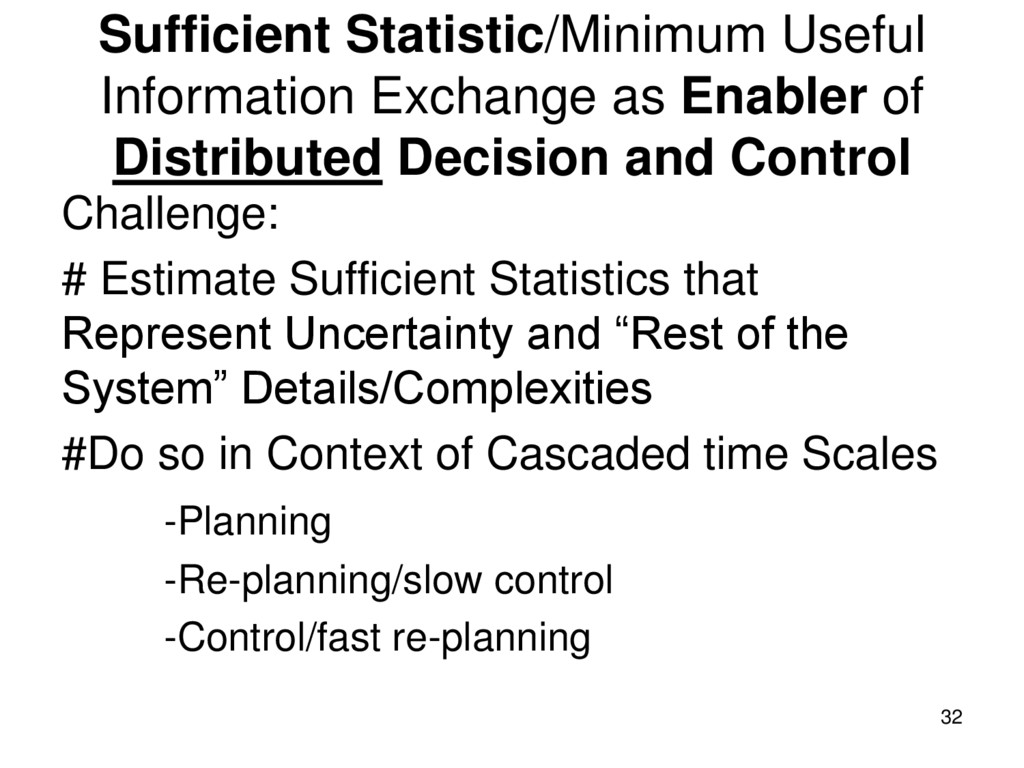
and Control Challenge: # Estimate Sufficient Statistics that Represent Uncertainty and “Rest of the System” Details/Complexities #Do so in Context of Cascaded time Scales -Planning -Re-planning/slow control -Control/fast re-planning 32
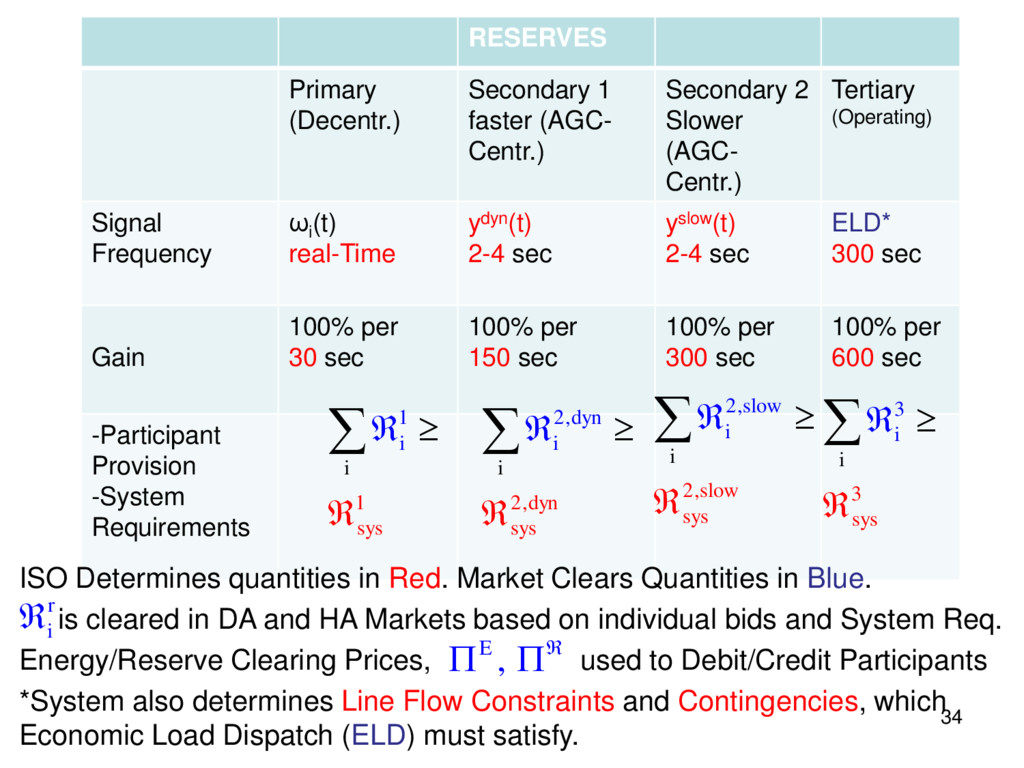
2 Slower (AGC- Centr.) Tertiary (Operating) Signal Frequency ωi (t) real-Time ydyn(t) 2-4 sec yslow(t) 2-4 sec ELD* 300 sec Gain 100% per 30 sec 100% per 150 sec 100% per 300 sec 100% per 600 sec -Participant Provision -System Requirements 1 1 s i i ys 2, 2, i d dy yn n sys i 2,slo 2, w slow i sys i 3 3 s i i ys ISO Determines quantities in Red. Market Clears Quantities in Blue. is cleared in DA and HA Markets based on individual bids and System Req. Energy/Reserve Clearing Prices, used to Debit/Credit Participants *System also determines Line Flow Constraints and Contingencies, which Economic Load Dispatch (ELD) must satisfy. r i , E
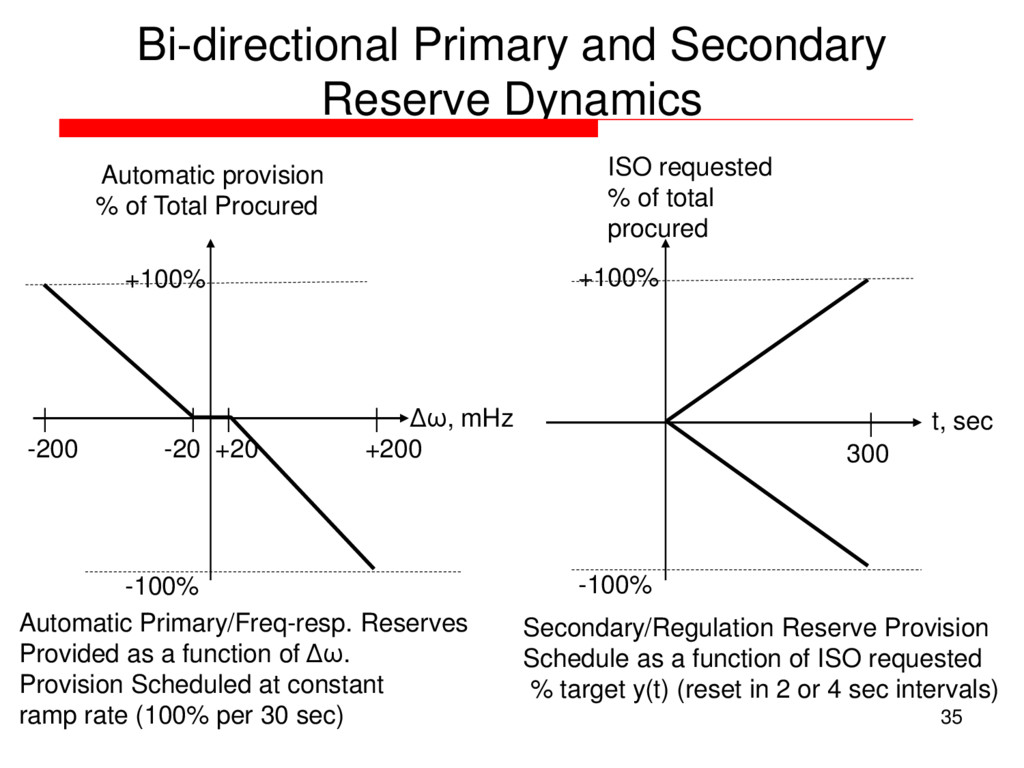
Provided as a function of Δω. Provision Scheduled at constant ramp rate (100% per 30 sec) Secondary/Regulation Reserve Provision Schedule as a function of ISO requested % target y(t) (reset in 2 or 4 sec intervals) Δω, mHz Automatic provision % of Total Procured | | | | -200 -20 +20 +200 +100% -100% t, sec ISO requested % of total procured | 300 +100% -100%
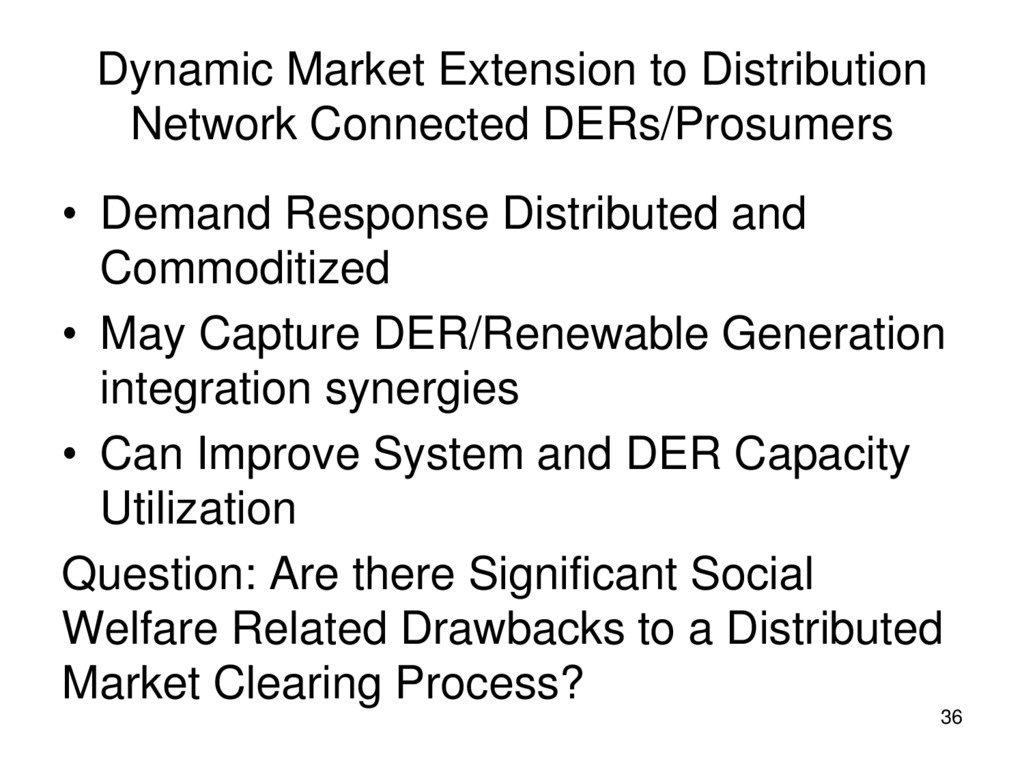
Response Distributed and Commoditized • May Capture DER/Renewable Generation integration synergies • Can Improve System and DER Capacity Utilization Question: Are there Significant Social Welfare Related Drawbacks to a Distributed Market Clearing Process? 36
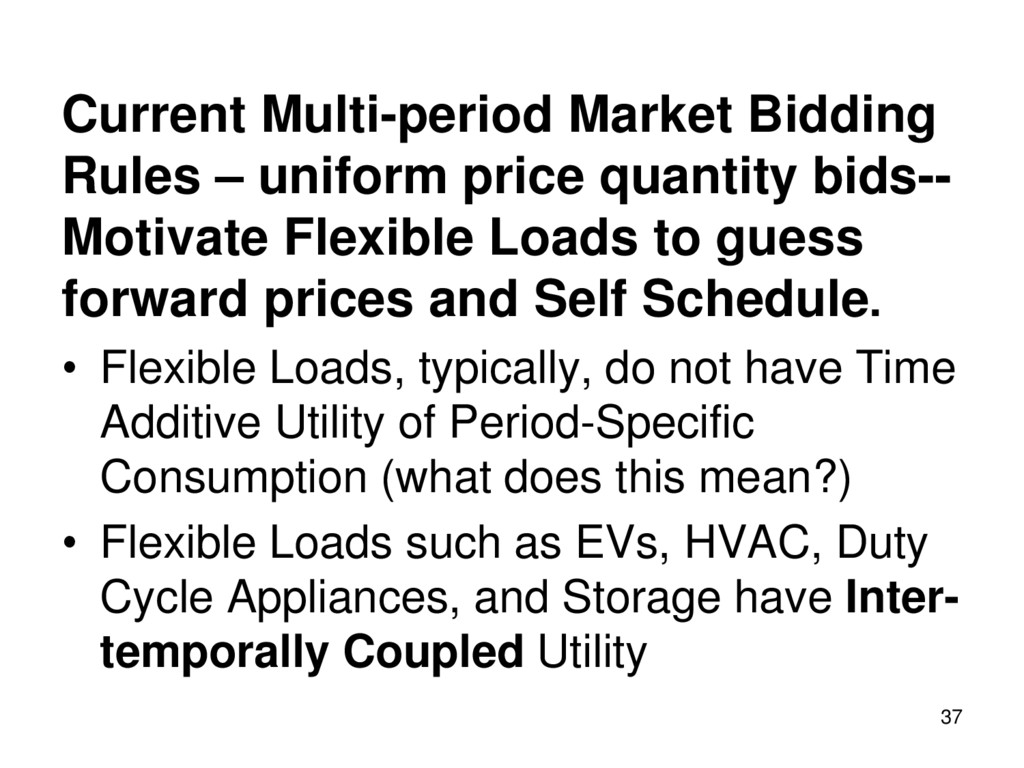
Motivate Flexible Loads to guess forward prices and Self Schedule. • Flexible Loads, typically, do not have Time Additive Utility of Period-Specific Consumption (what does this mean?) • Flexible Loads such as EVs, HVAC, Duty Cycle Appliances, and Storage have Inter- temporally Coupled Utility 37
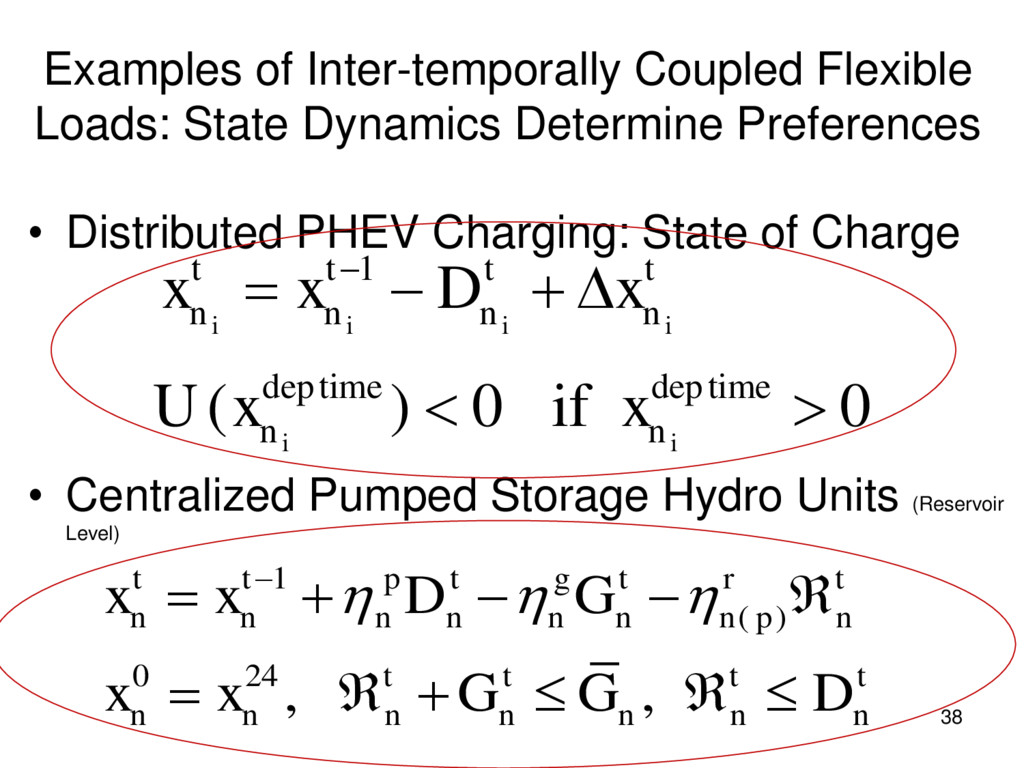
38 • Distributed PHEV Charging: State of Charge • Centralized Pumped Storage Hydro Units (Reservoir Level) 1 deptime deptime ( ) 0 if 0 i i i i i i t t t t n n n n n n x x D x U x x 1 ( 0 24 ) , , t t p n n n n n p t g t r t n n n t t t t n n n n n n n x x D G x x G G D
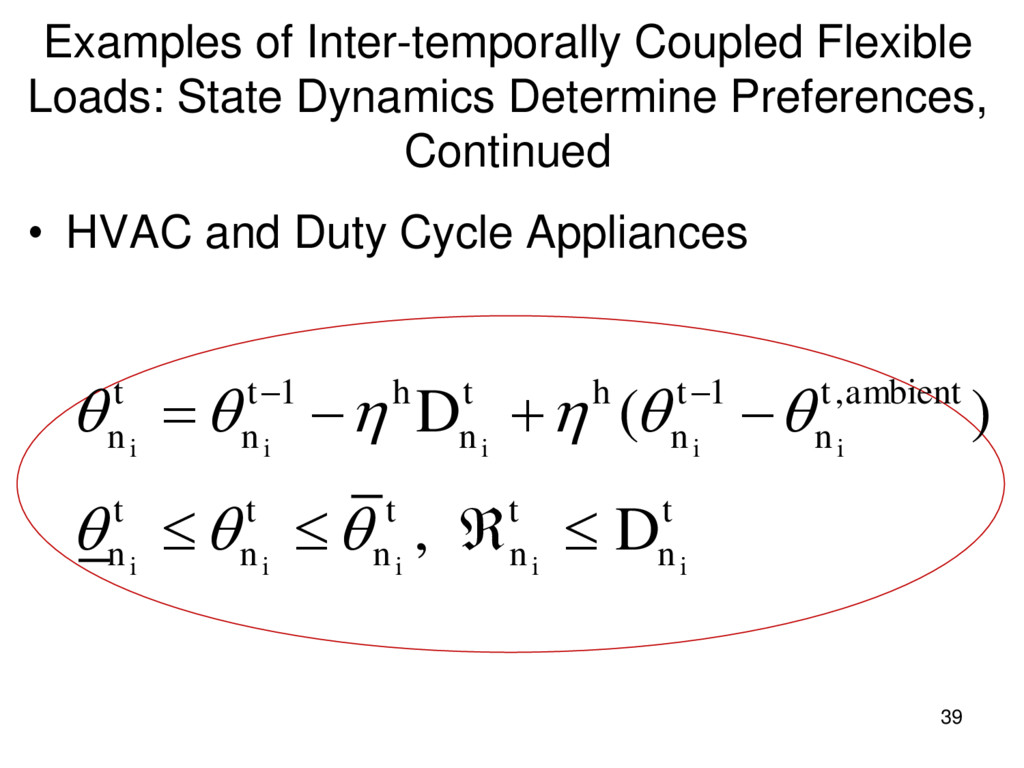
Continued 39 • HVAC and Duty Cycle Appliances 1 1 , ( ) , i i i i i i i i i i t t h t h t t ambient n n n n n t t t t t n n n n n D D
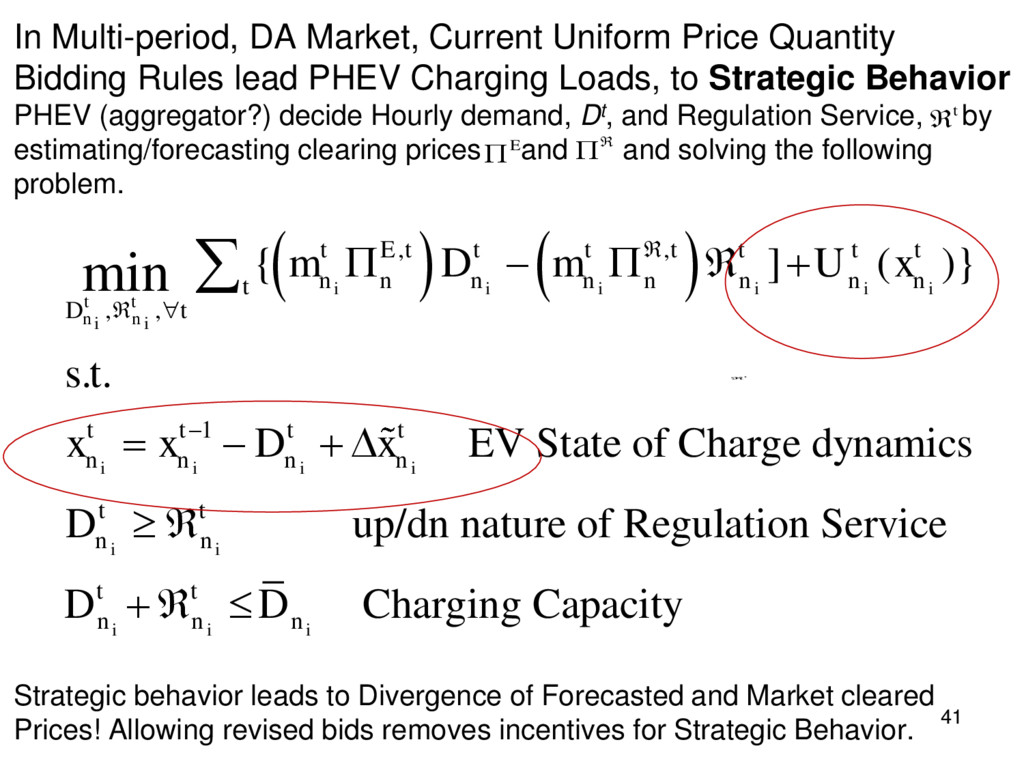
Current Bidding Rules Do Not allow them to Represent their Actual Utility! How? 40 * ( ) * ( ) Bid Energy at a very high price Offer Regulation Service Capacity at low price t n i t n i D R However: ISO Clearing Prices may Differ from Those Assumed in Self Scheduling. Nash Equilibrium Exists to this DGame Under Mild Conditions (Cullaway et al)
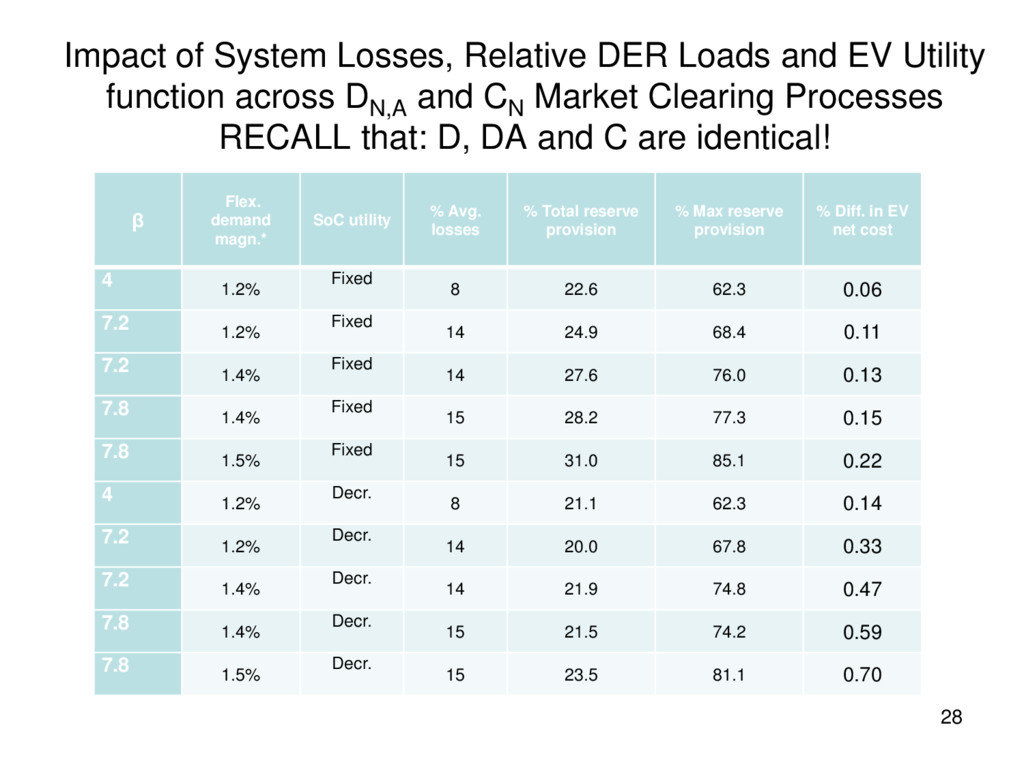
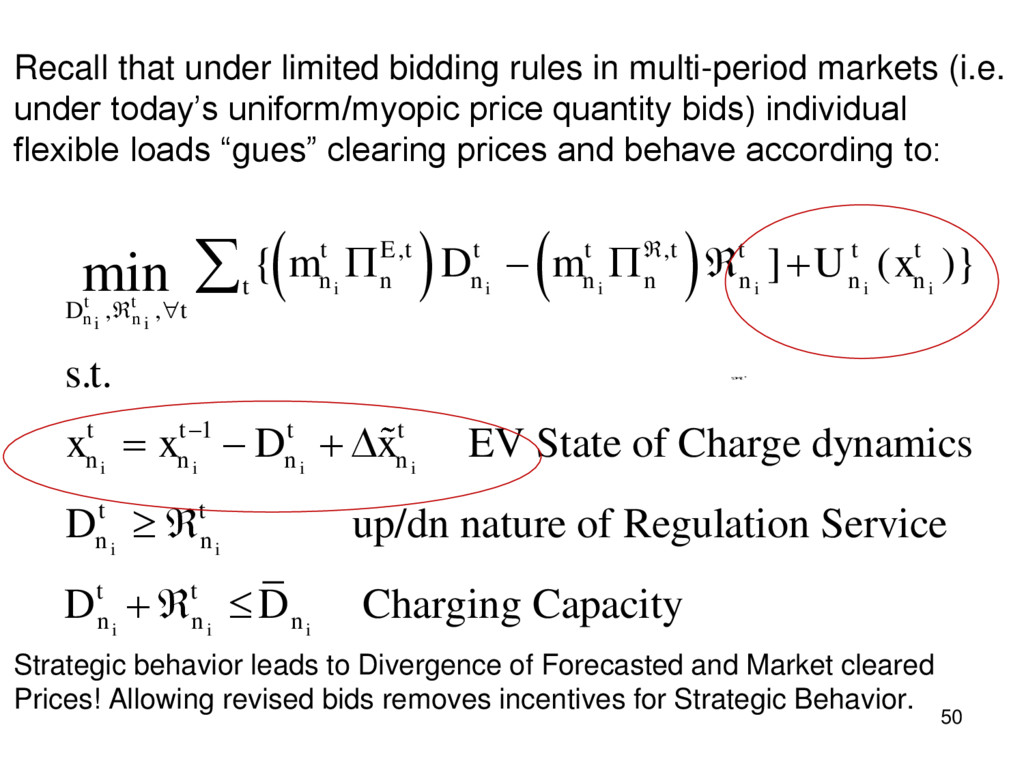
Rules lead PHEV Charging Loads, to Strategic Behavior PHEV (aggregator?) decide Hourly demand, Dt, and Regulation Service, by estimating/forecasting clearing prices and and solving the following problem. Strategic behavior leads to Divergence of Forecasted and Market cleared Prices! Allowing revised bids removes incentives for Strategic Behavior. , , , , 1 { ] ( )} . . EV State of Charge dynamics up/dn nature of Regulation Service D D Charging Capacity min i i i i i i t t n n i i i i i i i i i i i t E t t t t t t t n n n n n n n n t D t t t t t n n n n t t n n t t n n n m D m U x s t x x D x D t t E
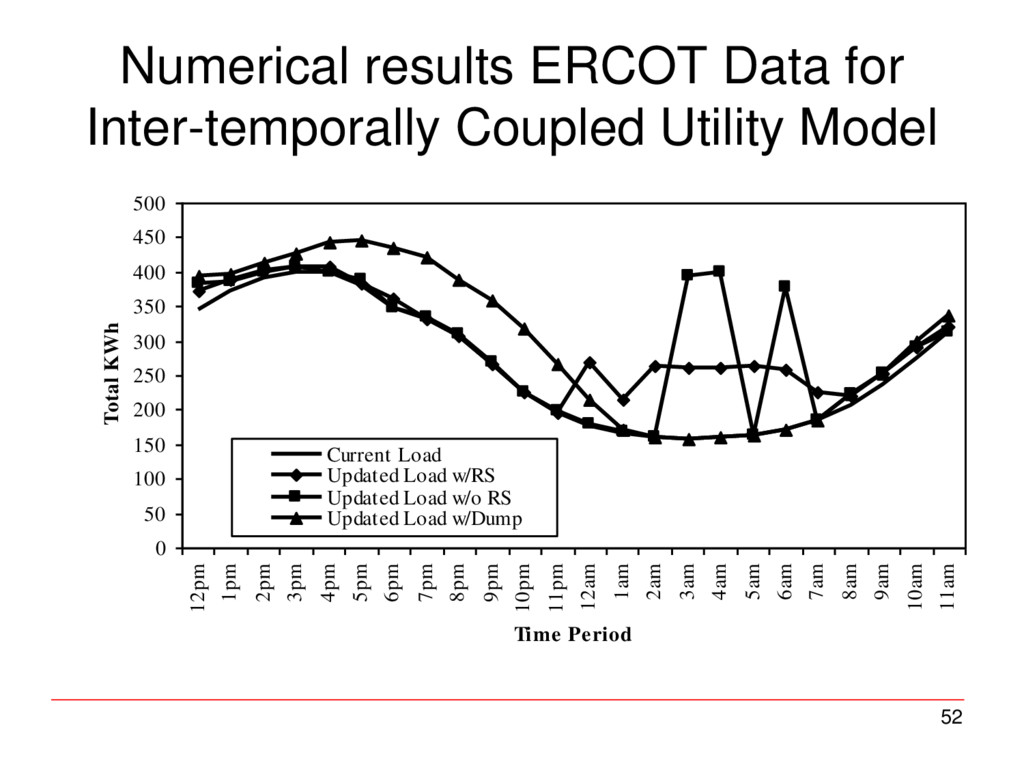
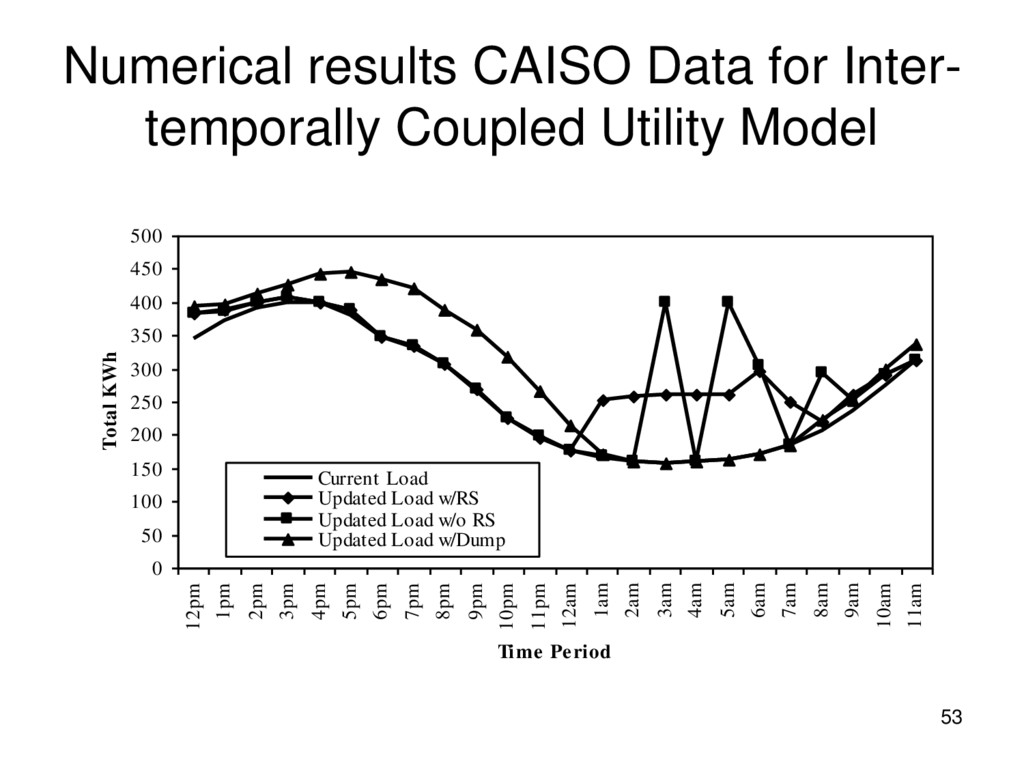
Results indicate Market Clears optimally for both Society and the PHEVs when the Inter-temporal (albeit linear) PHEV preferences are provided to the market maker by enhanced bidding rules • Provision of Reserves results in smoother Effective Load profiles. 42
and Associated Utility, Allow ISO/“DNO” to Clear Market. “Under Competitive Conditions” Market clears with the same schedule as the Nash Equilibrium of the Hierarchical Game. This removes Incentive for Strategic Behavior Consensus/Nash Equilibrium Achievable Through Centralized Market clearing. But is this computationally feasible? Yes under approximate representation of Load Preferences
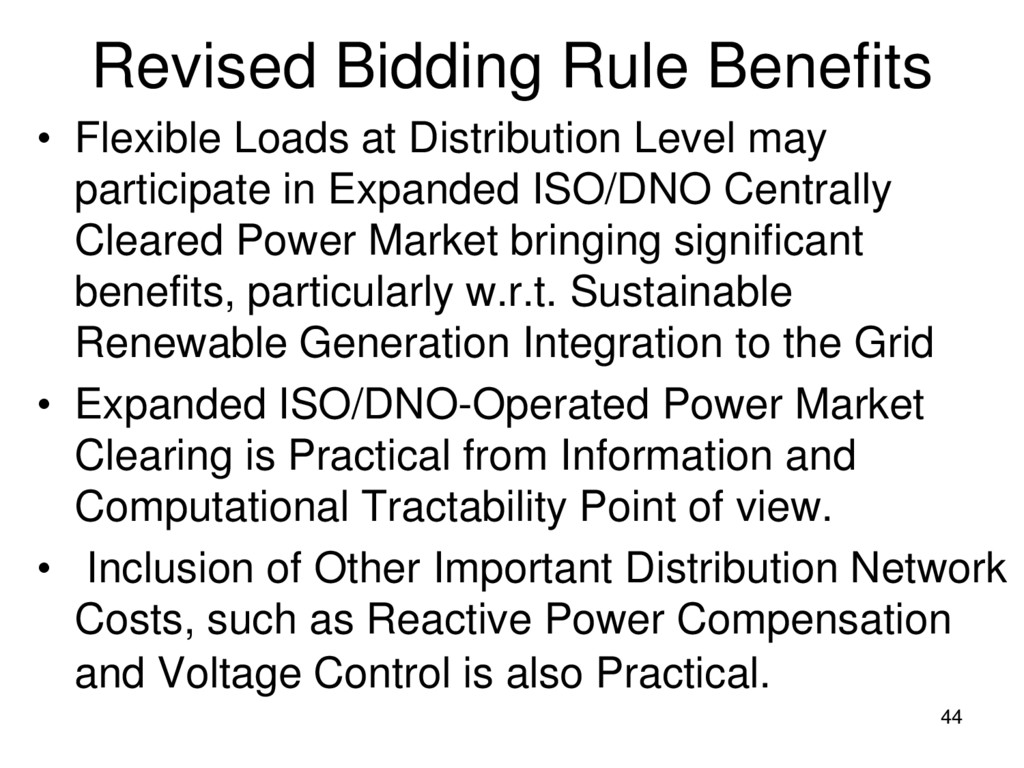
may participate in Expanded ISO/DNO Centrally Cleared Power Market bringing significant benefits, particularly w.r.t. Sustainable Renewable Generation Integration to the Grid • Expanded ISO/DNO-Operated Power Market Clearing is Practical from Information and Computational Tractability Point of view. • Inclusion of Other Important Distribution Network Costs, such as Reactive Power Compensation and Voltage Control is also Practical. 44
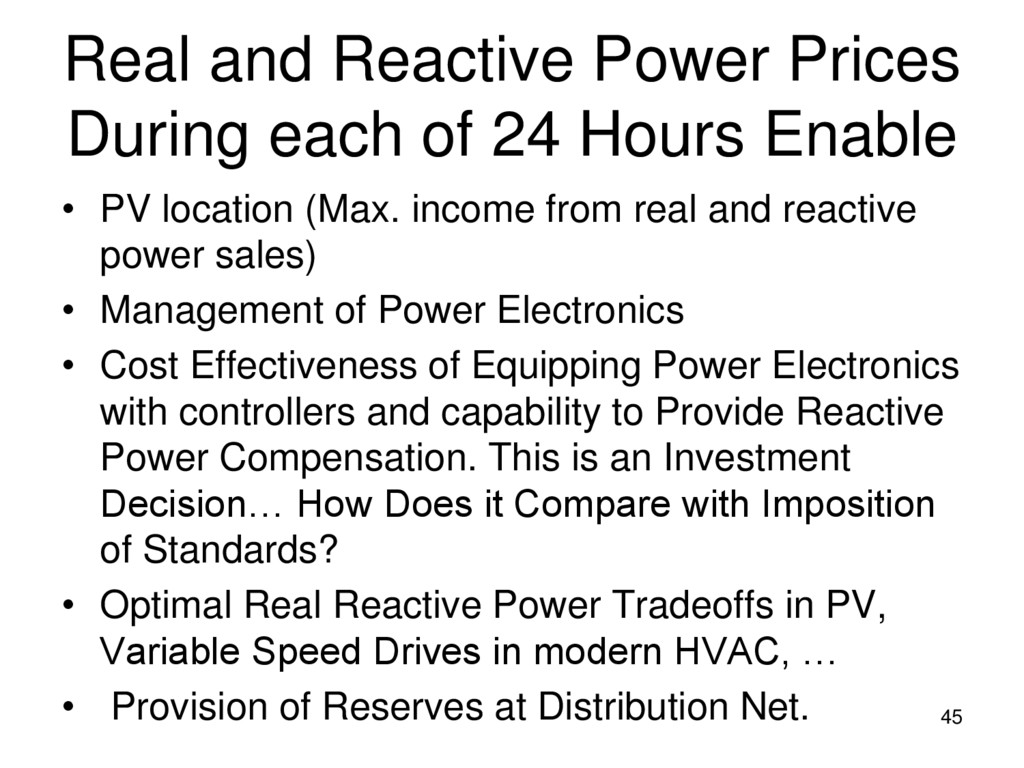
Enable • PV location (Max. income from real and reactive power sales) • Management of Power Electronics • Cost Effectiveness of Equipping Power Electronics with controllers and capability to Provide Reactive Power Compensation. This is an Investment Decision… How Does it Compare with Imposition of Standards? • Optimal Real Reactive Power Tradeoffs in PV, Variable Speed Drives in modern HVAC, … • Provision of Reserves at Distribution Net. 45
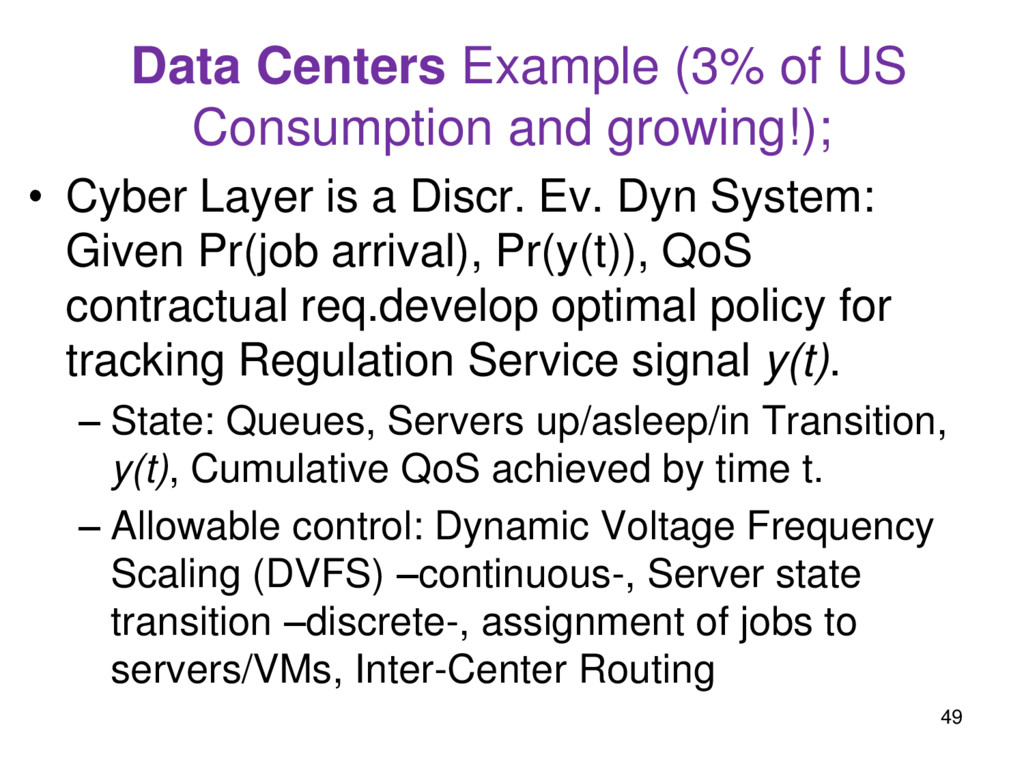
Cyber Layer is a Discr. Ev. Dyn System: Given Pr(job arrival), Pr(y(t)), QoS contractual req.develop optimal policy for tracking Regulation Service signal y(t). – State: Queues, Servers up/asleep/in Transition, y(t), Cumulative QoS achieved by time t. – Allowable control: Dynamic Voltage Frequency Scaling (DVFS) –continuous-, Server state transition –discrete-, assignment of jobs to servers/VMs, Inter-Center Routing 49
(i.e. under today’s uniform/myopic price quantity bids) individual flexible loads “gues” clearing prices and behave according to: Strategic behavior leads to Divergence of Forecasted and Market cleared Prices! Allowing revised bids removes incentives for Strategic Behavior. , , , , 1 { ] ( )} . . EV State of Charge dynamics up/dn nature of Regulation Service D D Charging Capacity min i i i i i i t t n n i i i i i i i i i i i t E t t t t t t t n n n n n n n n t D t t t t t n n n n t t n n t t n n n m D m U x s t x x D x D t
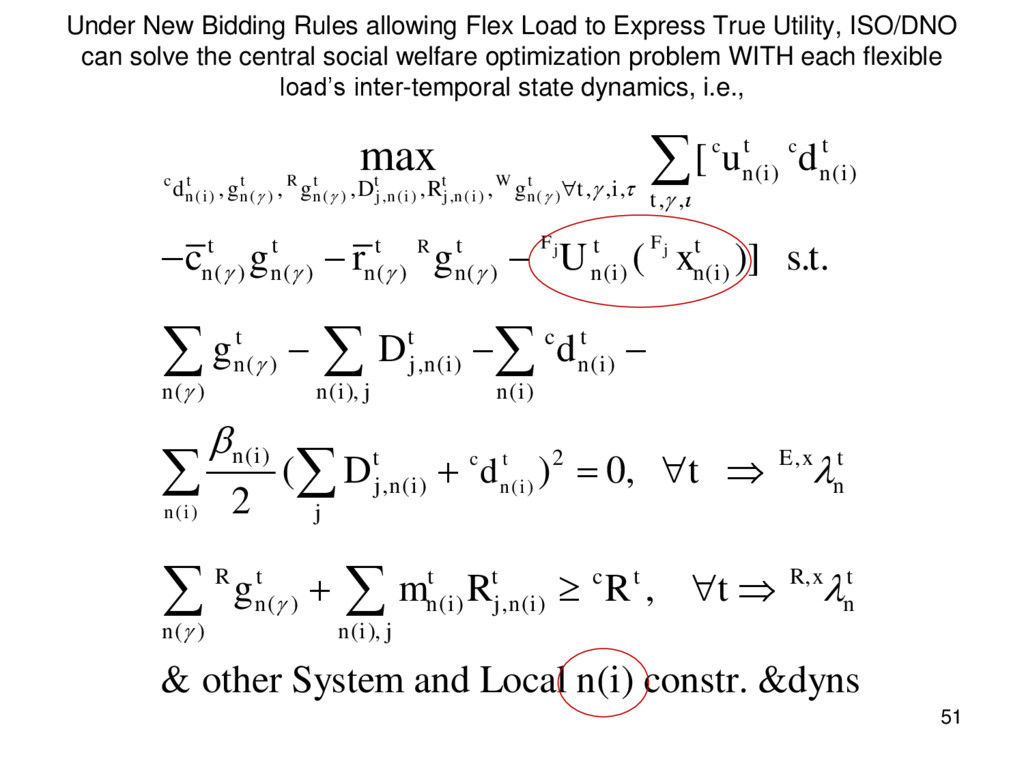
Utility, ISO/DNO can solve the central social welfare optimization problem WITH each flexible load’s inter-temporal state dynamics, i.e., 51 ( ) ( ) ( ) , ( ) , ( ) ( ) ( ) ( ) ( ) , , , , , , , , , , ( ) ( ) ( ) ( ) ( ) ( ) ( ) , ( ) ( ) ( ) ( ), ( ) ( ) 2 , ( ) [ ( )] . . ( ) 2 max c t t R t t t W t n i n n j n i j n i n j j c c F F R c t n i n t t n i n i d g g D R g t i t t t t t t t n n n n n i n i t t c t n j n i n i n n i j n i n i t j n i j d u d c g r g U x s t g D d D ( ) , R, ( ) ( ) , ( ) ( ) ( ), 0, , & other System and Local ( ) constr. &dyns i E x t n R t t t c t x t n n i j n i n n n i j t g m R R t n i
Objective: Environmental + Economic + Energy Reliability Sustainability • Platforms Described In terms of two Poles: – Centralized Utility Control and Standards – Dynamic Price Discovery in Markets • Advantages/Challenges of Market Platform: – Flexible and adaptable to unforeseeable change – Implementation: Tech. Feasibility, Consumer Acceptance, Regulatory Issues (Competitive Markets?) 54
Markets (day ahead, hour-ahead, 5 min and 4 sec for Reserve Management) and Joint Clearance/Optimization of Reserves • Extended Experimentation with Advanced Communication and Metering at Distribution/Retail (LV) Network (AM<10M in US today) • Utilities support Direct Utility Control RATHER THAN MARKETS to guide/coordinate Demand Response. Major Washington Peninsula Experiment by PNNL-IBM-Westinghouse-Utilities-Universities • FERC Pushes with various levels of enthusiasm Parity of Loads and Generation in Existing Wholesale (HV) Markets (including Reactive Power Transactions, FERC order 890). Distribution Markets (?) under State NOT FERC Jurisdiction! • On April 25, 2015, New York PSC leapfrogs the “as of yet most progressive California PSC”. NYPSC announces intention to enable Market-based deployment of Distributed Resources and Load management. Substantive Regulatory Reform Policy Decisions have been announced for December 2014 and March 2015. 55 Evolution of Cyber Smart Grid Use in the US
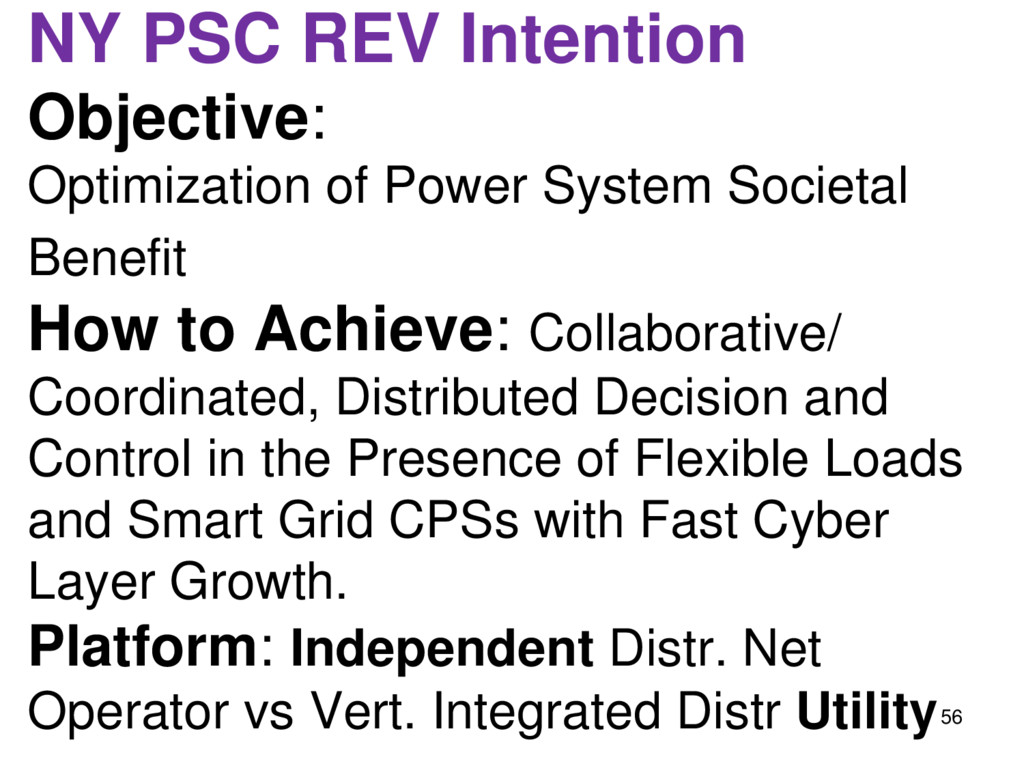
Benefit How to Achieve: Collaborative/ Coordinated, Distributed Decision and Control in the Presence of Flexible Loads and Smart Grid CPSs with Fast Cyber Layer Growth. Platform: Independent Distr. Net Operator vs Vert. Integrated Distr Utility56