Upgrade to Pro — share decks privately, control downloads, hide ads and more …

PMU Streaming Data Dimensionality Reduction and Anomaly Detection

gridx.tamu
November 04, 2016

PMU Streaming Data Dimensionality Reduction and Anomaly Detection

Meng Wu (TAMU), Grid-X Program Presentation on Day 2 (Nov.4) of Workshop on Architecture and Economics of the Future Grid

gridx.tamu

November 04, 2016
Tweet

More Decks by gridx.tamu

Other Decks in Research

Transcript

  1. LOGO PhD Students: Yang Chen (PJM), Meng Wu Faculty Advisors:

    Dr. Le Xie, Dr. P.R. Kumar Texas A&M University Nov. 4, 2016 PMU Streaming Data Dimensionality Reduction and Anomaly Detection
  2. Content Motivation of This Work 1 Part I: PMU Dimensionality

    Reduction 2 Part II: PMU-Based Early Event Detection 3 Part III: Real-Time PMU Bad Data Detection 4 Conclusions 5 2
  3. Motivation of This Work PMU Challenges Our Research Dimensionality reduction

    of PMU measurements. Real-time PMU bad data detection.  High dimensionality: Tennessee Valley Authority (TVA) 120 PMUs produces 36GB data per day.  State-of-the-art: primarily offline, post- event analysis.  High Bad Data Ratio: Typical PMU bad data ratio in California ISO ranges from 10% to 17% (in 2011). Online PMU-based early event detection. • N. Dahal, R. King, and V. Madani, “Online dimension reduction of synchrophasor data,” 2012. • M. Patel, S. Aivaliotis, E. Ellen et al., “Real-time application of synchrophasors for improving reliability,” 2010. • California ISO, “Five year synchrophasor plan,” California ISO, Tech. Rep., Nov 2011. 3
  4. Content Introduction 1 Part I: PMU Dimensionality Reduction 2 Part

    II: PMU-Based Early Event Detection 3 Part III: Real-Time PMU Bad Data Detection 4 Conclusions 5 4
  5. 0 100 200 300 400 500 600 700 800 900

    1000 1100 1.01 1.015 1.02 1.025 1.03 1.035 Voltage Magnitude Profile for ERCOT Data Time (Sec) Voltage Magnitude (p.u.) V 1 V 2 V 3 V 4 V 5 V 6 V 7 Raw PMU Data from Texas Bus Frequency Profile of ERCOT Data. Voltage Magnitude Profile of ERCOT Data. 0 100 200 300 400 500 600 700 800 900 1000 1100 0.995 0.996 0.997 0.998 0.999 1 1.001 Bus Frequency Profile for ERCOT Data Time (Sec) Bus Frequency (p.u.)  1  2  3  4  5  6  7 • 7 PMUs in ERCOT system. • All the frequency/voltage curves have similar behavior. • Indicating low dimensionality nature of high-dimensional data. 5
  6. 6 Dimensionality Reduction - PCA ERCOT 1 2 3 4

    5 6 7 99.7 99.75 99.8 99.85 99.9 99.95 100 Number of PCs Percentage (%) (a) Cumulative Variance for Bus Frequency  in Texas Data 1 2 3 4 5 6 7 30 40 50 60 70 80 90 100 Number of PCs Percentage (%) (b) Cumulative Variance for Voltage Magnitude V m in Texas Data 1 2 3 4 5 6 7 99.7 99.75 99.8 99.85 99.9 99.95 100 Number of PCs Percentage (%) (a) Cumulative Variance for Bus Frequency  in Texas Data 1 2 3 4 5 6 7 30 40 50 60 70 80 90 100 Number of PCs Percentage (%) (b) Cumulative Variance for Voltage Magnitude V m in Texas Data  99.9% of frequency information is preserved by 2 PCs.  70% of voltage information is preserved by 3PCs.  High dimensional PMU raw measurement data lie in an much lower subspace (even with linear PCA). ERCOT System
  7. Content Introduction 1 Part I: PMU Dimensionality Reduction 2 Part

    II: PMU-Based Early Event Detection 3 Part III: Real-Time PMU Bad Data Detection 4 Conclusions 5 7
  8. Scatter Plots of Voltage Magnitude (After PCA) 2D Scatter plot

    for voltage magnitude. 3D Scatter plot for voltage magnitude. Normal Condition Abnormal Condition Back to Normal Condition • PCA: Projecting high-dimensional data into low-dimensional subspace. • Data-driven subspace change  Indicating system physical events. 8
  9. Corporate PDC Data Storage Synchrophasor Data Dimensionality Reduction Data Storage

    Early Event Detection : Phasor measurement unit PDC: Phasor data concentrator : Raw measured PMU data : Preprocessed PMU data Local PDC Local PDC Local PDC Early Event Detection Algorithm [6] Adaptive Training PCA-based Dimensionality Reduction Robust Online Monitoring Online Detection PMU Measurement sfdfffa Covariance Matrix ga Reorder va Eigenvalues Select fa PCs, ggagga Project jfj in m-D Space Define Base Matrix ags Calculate sh Approximate grffs Approximation error gfsgf Event indicator grss Alert to System Operators   0 n N Y t  Y C B Y   i v N m m N    ˆ i y t    i e t    i t  YES 1 t t   NO Y Early Event Detection Algorithm    ? i t    Event Detected! 0 ? t t up T T   NO YES Update Theoretically justified using linear dynamical system theory [6]. • L. Xie, Y. Chen, and P. R. Kumar, “Dimensionality Reduction of Synchrophasor Data for Early Event Detection: Linearized Analysis,” IEEE Tran. Power Systems, 2014. 9
  10. ERCOT Case Study: Unit Tripping Event Frequency Profile. Event Indicator

    Profile. 0 100 200 300 400 500 600 700 800 900 0.995 0.996 0.997 0.998 0.999 1 1.001 Time (sec) Bus Frequency (p.u.) (a)  4 Profile During Unit Tripping Events 104 106 108 110 112 114 0.9965 0.997 0.9975 0.998 0.9985 0.999 0.9995 1 Time (sec) Bus Frequency (p.u.) (b) Zoomed-in  4 Profile During 1st Unit Tripping Event 862 864 866 868 870 0.9975 0.998 0.9985 0.999 0.9995 1 1.0005 Time (sec) Bus Frequency (p.u.) (c) Zoomed-in  4 Profile During 2nd Unit Tripping Event 0 100 200 300 400 500 600 700 800 900 -2 -1 0 1 2 3 x 10⁶ Time (second) Event Indicator  (a)  4 During Unit Tripping Events 103 104 105 106 107 -2 -1 0 1 2 3 4 x 10⁶ Time (second) Event Indicator  (b) Zoomed-in  4 During 1st Unit Tripping Event 862 863 864 865 866 -1 -0.5 0 0.5 1 1.5 2 x 10⁶ Time (second) Event Indicator  (c) Zoomed-in  4 During 2nd Unit Tripping Event Retraining Point Number of PMUs = 7; Number of unit tripping events = 2; Sampling rate = 30 Hz. Event Detected! No significant Frequency Drop. 10
  11. Advantages of The Proposed Algorithm  How EARLY is the

    proposed algorithm? Proposed Method: potentially within a few samples (<0.1 seconds).  Most Oscillation monitoring system (OMS) needs 10 sec to detect the oscillation.  No system topology, no system model. 11
  12. Content Introduction 1 Part I: PMU Dimensionality Reduction 2 Part

    II: PMU-Based Early Event Detection 3 Part III: Real-Time PMU Bad Data Detection 4 Conclusions 5 12
  13. Current Work for PMU Bad Data Detection  PMU-based state

    estimator [2].  Kalman-filter-based approach [3].  Require system parameter and topology information.  Require converged state estimation results.  Low-rank matrix factorization for PMU bad data detection [4].  Pre-defined logics & thresholds for bad data detection [1].  Matrix factorization involves high computational burden.  Robustness of pre-defined logics under eventful conditions. 13
  14. Overview of Proposed Work Online PMU Bad Data Detection Algorithm

    Problem Formulation  Study spatio-temporal correlations among good / eventful / bad PMU data.  Formulate bad PMU data as spatio-temporal outliers among other data.  Apply density-based outlier detection technique to detect bad PMU data. 14
  15. Good Data vs Eventful Data vs Bad Data Phase Angle

    Measured by A Western System PMU for A Recent Brake Test Event Event Bad Data Bad Data Weak Temporal Correlation Bad Data Bad Data Weak Temporal Correlation Weak Temporal Correlation Weak Temporal Correlation Weak Temporal Correlation 15
  16. Good Data vs Eventful Data vs Bad Data Event Bad

    Data Bad Data Bad Data Bad Data Weak Spatial Correlation Weak Spatial Correlation Weak Spatial Correlation Weak Spatial Correlation Strong Spatial Correlation 16
  17. Features of Good / Eventful / Bad Data Criteria: Good

    Data VS Eventful Data VS Bad Data  Good Data: strong spatio-temporal correlations with its neighbors.  Eventful Data: weak temporal but strong spatial correlations with its neigbors.  Bad Data: weak spatio-temporal correlations with its neighbors. PMU Bad Data: Spatio-Temporal Outlier 17
  18. Online Detection of Bad PMU Data [7] Spatio-Temporal Correlation Metrics

    (Distance Function)  For high-variance bad data:  For low-variance bad data: Density-Based Local Outlier Detection  Local Outlier Factor:  Local Reachability Density:  Bad Data Detection:  LOF(p) >> 1: p contains bad data.  LOF(p) ≈ 1: p contains good data only.  Low-variance bad data: un-updated data, etc.  High-variance bad data: data spikes, data loss, high noise, false data injections, etc. 18 • M. Wu and L. Xie, “Online identification of bad synchrophasor measurements via spatio-temporal correlations,” 19th Power Systems Computation Conference, Genoa, Italy, 2016.
  19. Numerical Results – Data Spikes Test Case Description • 22

    real-world PMU real power data curves. • PMU No. 10, 13, 16, 21 contain data spikes lasting from 1.05s to 1.1s. • Line tripping fault is presented around 4s. Numerical Results Description • All the 4 bad data segments are detected. • System event does not cause false alarms. • Detection delay is less than 0.18s. • Computation time for each data window is 0.0197s. 19
  20. Numerical Results – Un-updated Data Test Case Description • 13

    real-world PMU current magnitude data curves. • PMU No. 1, 5, 7, 13 contain un-updated data lasting from 1s to 1.2s. • Line tripping fault is presented around 4s. Numerical Results Description • All the 4 bad data segments are detected. • System event does not cause false alarms. • Detection delay is less than 0.18s. • Computation time for each data window is 0.0115s. 1 2 3 4 5 6 7 8 9 10 11 12 13 0 1 2 3 4 5 x 10⁴ Index of Synchrophasor Channels LOF Values (pu) LOF Values of Synchrophasor Channels When Un-updated Data Is Presented LOF Threshold 1 2 3 4 5 6 7 8 9 10 11 12 13 0 50 100 Index of Synchrophasor Channels LOF Values (pu) LOF Values of Synchrophasor Channels When Physical Event Is Presented 1 2 3 4 5 6 7 8 9 10 11 12 13 0 1 2 3 4 5 x 10⁴ Index of Synchrophasor Channels LOF Values (pu) LOF Values of Synchrophasor Channels When Un-updated Data Is Presented LOF Threshold LOF Threshold 0 1 2 3 4 5 6 7 8 1.01 1.02 1.03 1.04 1.05 x 10⁴ Time (s) Current Magnitude (A) Synchrophasor Measurements with Un-updated Data Synchrophasor Channel No. 1 Synchrophasor Channel No. 5 Synchrophasor Channel No. 7 Synchrophasor Channel No. 13 Un-updated Data 20
  21. Content Introduction 1 Part I: PMU Dimensionality Reduction 2 Part

    II: PMU-Based Early Event Detection 3 Part III: Real-Time PMU Bad Data Detection 4 Conclusions 5 21
  22. Conclusions PMU Challenges  High dimensionality: Tennessee Valley Authority (TVA)

    120 PMUs produces 36GB data per day.  State-of-the-art: primarily offline, post- event analysis.  High Bad Data Ratio: Typical PMU bad data ratio in California ISO ranges from 10% to 17% (in 2011). Our Research Dimensionality reduction of PMU measurements. Real-time data-driven PMU bad data detection. Online data-driven PMU- based early event detection. • N. Dahal, R. King, and V. Madani, “Online dimension reduction of synchrophasor data,” 2012. • M. Patel, S. Aivaliotis, E. Ellen et al., “Real-time application of synchrophasors for improving reliability,” 2010. • California ISO, “Five year synchrophasor plan,” California ISO, Tech. Rep., Nov 2011. 22
  23. References  [1] K. Martin, “Synchrophasor data diagnostics: detection &

    resolution of data problems for operations and analysis”, in Electric Power Group Webinar Series, Jan 2014.  [2] S. Ghiocel, J. Chow, et al. "Phasor-measurement-based state estimation for synchrophasor data quality improvement and power transfer interface monitoring," IEEE Tran. Power Systems, 2014.  [3] K. D. Jones, A. Pal, and J. S. Thorp, “Methodology for performing synchrophasor data conditioning and validation,” IEEE Tran. Power Systems, May 2015.  [4] M. Wang, J. Chow, P. Gao, X. Jiang, Y. Xia, S. Ghiocel, B. Fardanesh, G. Stefopolous, Y. Kokai, N. Saito, and M. Razanousky, “A low-rank matrix approach for the analysis of large amounts of power system synchrophasor data,” in System Sciences (HICSS), 2015 48th Hawaii International Conference on, Jan 2015, pp. 2637–2644.  [5] California ISO, “Five year synchrophasor plan,” California ISO, Tech. Rep., Nov 2011.  [6] L. Xie, Y. Chen, and P. R. Kumar, “Dimensionality Reduction of Synchrophasor Data for Early Event Detection: Linearized Analysis,” IEEE Tran. Power Systems, 2014.  [7] M. Wu and L. Xie, “Online identification of bad synchrophasor measurements via spatio-temporal correlations,” 19th Power Systems Computation Conference, Genoa, Italy, 2016. 23
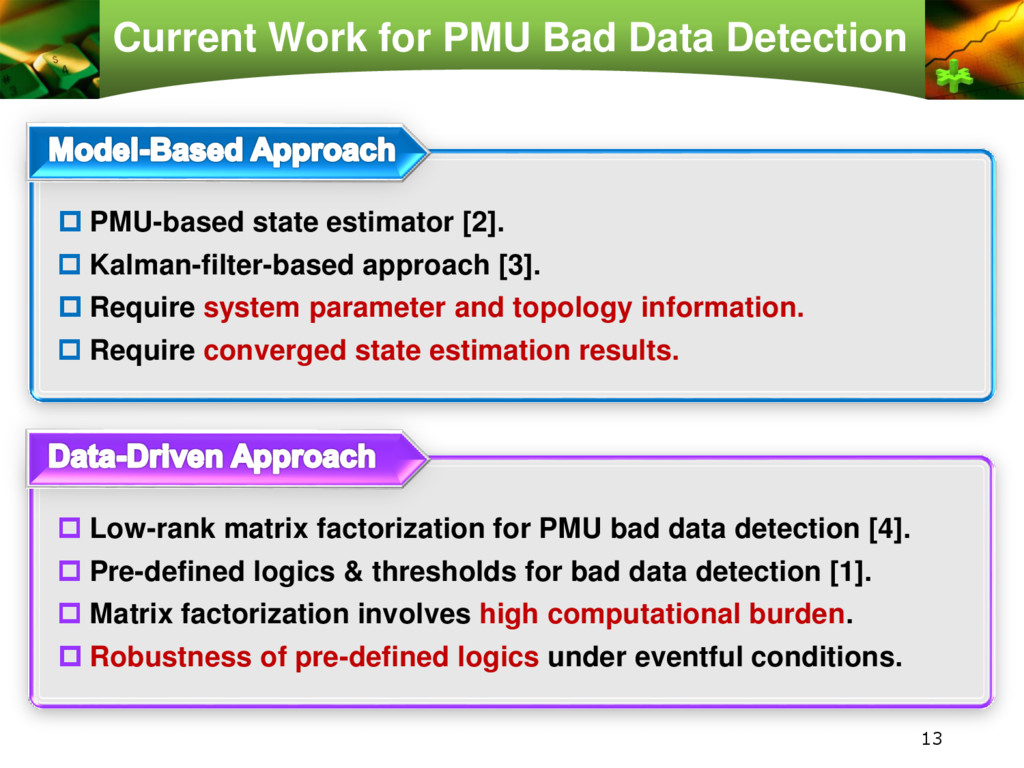
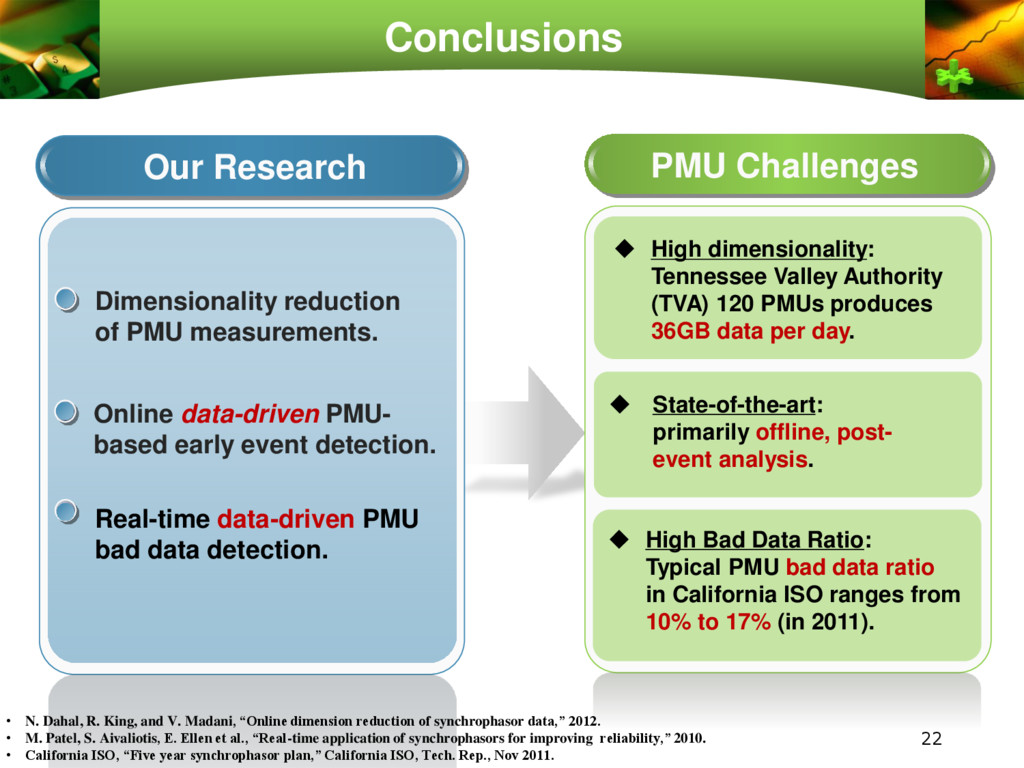
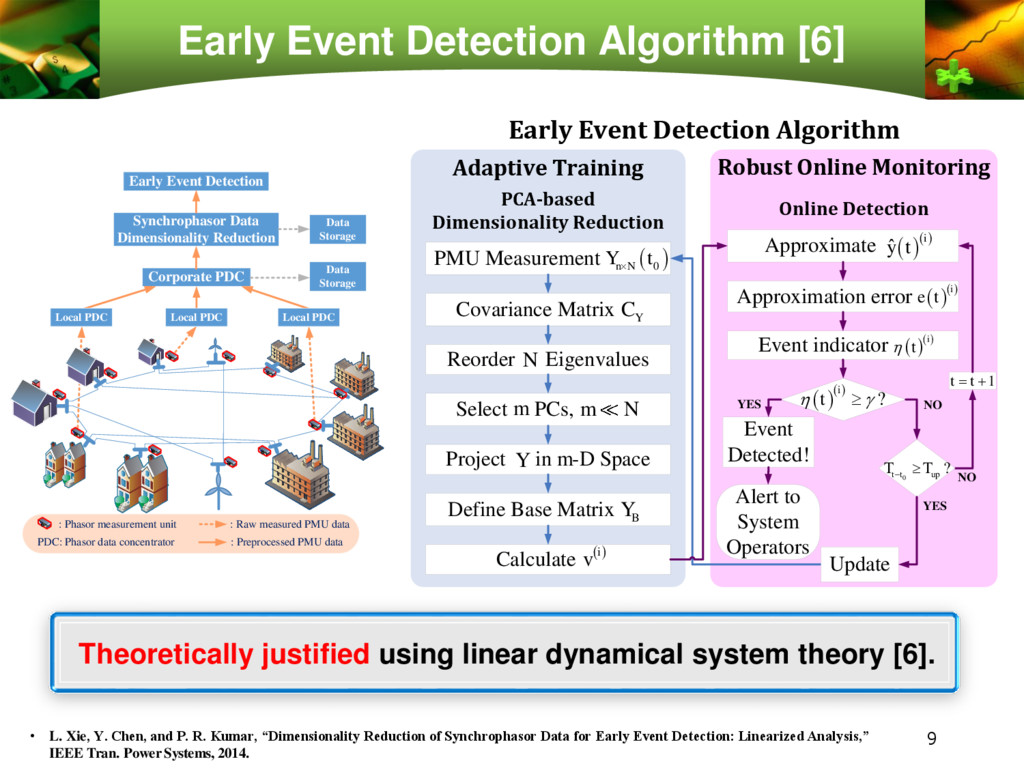
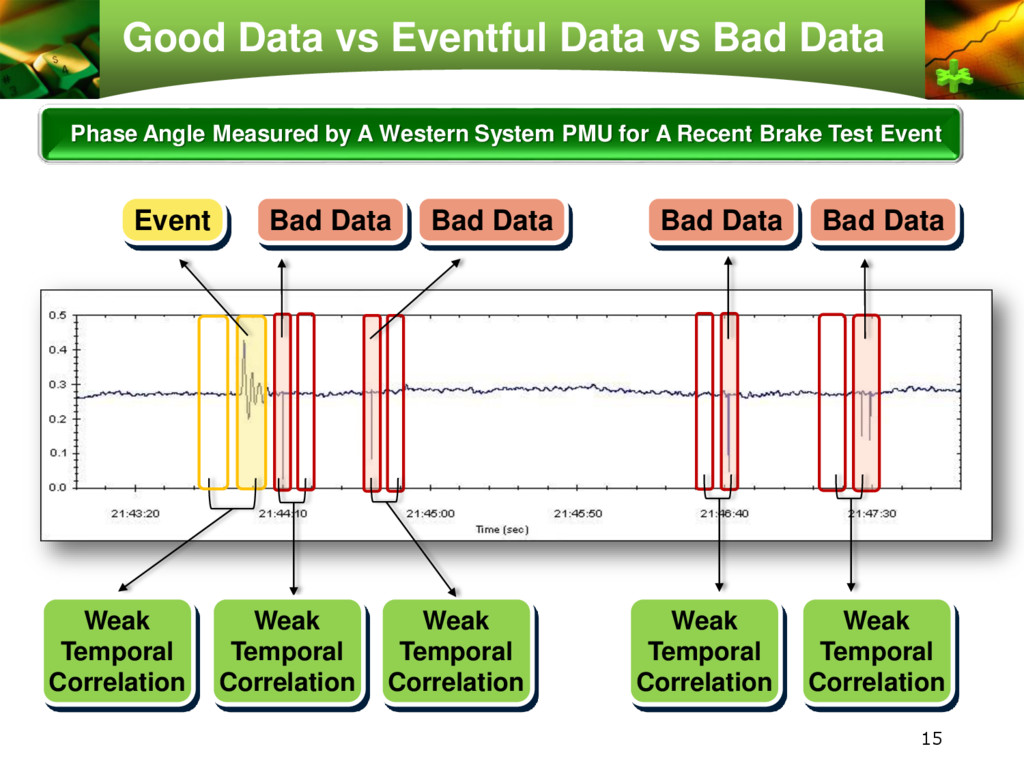
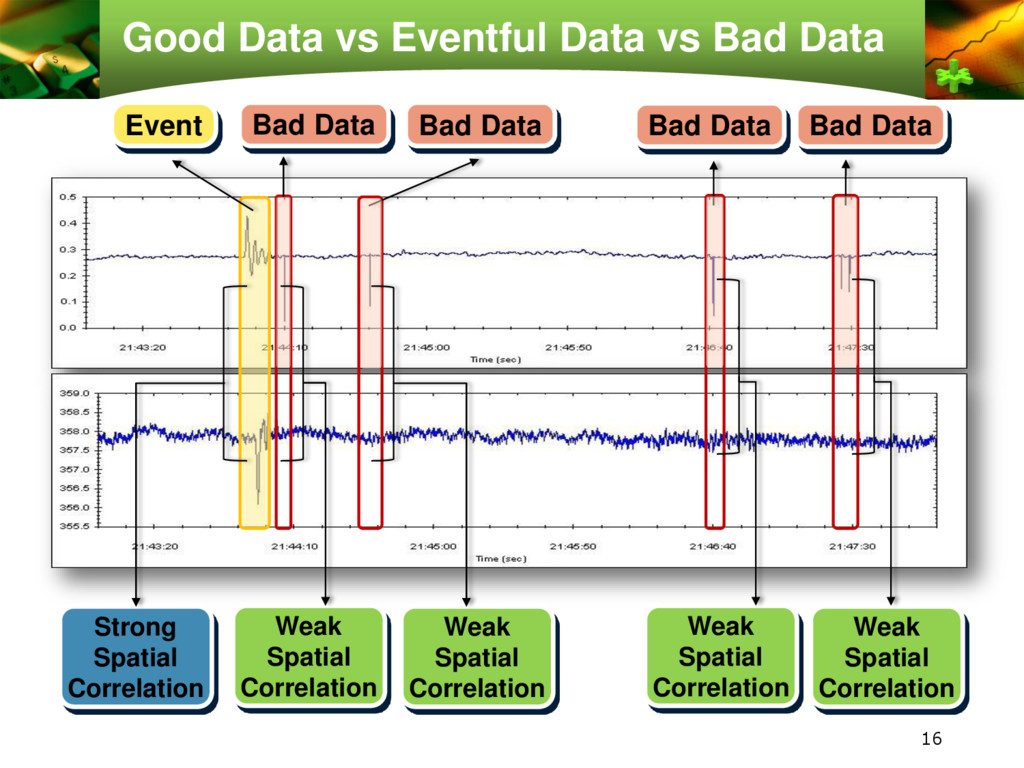
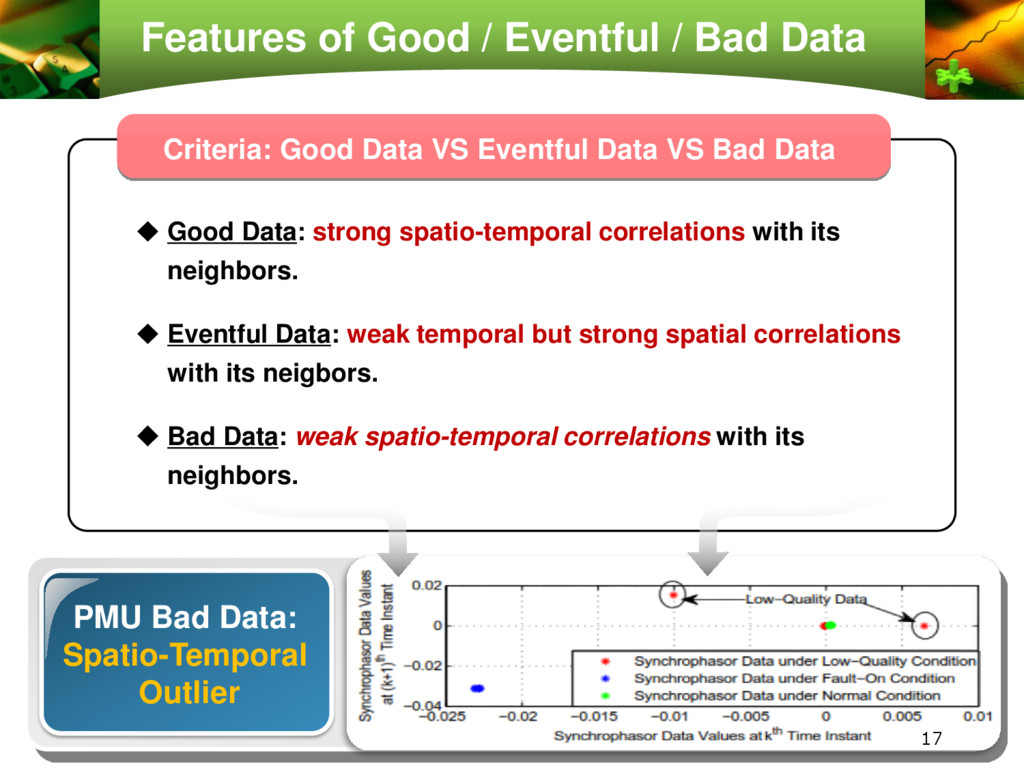