Upgrade to Pro — share decks privately, control downloads, hide ads and more …

Dynamic Locational Marginal Cost of Power Services on Distribution Networks with Price Adaptive Distributed Energy Resources.

gridx.tamu
November 03, 2016

Dynamic Locational Marginal Cost of Power Services on Distribution Networks with Price Adaptive Distributed Energy Resources.

Prof. Michael Caramanis (Boston University), Presentation on Day 1 (Nov.3) of Workshop on Architecture and Economics of the Future Grid

gridx.tamu

November 03, 2016
Tweet

More Decks by gridx.tamu

Other Decks in Research

Transcript

  1. Workshop on Architecture and Economics of the Future Grid Dynamic

    Locational Marginal Cost of Power Services on DER permeated Distribution Networks Texas A&M, November 3, 2016 Michael Caramanis [email protected]
  2. What Are DERs, Really? • PJM’s DER Definition: Distributed Energy

    Resources are distributed generation and storage devices connected to the state jurisdictional distribution system, often but not always close to retail customers. These resources include technologies such as solar photovoltaics, combined heat and power or cogeneration systems, wind turbines, micro turbines, back-up generators and batteries.” What about Flexible Storage-Like loads, e.g., EVs, Pool Pumps, GFAs? • Capabilities, not immediately obvious but nevertheless fundamental to the DER Value Proposition: DERs 1) Can produce or consume Real Power (impacting T-D interface) 2) Produce or consume Reactive Power, (impacting losses &=> T-D interface) 3) Promise and Deliver Reserves in response to RTO Deployment Request (deliver at T-D interface subject to distribution net losses and Voltage constraints). 2
  3. Recent Power System Developments • Extensive Renewable Generation (PV) Adoption

    (PJM 3GW PV – 80% distributed --, 300 MW battery storage for reg B – 50% distributed -, 10GW from 100K customers DR, 30K EVs. CAISO proportionately higher) -Environmental Benefits Blunted by Volatility and Lack of Control (pressure on infrastructure expansion and reserve provisioning) -Remuneration/Subsidies/Policy => inadequate locational and operational incentives (Static volumetric charges, Net metering). • Load Side Evolution: Dominance of Flexible Storage-Like Loads with yet Untapped Reserve and Volt/Var Control Capabilities • Smart Grid/Communication/Computation Revolution: Are Mitigation Synergies “ante portes”? -Systems Science and Distributed Control may Provide Low Cost - High Effectiveness Opportunities 3
  4. Paradigm Shift in Power System Operation and Planning • Power

    System Fundamentals: Non-Storable Electric Power + Uncertainty + Limited Control of Load Flow => Need to – Procure and Deploy Reserves for System Stability – Manage Transmission (Line overload) and Distribution (Voltage bounds and Transformer) Congestion. • Newcomers and Generation Mix: Renewables (Centralized and Distributed) , Flexible Gen. (CCGT) , Inflexible Gen. (nuclear, coal) , Flexible Loads (EV) Distributed Resources (GFA, Inverters) , Inflexible Loads (Lights, capacity demands) , Reserve Requirements , Congestion and/or Equipment Loss of Life & . • Will Familiar Pattern of Generation Following-Consumption and Providing-Reserves be Replaced (at Least Partly) by Consumption-Following-Generation and Providing- Reserves? 4
  5. -Subtle DER Capabilities: Reactive Power Compensation -What is Reactive Power

    and How does it Interact with Real Power and Reserves? • Reactive power is produced/consumed/compensated by loads, DERs, shunt capacitors, power flowing through lines and transformers… • Reactive power line flow causes real power losses, overheats and speeds up transformer aging, pushes voltage beyond tolerable thresholds, causes inefficient operation of appliances (Voltage Sensitive Loads). BUT it produces no useful work! • Reactive power is a drawback of AC electric power. It can be thought of as pollution of the wires. The longer it is allowed to flow uncompensated, the higher its cost If we push P real power and Q reactive power through a distribution line we experience: # Real line losses = r(P2+Q2) # Reactive line losses = x(P2+Q2) where x>r, line reactance larger than line resistance, implies reactive power does not travel competitively. # Voltage Drop ~ 2(xP+rQ). Note tolerance 5 to 10%. 5 
  6. 6 Real and Reactive Power when Voltage and Current get

    out of phase Some Distributed Loads (inductive motors, ballasts, and others) and distribution assets (over ground and underground) pollute Load flow by distorting the synchronization of Alternating Voltage and Current This results in power losses and acceptable voltage level violations
  7. Reactive Power is introduced by 1. Loads with Power Factor

    less than 1 2. Distribution Line Reactance (Overhead), Capacitance (Underground) 7 Power factor (cosφ) S, KVA P, KW Q, Kvar 0.950 1 0.950 0.312 0.900 1 0.900 0.436 0.850 1 0.850 0.527 0.707 1 0.707 0.707
  8. Interaction of Real Power, Reactive Power and Reserves: Impact to

    T-D Interface -Local DER generation may become Un-Deliverable when Voltage upper limits are binding -Local loads may become Un-Serviceable when Voltage lower limits are binding -Reserves promised by DERs may be Un-Deployable when voltage limits are binding. -Excessive reactive power compensation required at the T-D interface may require costly commitment of inefficient centralized generation -Soaring Line Losses may Result in (i) Higher Real Power Substation Consumption, (ii) overloading and faster aging of Transformers, (iii) Magnification/Reduction of DER provided Reserves. 8
  9. Differences Between T and D network Costs and Requirements •

    Voltage Control is Harder in Distribution Networks. • Average Line losses are more significant at Distribution Networks (by 3x). Marginal Spatiotemporal losses may reach 15%+. • Distribution Network Transformer Aging Sensitive to P2+Q2 • Voltage Sensitive Appliances become less Efficient when V at T&D interface is High. This conflicts with line loss reduction objectives! • Reactive Power is more significant in Distribution Networks. Fortunately it may be Traded more Competitively (Whole Sale Power market differences, ubiquitous Power Electronics, x>r) 9
  10. Transmission, Distribution, and T&D Interface Issues • At the Transmission

    Network: – Transmission Line Congestion=> MC Granularity – Stability Requires Reserve Procurement and Deployment • At Distribution Networks: – Transformer overloading tolerated – Line Losses (real and reactive) More Significant – Voltage Limits Provide Congestion => MC Granularity (real and reactive) • T&D interface – DER Demand Apparent to ISO Sensitive to Granular DLMPs – DER Reserve Provision to ISO Sensitive to Highly Granular DLMPs 10
  11. Smart Planning and Operation for Harvesting Broad and Significant DER

    Benefits at Low Cost • Centralized Control (Avoided Cost Based) • Distributed/Collaborative Control (DLMP Based) • Is Adaptive Forward DLMP Practical? - Computationally/Communication-wise tractable? - Competitive Conditions? Collusion? Capacity withholding? - Cybersecurity-Wise Safe? 11
  12. DER Examples and their Capabilities • PV: Distributed Non-Controllable Generation

    of Real Power BUT Controllable Volt/Var inverters can provide Reactive Power Compensation using excess inverter capacity • EV: Storage Like Flexible Demand AND Reactive Power Compensation • Electric Space Conditioning/Heat Pumps: Flexible/ Storage Like loads (precooling-preheating) with often Reactive Power Compensation capability (e.g., Var. Speed Drives) • Computing: Server farms, Data Centers • Duty Cycle Appliances, Distributed Storage, and of course… • Battery Storage All of the above Can promise and deploy reserves. 12
  13. 13 Incurred Cost Distribution, Congestion, Reserves, Voltage Control, Losses, Transformers,

    Deliverability Generation Costs 50% Transmission Costs 5% Distribution Network Costs ~ 10xTransm. Costs , , ℜ ഫ ≤ ≤ ത ℜ Locational Marginal Price of Real Power at bus n, during hour t Locational Zonal Price of Reserves at bus n one Z, during hour t t n t n LMPP LMP z    
  14. 14 t n t n LMPP LMP 2 2 ,

    { [( ) (Q ) ]} i i i i t t t t n n n n n n i P P r P     2 2 , {Q [( ) (Q ) ]} i i i i t t t t n n n n n n i Q x P     ,Q , i i i i i i i t n t t t n n n t n n n DLMP P V V V    , { 2 } i i i t t t n n n n n i r P      2 2 TransfLossOfLife [( ) ( ) ] t t t n n P Q    Interface between Transmission & Distribution
  15. 15 Meshed Transmission, Sub-transmission, and Distribution Schematic Expanded Distribution Feeder

    Schematic. Although depicted as a radial topology, it may be partly or even primarily meshed (ConEd). N n n     n n n n , ( ), ( ), ( ) ( ) P R i n n n n Q t t OC t   n n   ( ) ( ( ) ( ) ) , , i i i Q n i P n R n i n t t t t n v    ( ), ( ), ( ), ( ) k k k k P Q R n n n n t t t t    
  16. DLMP Components: Max DLMP/LMP examples 19 P-DLMP(351,7am) P-DLMP(619,5pm) Q-DLMP(351,7am) Q-DLMP(619,5pm)

    LMP 45.1 85.04Real Component 0.270599982 4.166960043 Real Losses 0.721599986 23.55608022Reactive Component 7.859643732 56.97063807 Reactive Component 0.105444136 15.98801817Transformer Comp. 17.19 0.21 Transformer Comp 29.4 0.459999999Voltage Component 0.005611093 0 Voltage Component 0.007508159 0TOTAL 25.32585481 61.34759811 TOTAL 75.33455228 125.0440984
  17. Example from Summer Peak day demonstrating that DLMPs Provide Locational

    Incentives and Optimal Reactive Power Compensation (negative Q is possible) 20 Hour 2pm Bus 689, V=1.1! BINDING PV real (kW) PV reactive (kVar) P-DLMP Q-DLMP LMP 4.44 -1.43 14.52 -2.87E-06 89.21 Bus 619, V=0.95, NOT Binding PV real (kW) PV reactive (kVar) P-DLMP Q-DLMP LMP 4.44 1.46 111.83 37.88 89.21
  18. Illustrative Numerical Results: Day ahead Distribution Market Clearing of a

    800 node Upstate NY Feeder on a Summer Day Market Structure Average No Q from DER LMP No Q from DER Full DLMP A Substation Transaction Costs for P 13281 13172 13235 B Substation Transaction Costs for Q 1182 1133 777 Total Substation Cost A+B 14463 14305 14013 C Charges to Space Conditioning for P 743 721 703 D Charges to Space Conditioning for Q 212 188 140 Total Space Conditioning Charges C+D 955 909 843 E Charges to EV for P 220 127 127 F Charges to Inflexible Loads for P 15102 15037 14869 G Charges to Inflexible Loads for Q 2089 2027 1609 Total Inflexible Load Charges F+G 17190 17065 16478 H Income of EV for Q provision 0 0 134 Net EV Charges E-H 220 127 -8 I Income of PV for P provision 1494 1493 1408 J Income of PV for Q provision 0 0 169 Total PV Income I+J 1494 1493 1577 K Total Charges (K=C+D+E+F+G) 18365 18101 17448 L Total DER income (L=H+I+J) 1494 1493 1711 M Net Cost of Distribution Participants (M=K-L) 16871 16607 15737 N Distribution Network Rent (N=M-A-B) 2408 2302 1724 21
  19. Size of Market for Reactive Power 22 Indicative Estimates of

    Average Price of Reactive Power against Power Electronics Capacity Penetration as a % of Maximum Hourly Reactive Power Consumed. PF .8 .88 .92 .95 Q/P .75 .54 .426 .33 2 1 / PF Q P PF    0 5 10 15 20 25 30 35 40 0% 30% 60% 90% PF=0.8 PF=0.88 PF=0.92 PF=0.95 $/MVarh Power Electronics Capacity as % Of Max Q consumption
  20. Conclusion • Get Prices Right, then Design “a Million Contracts”

    Associated to DLMPs. • Chart a Gradual Way Forward that does not Introduce irreversible barriers to an eventual Subsidy Free/Economically Efficient Power System Future • Good News: Gradual Introduction of DLMP based Transactions/Participants is win-win for participants as well as for non- participants! 23
  21. Reactive Power Affects All Costs and Voltage magnitudes! 26 2

    2 , , , {Q [( ) (Q ) ]} i i i i n n n n n n n n i Q x P     2 2 , , , { [( ) (Q ) ]} i i i i n n n n n n n n i P P r P     1 1 Transformer Loss Of Life [ ] [ , , , ] Hotest Spot t Hotest Spot ambient Hotest Spot t t t t t where Function S S         , Q i i n n P 2 2 2 , , ( ) ( ) 2( ) i i i i i t t t t n n n n n n n n V V V r P x Q      i i i n n n V V V   Real and Reactive Consumption at Distribution Network Location i below Sub-Transmission bus n Reactive Power at Sub Real Power at Sub Voltage Level Control
  22. Why do Non Rotating (read renewable) Generators Impose the Need

    for more Primary and Secondary Reserves? 27
  23. 28 0 s 5-10 s 20-30s 5-10 min Time Frequency

    Nadir Settling Frequency Primary Freq.Ctrl Automated Generation Control (AGC) System Freq. 60 Hz ~59.5 Hz Slope ∝ System inertia System frequency control following a loss-of-generationcontingency event. Under Freq. Load Shed. Thresh Contingency Event tia , , Inertia, , decreases with increasing renewable integration. Fast Reserve Requirements (primary and secondary) increase ( ) ( ) ( ) j mech j elec j j j P t P t d t H dt H    
  24. 29 Data Set I (From 2006 to Spring 2008) Data

    Set II (From Fall 2008 to Spring 2010) Δω 0.5 0.4 0.3 0.2 0.1 0 500 600 700 800 900 1000 1100 1200 1300 1400 1500 1600 1700 1800 MW Loss Declining grid inertia within ERCOT interconnectionfrom 2006 to 2010. System frequency decline is shown as a function of power loss in the system, with the red curve illustrating the loss of system inertia as a result of increased penetrationof renewables. Actual Observations In ERCOT Verify Impact of Renewables!
  25. 30 -0.8 -0.6 -0.4 -0.2 0 0.2 0.4 0.6 0.8

    1 D: 10/1/11 S: 9/1/10 Instance of PJM Regulation Signals, ydyn(t) and yslow(t) on different days. Note: (i) random nature but (ii) energy neutrality over a relatively short period of Time Flexible Loads Require Energy by some deadline => Capable of responding to Regulation Service Signal ) ) ( ( i i i D t y D t   
  26. 31 Example of Generator providing Super Fast Reserves: Frequency control

    and  40MW of Secondary Reserves Source: Courtesy of EnThes Inc., March 2007 Today Generating Units are the Only RS Reserve Providers! Frequency Control Secondary Reserves 320MW50MW
  27. Planning to Operation Practices Followed in Today’s Wholesale Power Markets

    are Surprising Useful (and Adaptable?) • Generation Capacity and Transmission Congestion (FTR) Markets – Years to Months • Forward Energy Commodity Markets – Months • Energy and Reserve Co-Clearing Markets: – Day Ahead: Multiple Hours – Hour Ahead/Adjustment Market – Hour • Reserve Deployment Dynamics: – Operating: 5 min., – Regulation Service (AGC Centralized): 2-4 sec – Frequency Control (Decentralized): Real-Time 32
  28. Extended Market Clearing => I. T&D Locational Marginal Prices (T&DLMP)

    II. Scheduling of DER Capacity among Real and Reactive Power and Reserves. • the Marginal/Incremental cost to the Power System associated with Delivering a unit of Service x to location n at time t. This results in optimal operating decisions. • x ranges over real, reactive power and reserves • n ranges over T&D busses 33 ( ) x n t  
  29. LMPs : Wholesale – High Voltage -- Market Clearing (DC

    approximation) 34 , , , , , gen dem , , , , ˆ lingap ˆ , ' , ' , ' , ' , ' , ˆ min ( ) ( ( )) subject to ( ) 0 ( ); ( ) 0, ( ) 0 ( ) ( ); ( ) ( ) ( )ShF ( ) ( ) ( ), j j n n j j j j n n n n P R j n t j n t j j j n n n j n t j R n Z Z j n Z t n n n n n n n n n n n n n n u P t J R t P t Losses t t P t P t R t t t P t P t P t t P t t                            ' ˆ , ' , ' ˆ ( ); ( ) ( ); pluscapacity constraints ShF ( ) the line flow shift factor -- linearization -- at n j n n j n n n n n n t t P t P t P t t P       Line Cap. Related !!!Congestion!!!
  30. LMP price Relations 35 ˆ ˆ ˆ , ' ,

    ' , ' ˆ ( ) , ' , ' , ' ˆ ˆ ˆ ˆ ˆ ˆ ˆ , , 0 ( ) ( )(1 ) ( ) ( )ShF ( ) where ( ) [ ( ) ( )] ( ) ( ) max [| ( ) | ( ) / ] j n P n n n n n n n n n g n n n n n n n R R P j j j j n Z n n n n n j n Z R Losses t t t P t t P t t t t t t u J R R                         !!!Congestion!!!
  31. Proposed Distribution Market Problem formulation: Minimize Utility Loss, Real and

    React. Power Cost (incl Losses), Asset Life Loss, and Volt. Control Costr, s.t. Load Flow , Capac., Volt. Magnitude Constr. , , 2 2 2 , , , , ( ) ( 1) 2 ( ) ( ) ( ) R up R down P OC R v j j j j b b b b b b j b j b b b tr P P P C C Q c v u X J R S                               Minimize Subject to: constrains shown below 36 Over DER real, reactive power and reserves and substation voltage V ∞ : Sum over all hours. Note Sum over t and (t) argument not shown to avoid notational Clutter. Opportunity Cost of Q at Substation Substation Real P Cost of Transf. life loss. Value of Sec. Reserves at Substation Cost of deviating from Nominal V a substation Utility (- or +) of State X at the end of hour t Expected Average cost of deployment of during hour t j b R
  32. Subject to: Load Flow relations when the regulation signal y=0

    (relaxed branch flow model) 37 2 2 2 , ' , ' , ' , ' 2 2 2 ' , ' , ' , ' , ' , ' , ' , ' , ' ' , ' ' , ' ', , ' , ' Def. Current/Voltage Square (A1) 2( ) ( ) (A2) (A3) (A4) (A b b b b b b b b b b b b b b b b b b b b b b b b b b j P b b b b j b j Q b b b b j b b b b b b b b b P Q S v V v v r P x Q r x P P Q Q P P r real losses                     , ' ', , ' , ' 5) (A6) , (A7) b b b b b b b b b b b b b b Q Q x reactivelosses v v v             !!!Congestion!!! Bus Related
  33. Scheduled Generation Centralized Top-Down Control Planning Based, Dispatched Unidirectional Flows,

    Consumers Redundancy, N-X Contingencies Distributed Voltage Control … a new paradigm Courtesy Deepak Divan, ECE Georgia Tech 11/3/2016 38 Centralized Control Distributed Control Non-Dispatchable Variable Generation Distributed Edge-Up Real-Time Control Flexible, Secure, Predictable Virtual Resources Bidirectional Flows, Prosumers Support Transactive and Ancillary Services 245 240 235 230 225 220 Nodes Time of Day Time of Day Nodes 245 240 235 230 225 220 Centralized top-down control – poor system performance Edge-up real-time control - local & system level control Source: Southern Company and Varentec
  34. Secondary Reserves are Promised in Advance – hour ahead –

    but deployed by regulation signal, -1<y<+1, updated every 2-4 seconds. This Introduces associated Voltage congestion Constraints and Voltage Control Actions! 39
  35. 40 , 2 , 2 , ' , ' ,

    , ' , , , , , 2 2 , ' , ' , ' , ' , ' , ' , ' , ' , , , ' ' , , , , ' ' , , ' ( ) ( ) (B1) 2( ) ( ) (B2) (B3) (B4) R up R up b b b b R up b b R up b R up R up R up R up R up b b b b b b b b b b b b b b b b j j R up P up b b b b b j j b j up R up Q up b b b b j b R up b b b P Q v v v r P x Q r x P R P Q Q P P                     , , ', , ' , ' , , , , ' ', , ' , ' , , , (B5) (B6) , (B7) R up R up b b b b b R up R up R up b b b b b b b b R up R up R up b b b r Q Q x v v v         Subject to: Load Flow relations when the regulation signal y=1 (relaxed branch flow model)
  36. 41 Subject to: Load Flow relations when the regulation signal

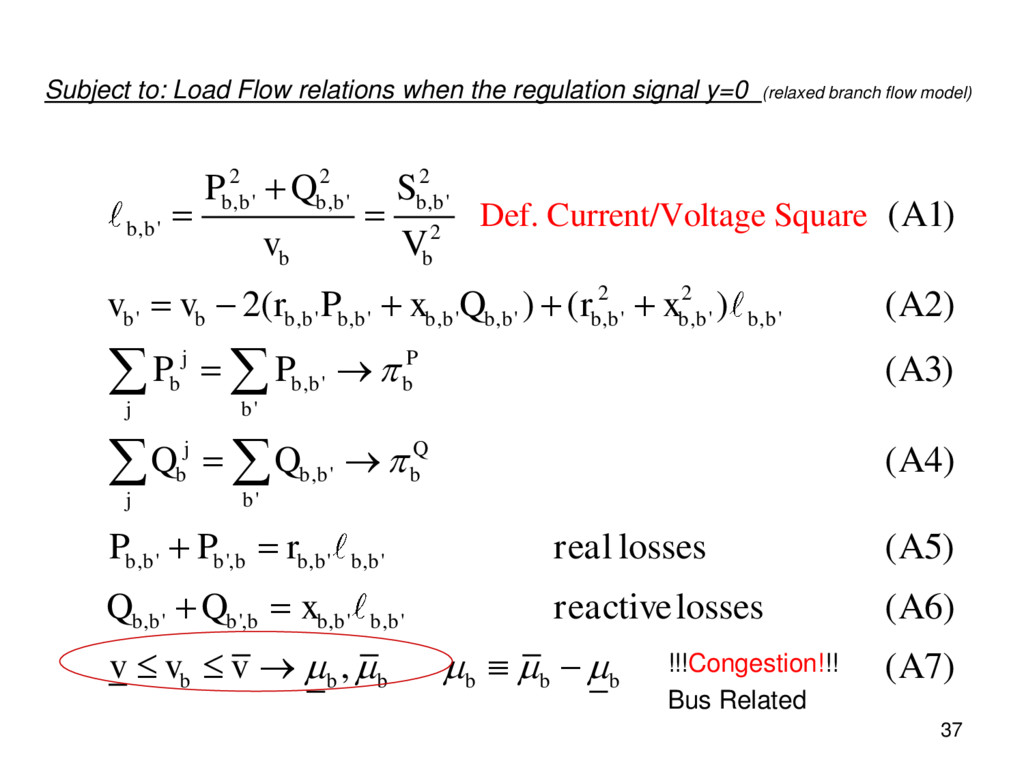
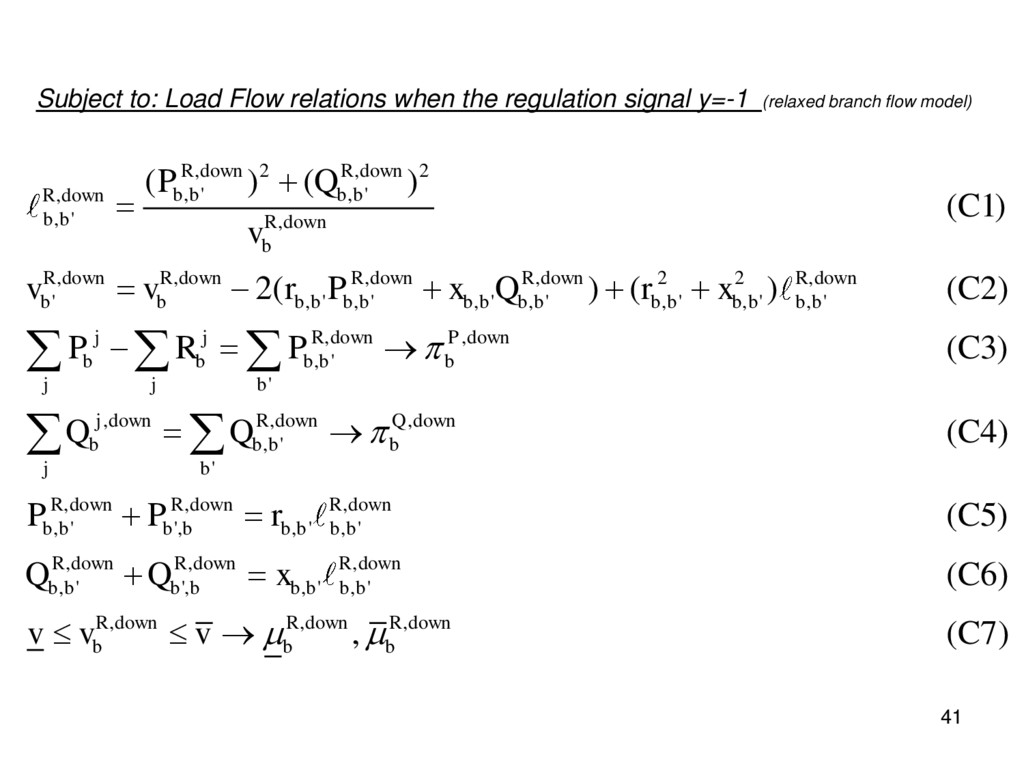
    y=-1 (relaxed branch flow model) , 2 , 2 , ' , ' , , ' , , , , , 2 2 , ' , ' , ' , ' , ' , ' , ' , ' , , , ' ' , , , ' ( ) ( ) (C1) 2( ) ( ) (C2) (C3) R down R down b b b b R down b b R down b R down R down R down R down R down b b b b b b b b b b b b b b b b j j R down P down b b b b b j j b j down R down b b b j P Q v v v r P x Q r x P R P Q Q                 , ' , , , , ' ', , ' , ' , , , , ' ', , ' , ' , , , (C4) (C5) (C6) , (C7) Q down b b R down R down R down b b b b b b b b R down R down R down b b b b b b b b R down R down R down b b b P P r Q Q x v v v            
  37. 42       2 2 2

    min( , ) DER Secondary Reserves DER Reactive Power Capabilities: Note: DER Reactive Compensation can take continuous values, + or -, => optimal compensation is possib j j j j b b b b j j j b b b R P C P bidirectional P Q C                 2 2 2 , 2 2 2 , , , , le, UNLIKE Utility Capacitors! State Variables, X( ), Dynamics (example of X {SoC, ) SoC ( ) SoC ( 1) ( ) ( ) ( 1) ( ) ( ) [ j j j up j b b b b j j j down j b b b b EV EV EV b b b j i j in j in j b b b b b P R Q C P R Q C t T t t P t T T t T t a V P t b                , , ( 1) ( ) ( )] 2 n j in j out b b t T t T t    Subject to: Device Specific Constraints
  38. Real Power DLMP Interrelations and Relation to LMPs Note: Cost

    of modulating V ∞ modeled approximately and conservatively low 43 , * * * * * * , , 2 2 , ˆ ˆ , ' ' ˆ ˆ ' , , , ˆ ˆ ( ) ˆ ˆ TotalPLosses Note: (1 ) ˆ ˆ TotalQLosses ˆ ˆ s s s s s s s s s s s s s s s OC P P b b b b b b b b b b tr b b b b b b P Q Q P P C Q v P P P P P Q P P                                               
  39. Reactive Power DLMP Interrel. and Relation to LMPs Note 1:

    Cost of modulating V ∞ modeled approximately and conservatively low Note 2: Reactive power is also priced and scheduled for Regulation signal instances y=-1 and y=+1, but not shown here. 44 * * * * * * , , , 2 2 , ˆ ˆ , ' ' ˆ ˆ ' , , , ˆ ˆ ( ) ˆ ˆ TotalPLosses Note: ˆ ˆ TotalQLosses (1 ) ˆ ˆ s s s s s s s s s s s s s s s OC Q P b b b b b b b b b b tr b b b b b b P Q Q Q Q C Q v Q Q P Q Q Q Q Q                                               
  40. Secondary Bidirectional Reserves DLMP Interrelations and Relation to LMPs 45

    * , ' ' ' ' ˆ ˆ ˆ s s s up dn R R up dn b b b b b b b b b b R v v R R R                    * * * , , , where, 2 s s s s s s up dn P P R        
  41. Issue: Centralized Market Clearing Approach is Not Tractable. Why? •

    Transmission (HV) System (Real Power and Reserves) – Generator costs minimization and associated constraints – Load Flow (DC approx. OK) and Transmission Line Congestion – Regional Reserve Requirements – Line Losses (1.5% on average) • Distribution Network (Real and Reactive Power and Reserves) – DER Cost Minimization and associated constraints INTRACTABLE in Centralized Model! – Transformer Life Degradation – Line Losses (6% on average) – Reactive Power Compensation – Voltage Control – Load Flow. Non Linear AC relationships required! • BTW, why is Reactive Power not Priced in HV Markets? 46
  42. Typical Size of T&D Networks and communication constraints in the

    absence of Distributed Algorithms Set of Transmission Network nodes Set of Transmission-Distribution Feeder interface nodes, Radial distribution feeder node associated with root node set of feeder nodes under root node Number of DERs connected to elements of , Number of Lines/Transformers in , Total system nodes 47 n N   n N   N N  i n n i n n   n | |~10 n K   | |~10 N K | |~10 N K n  5| | n   | | n   ℵ෤ | n       
  43. Distributed Algorithms (iterative) Provide the Only Practical means to overcome

    Computational Tractability and Communication Constraints. Aside on Communication Challenges. Available communication technologies (e.g., twisted-copper phone lines, fiber optic cables, cellular, satellite, power line carrier, short-range in-home technologies such as WiFi and ZigBee) pose questions on reliability, vulnerability to disasters and/or malicious attacks, privacy guarantees, inherently limited bandwidth/Shannon Capacity, high deployment cost, and/or unacceptable network delays. => Research on -Quantized links and Data Compression -Communication latency and link failures -Asynchronous Execution. How About Distributed Algorithms? 48
  44. Imbalances & Prices Sub-problem Solutions ADMM, a PMP Algorithm May

    Achieve Network Asset and DER Objective maximization Consensus Tractably!. Asynchronous/Parallel Sub-problem Solution: Each device (DER and Line) solves individual sub-problem Each Bus calculates imbalances & prices Iterative Process, until bus balance violations→0 Convergence rate (partly distributed/mixed algorithms)? PMP based convergence Certificate? Vulnerability to Malicious Communication Interception?
  45. Distributed Market Clearing Algorithm Challenges • Regional reserve requirement constraints

    involve multiple transmission and T-D interface busses. • Reserve deliverability at Distribution Feeders must observe Voltage Constraints (Congestion) under Reserve Deployment Contingencies. • Reactive Power Compensation must be Sensitive to Reserve Deployment Contingency Voltage Limitations. • Competitive markets? Opportunity for Strategic Behavior, particularly under Load Aggregating ESCOs? 50
  46. Full T&D Market Supports Innovation! • Operational and Investment Efficiencies

    => Resilience of Infrastructure • Efficient Supply of Fast Reserves => Renewable Generation Integration • Sustainable Marginal Losses Reflected in T&DLMPs=> Distributed Adaptation to Short term and Anticipation of Long Term Costs/Benefits • Reactive Power Pricing allows Dual Use of Power Electronics => Operational and Investment Efficiencies (Distributed PV, EVs, Heat Pumps, New Devices and controllers…) 51
  47. Open Issues Remain. However, Prospects Promising… • Interplay of Real

    Power Reserves and Reactive Power provision by DERs for Reserve Deliverability Slow Voltage Constraint Dual Variables Convergence in Distributed Algorithms. • Proof that Price Directed Dynamic DER Services work in practice as advertised (harmonics?) • Market Deficiencies (market power/capacity withholding, strategic behavior) must be further studied and their prevalence empirically evaluated in practice. Hence, Regulatory issues are still on the table • Communication Architecture to support distributed business models still on the table, including malicious attacks. • Will New Business Models/Entities step up to supplement/replace existing utility structures? • New Financial Instruments for risk mitigation? – Hedging – Auctions for futures, DER reserve deliverability a la FTRs, more…… 52
  48. The Value Proposition of a DER Platform / Platform Market

    • Supports development and operation of a new, competitive market for core electric products, i.e., well-defined products, transparency, multiple buyers and sellers can enter and exit the market freely. • Enables granular, economically efficient prices that reflect the time- and location-specific value of real energy, reactive power and reserves • Minimizes transaction costs or friction associated with sale and purchase of core electric products and price discovery • Expands DER access to markets for their core electric products – Real Energy (kWh) – Reactive Power (KVARh) in order to maintain voltage within an acceptable band – Reserves (a commitment to deliver real or reactive power in the future) • Animates emergence of new products and services – Combinations of products and services from DER and third parties – Third party value-added services: price forecasts, analytics, smart technology • Improves distribution system efficiency: local source of Volt / VAR control 55
  49. What could a DER Platform look like?? • Single regional-level

    platform – Efficiencies in scale and scope – Able to take full advantage of any network externalities – Reduction in transaction costs along multiple paths • Distribution Utilities within the region could jointly own the Platform as “sponsors” – Own Intellectual Property – Set the market rules, subject to PSC approval • Professional / Independent entity operates the platform and manages the market as “provider” – Operates / administers all markets on the Platform 56
  50. Market Structure for Core Electric Products • Forward market (ex

    ante) – Continuous, bilateral transactions: location- and time-based bids and offers are matched and price formation occurs – Closes immediately prior to the time of simultaneous production and consumption of electricity – Forward options contracts enable Distribution Utilities to avoid distribution system investments by obtaining advance commitments from DER to provide location-specific resources (e.g., voltage support, operating reserves) • Clearing or Balancing Market (ex post) – Needed to clear imbalances between scheduled energy deliveries and actual energy consumed – DSOs provide the Platform with relevant data on imbalances, including actual “real time” consumption, production, load flows and distribution system topology – Platform runs a mathematical load flow calculation, with the substation LMP as the reference price, to determine a clearing price for energy and reactive power at each traded distribution node. Prices would become more granular in phases, starting at existing, sub-zonal transmission nodes(“enhanced LMP” or eLMP) and moving to Distributed LMP (DLMP), as utilities implement interval measurement of real and reactive power at sufficient points to estimate distribution power flows.