Electricity Project Juan Andrade, Yingzhang Dong, and Ross Baldick Workshop on Architecture and Economics of the Future Grid Texas A&M University November 4, 2016
University of Texas at Austin Energy Institute. • Quantify costs of electricity from power plant to wall socket, including direct and indirect costs. • Develop calculator to evaluate costs of thermal and renewable electricity: • Including costs of generation, transmission, distribution, ancillary services, externalities, • Conceptual difficulties in assigning transmission, distribution, and ancillary services costs to individual generation plants and technologies. • Further details and reports available at http://energy.utexas.edu/the- full-cost-of-electricity-fce/ 3
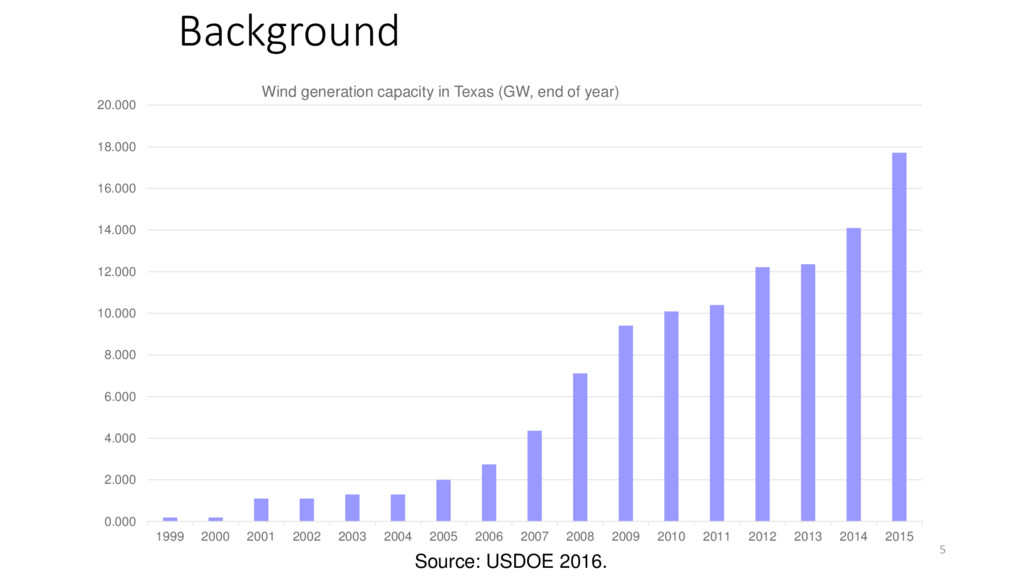
development of utility- scale renewable generation in U.S., particularly wind: • Texas has largest amount of wind of any state, • The Electric Reliability Council of Texas (ERCOT) region has the largest penetration of wind among North American Interconnections, • By 2015, there was 16 GW of wind power in ERCOT (18% of total installed capacity)(*). • Wind provided 12% of electrical energy in ERCOT in 2015 (**). • Most wind capacity installed in the last 8 years. (*) ERCOT Quick Facts 2016, (**) ERCOT Independent Market Monitor Report 2015. 4
renewables will likely result in further growth. • Given the intermittent/variable production of renewable generation, concerns about system reliability have arisen. • Maintaining historical levels of reliability in the face of increasing intermittent renewables might increase costs: • For example, requirements for procured Ancillary Services might increase significantly. • First discuss reliability and implications for required procured capacity of Ancillary Services. • Then explore historical data for wind in ERCOT. 6 (*) ERCOT Quick Facts 2016
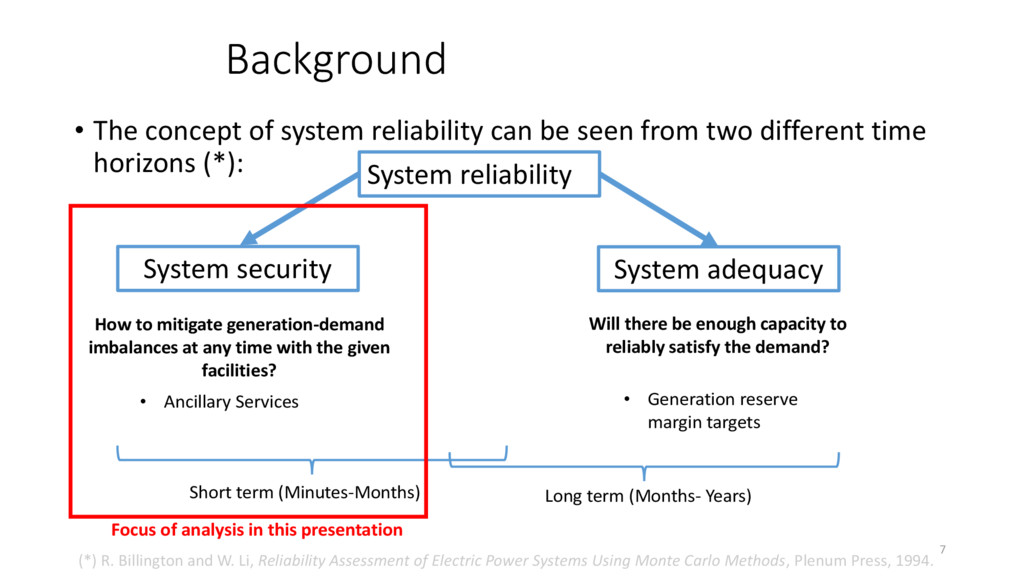
from two different time horizons (*): System reliability System security System adequacy Short term (Minutes-Months) Long term (Months- Years) How to mitigate generation-demand imbalances at any time with the given facilities? Will there be enough capacity to reliably satisfy the demand? • Ancillary Services • Generation reserve margin targets Focus of analysis in this presentation (*) R. Billington and W. Li, Reliability Assessment of Electric Power Systems Using Monte Carlo Methods, Plenum Press, 1994. 7
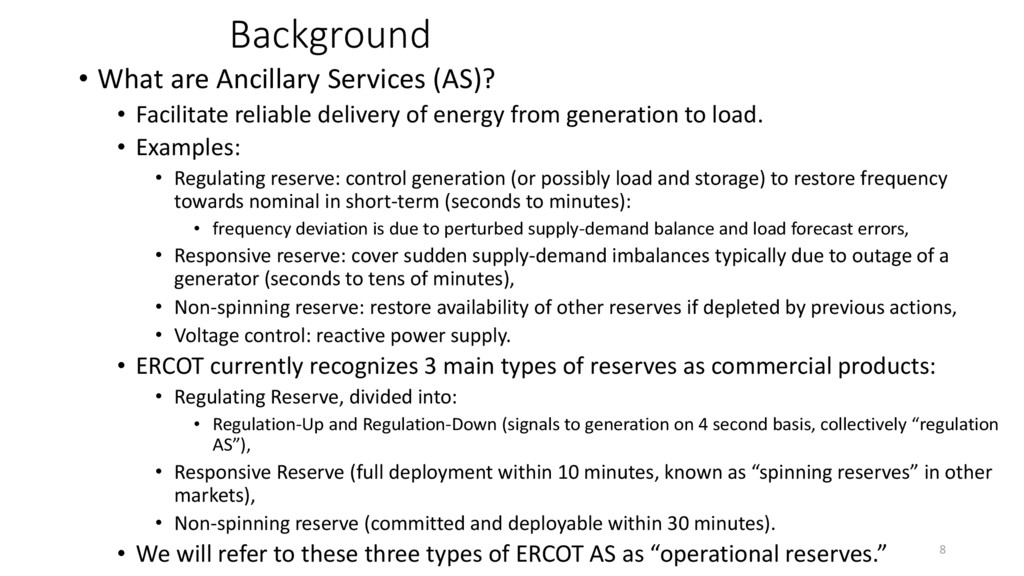
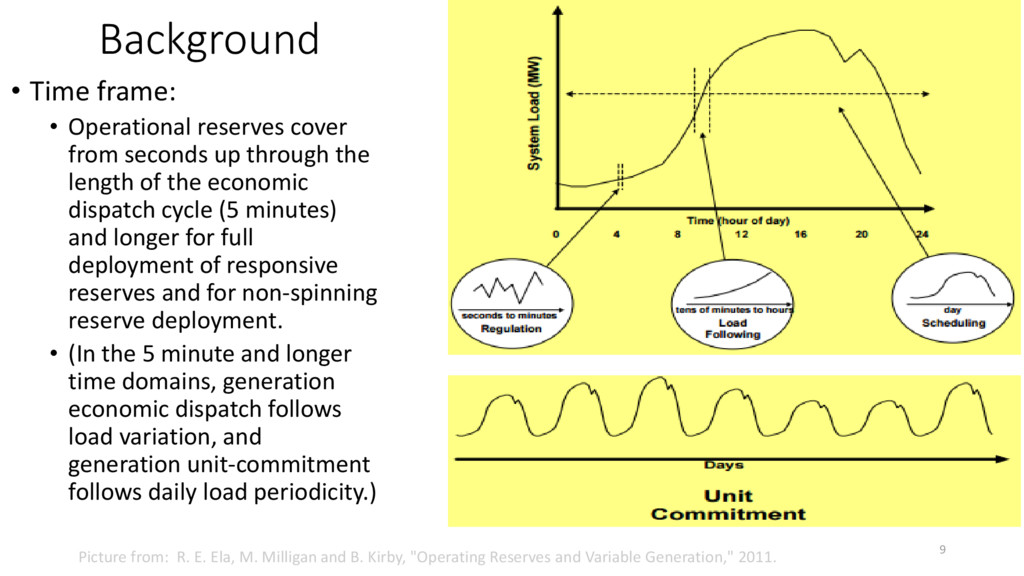
delivery of energy from generation to load. • Examples: • Regulating reserve: control generation (or possibly load and storage) to restore frequency towards nominal in short-term (seconds to minutes): • frequency deviation is due to perturbed supply-demand balance and load forecast errors, • Responsive reserve: cover sudden supply-demand imbalances typically due to outage of a generator (seconds to tens of minutes), • Non-spinning reserve: restore availability of other reserves if depleted by previous actions, • Voltage control: reactive power supply. • ERCOT currently recognizes 3 main types of reserves as commercial products: • Regulating Reserve, divided into: • Regulation-Up and Regulation-Down (signals to generation on 4 second basis, collectively “regulation AS”), • Responsive Reserve (full deployment within 10 minutes, known as “spinning reserves” in other markets), • Non-spinning reserve (committed and deployable within 30 minutes). • We will refer to these three types of ERCOT AS as “operational reserves.” 8
up through the length of the economic dispatch cycle (5 minutes) and longer for full deployment of responsive reserves and for non-spinning reserve deployment. • (In the 5 minute and longer time domains, generation economic dispatch follows load variation, and generation unit-commitment follows daily load periodicity.) Picture from: R. E. Ela, M. Milligan and B. Kirby, "Operating Reserves and Variable Generation," 2011. 9
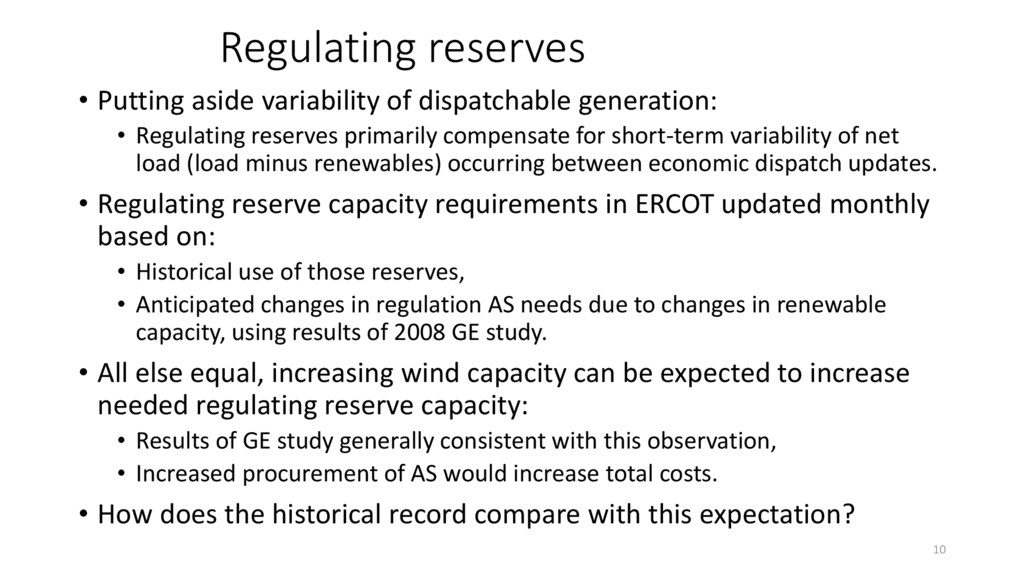
Regulating reserves primarily compensate for short-term variability of net load (load minus renewables) occurring between economic dispatch updates. • Regulating reserve capacity requirements in ERCOT updated monthly based on: • Historical use of those reserves, • Anticipated changes in regulation AS needs due to changes in renewable capacity, using results of 2008 GE study. • All else equal, increasing wind capacity can be expected to increase needed regulating reserve capacity: • Results of GE study generally consistent with this observation, • Increased procurement of AS would increase total costs. • How does the historical record compare with this expectation? 10
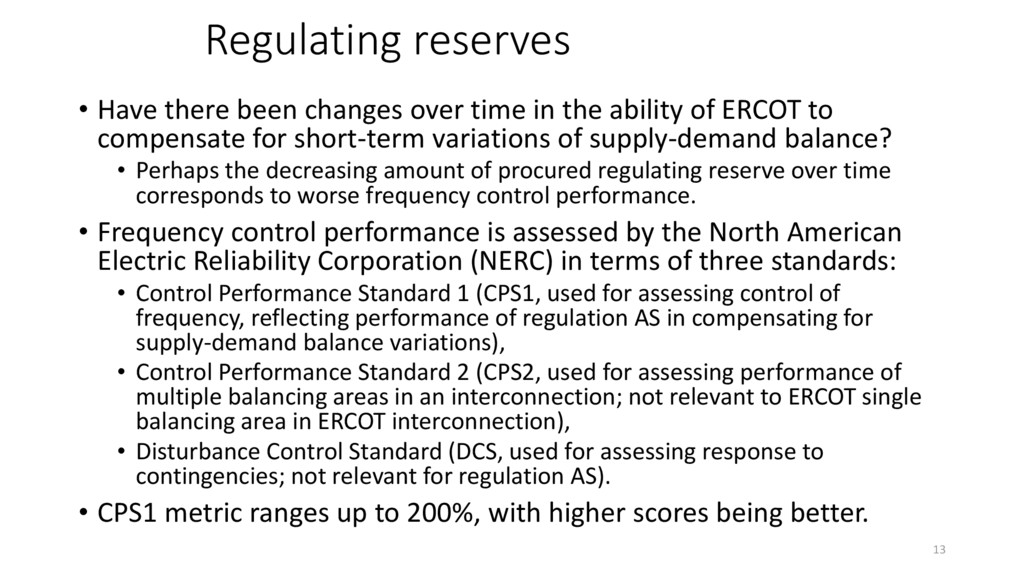
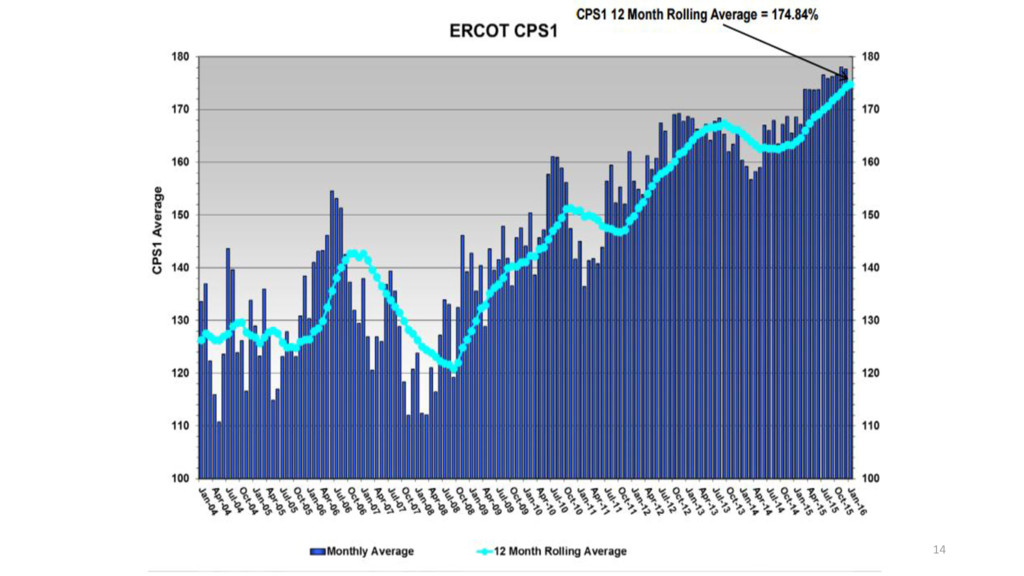
the ability of ERCOT to compensate for short-term variations of supply-demand balance? • Perhaps the decreasing amount of procured regulating reserve over time corresponds to worse frequency control performance. • Frequency control performance is assessed by the North American Electric Reliability Corporation (NERC) in terms of three standards: • Control Performance Standard 1 (CPS1, used for assessing control of frequency, reflecting performance of regulation AS in compensating for supply-demand balance variations), • Control Performance Standard 2 (CPS2, used for assessing performance of multiple balancing areas in an interconnection; not relevant to ERCOT single balancing area in ERCOT interconnection), • Disturbance Control Standard (DCS, used for assessing response to contingencies; not relevant for regulation AS). • CPS1 metric ranges up to 200%, with higher scores being better. 13
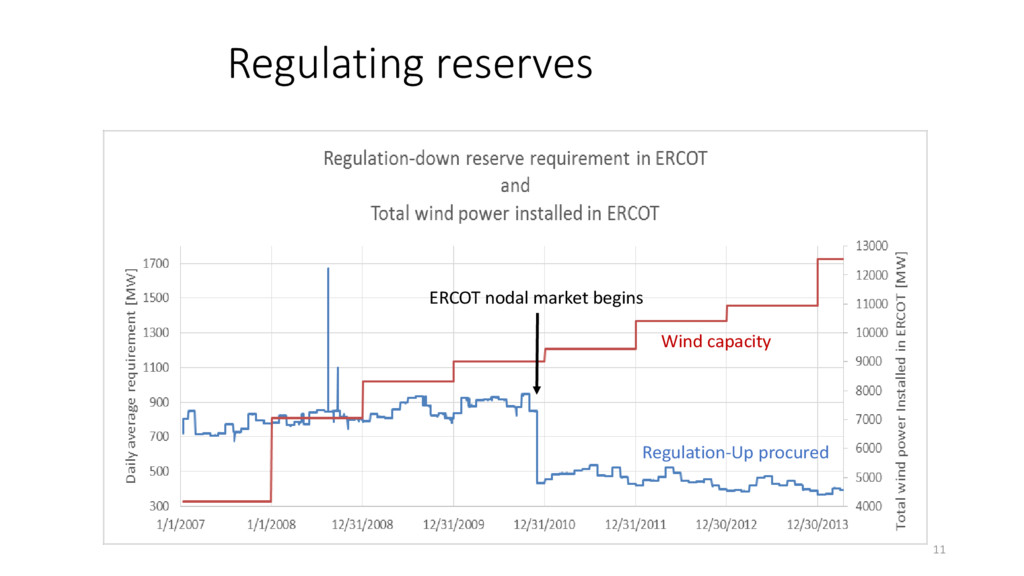
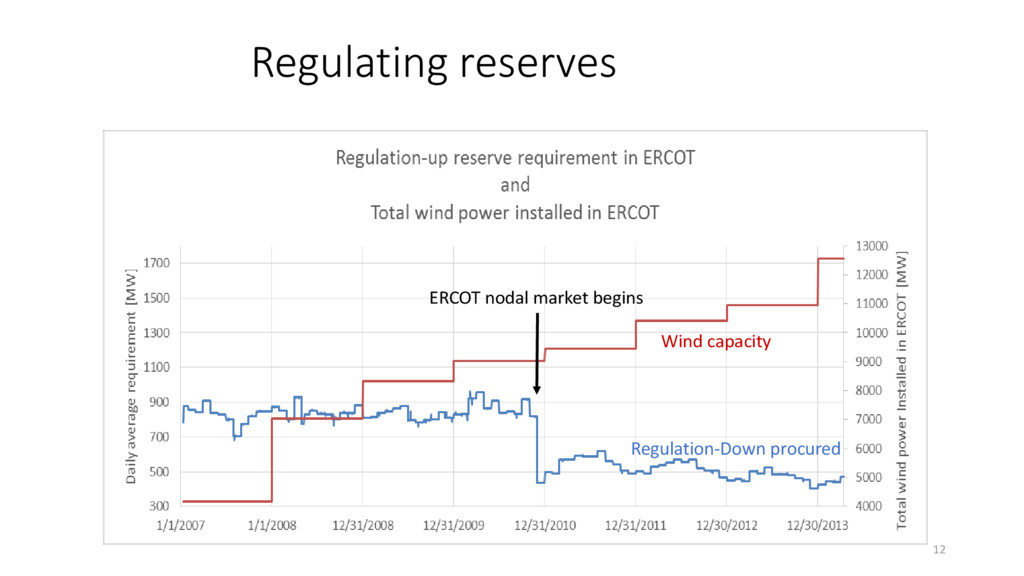
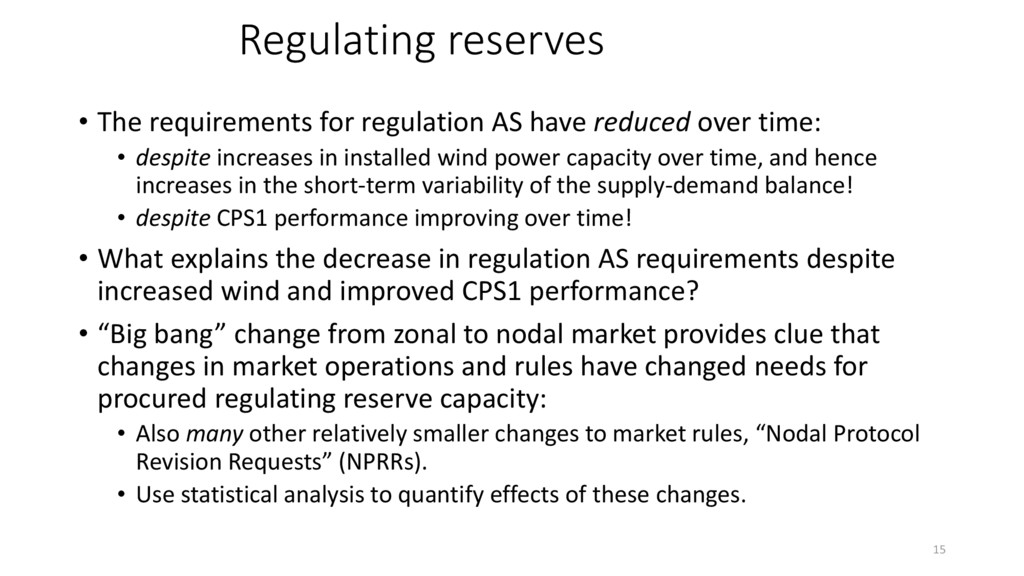
over time: • despite increases in installed wind power capacity over time, and hence increases in the short-term variability of the supply-demand balance! • despite CPS1 performance improving over time! • What explains the decrease in regulation AS requirements despite increased wind and improved CPS1 performance? • “Big bang” change from zonal to nodal market provides clue that changes in market operations and rules have changed needs for procured regulating reserve capacity: • Also many other relatively smaller changes to market rules, “Nodal Protocol Revision Requests” (NPRRs). • Use statistical analysis to quantify effects of these changes. 15
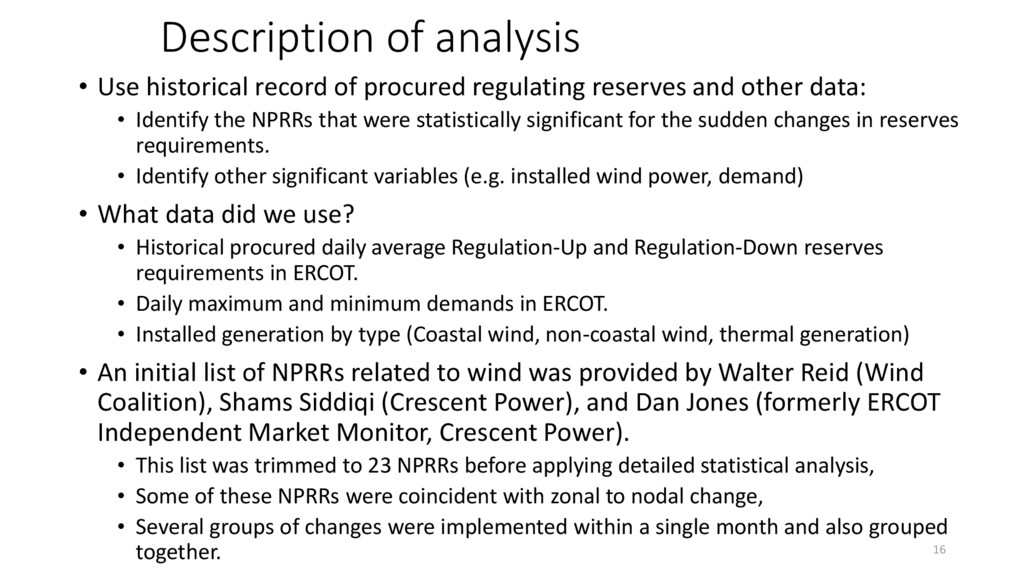
reserves and other data: • Identify the NPRRs that were statistically significant for the sudden changes in reserves requirements. • Identify other significant variables (e.g. installed wind power, demand) • What data did we use? • Historical procured daily average Regulation-Up and Regulation-Down reserves requirements in ERCOT. • Daily maximum and minimum demands in ERCOT. • Installed generation by type (Coastal wind, non-coastal wind, thermal generation) • An initial list of NPRRs related to wind was provided by Walter Reid (Wind Coalition), Shams Siddiqi (Crescent Power), and Dan Jones (formerly ERCOT Independent Market Monitor, Crescent Power). • This list was trimmed to 23 NPRRs before applying detailed statistical analysis, • Some of these NPRRs were coincident with zonal to nodal change, • Several groups of changes were implemented within a single month and also grouped together. 16
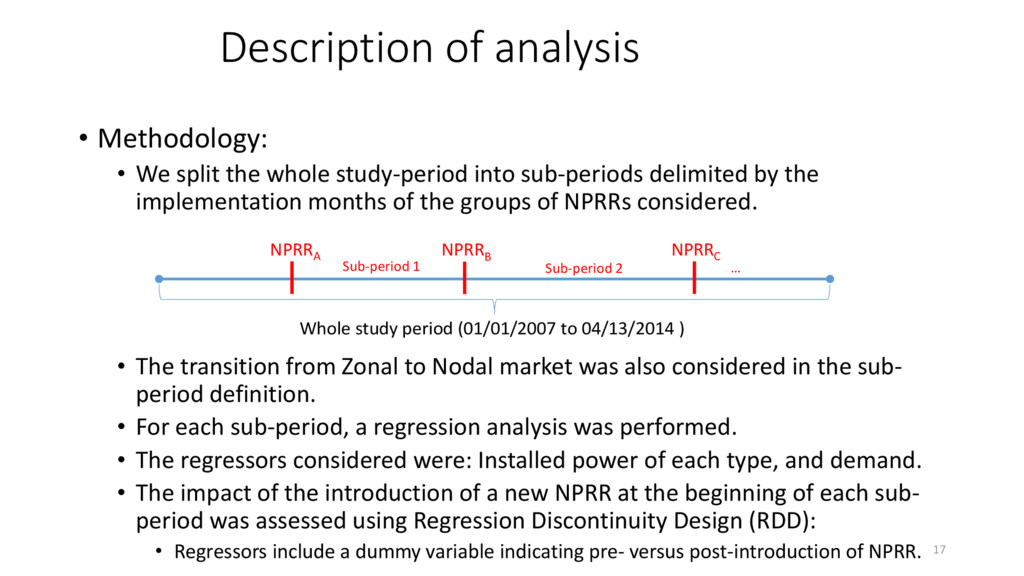
study-period into sub-periods delimited by the implementation months of the groups of NPRRs considered. • The transition from Zonal to Nodal market was also considered in the sub- period definition. • For each sub-period, a regression analysis was performed. • The regressors considered were: Installed power of each type, and demand. • The impact of the introduction of a new NPRR at the beginning of each sub- period was assessed using Regression Discontinuity Design (RDD): • Regressors include a dummy variable indicating pre- versus post-introduction of NPRR. Whole study period (01/01/2007 to 04/13/2014 ) NPRRA NPRRB NPRRC Sub-period 1 Sub-period 2 … 17
01/01/2007 to 04/13/2014: • Limited ability to predict outside this time-frame. • Cannot make strong statements about counter-factual scenarios such as: • What would be the impact if the “Competitive Renewable Energy Zone” (CREZ) transmission had not been developed? • What would be the impact of a massive solar development in Far West Texas? • Main focus is on regulation AS: • Future work includes analysis of responsive and non-spinning AS. 18
and Regulation-Down reserves and: • Daily minimum demand. • Daily maximum demand. • Installed wind power. • There are significant correlations with past procured reserves: • ERCOT uses the previous 30 days deployed reserves, in part, to determine the procured ones for the next month. • Procured and deployed reserves are strongly correlated. 19
a significant effect on the required amounts of regulating reserves: • NPRR 352: Improvements in prediction of the maximum sustained energy production of a wind resource after a period of curtailment. • NPRR 361: Requires submission of 5 minute resolution wind data for real-time purposes. • NPRR 460: Relaxes the wind generation resource ramp rate limitation from 10% per minute of nameplate rating to five minute average of 20% per minute of nameplate rating and with no individual minute exceeding 25%. 20
requirements associated with move from zonal to nodal market: • in zonal market the real-time dispatches were every 15 minutes, and in nodal market are every 5 minutes or more often; • unit specific dispatch in nodal allows for more precise control of generation; • co-optimization of energy and ancillary services has likely improved ability to utilize flexibility of generation. • Decreasing the dispatch interval from 15 to 5 minutes: • amount of procured regulation AS only needs to compensate for supply-demand variation and forecast error in a 5 minute time frame instead of a 15 minute time, • less operating reserves, specifically regulation AS, needed to cope with the smaller uncertainties between each dispatch update. • Advent of nodal market and NPRRs more than compensated for effect on regulation AS of increased net load uncertainty due to increased wind: • (Increase in 2012 by 500MW in responsive requirements & decrease by 500MW in non-spinning apparently associated with resource adequacy concerns and not directly associated with wind, but may be indirectly attributable to effect of wind.) • Further investigation necessary for responsive and non-spinning reserves. 21
reduced need for procured Regulation-Up and Regulation-Down despite increases in wind. • Effect of changes in rules is apparently as large as change of tens of GW of wind generation! • How much more wind can be integrated without needing, for example, large-scale storage? • Depends on interplay of ingenuity of market participants and fundamental physical requirements to match supply-demand balance with decreasing inertia contributed by thermal generation, • “It’s hard to make predictions, particularly about the future.” 22
over time in ERCOT despite increasing amounts of renewables and improved CPS1 scores. • Change from zonal to nodal market together with several NPRRs have resulted in better utilization of regulation AS capacity: • Reducing the total required regulation AS capacity, despite the greatly increasing amount of variable generation in system. • Future predictions of AS requirements are uncertain: • Increased renewables would tend to increase needs, but • Changes in rules and operational methods can utilize underlying AS capacity more effectively, and • Introduction of battery and other fast responding resources could further change needs for procured capacity. 23