Upgrade to Pro — share decks privately, control downloads, hide ads and more …

Know Thy Planet, Know Thy Starspot

gully
March 16, 2018

Know Thy Planet, Know Thy Starspot

Starspots confound exoplanet transit spectroscopy and a concept for mitigation.
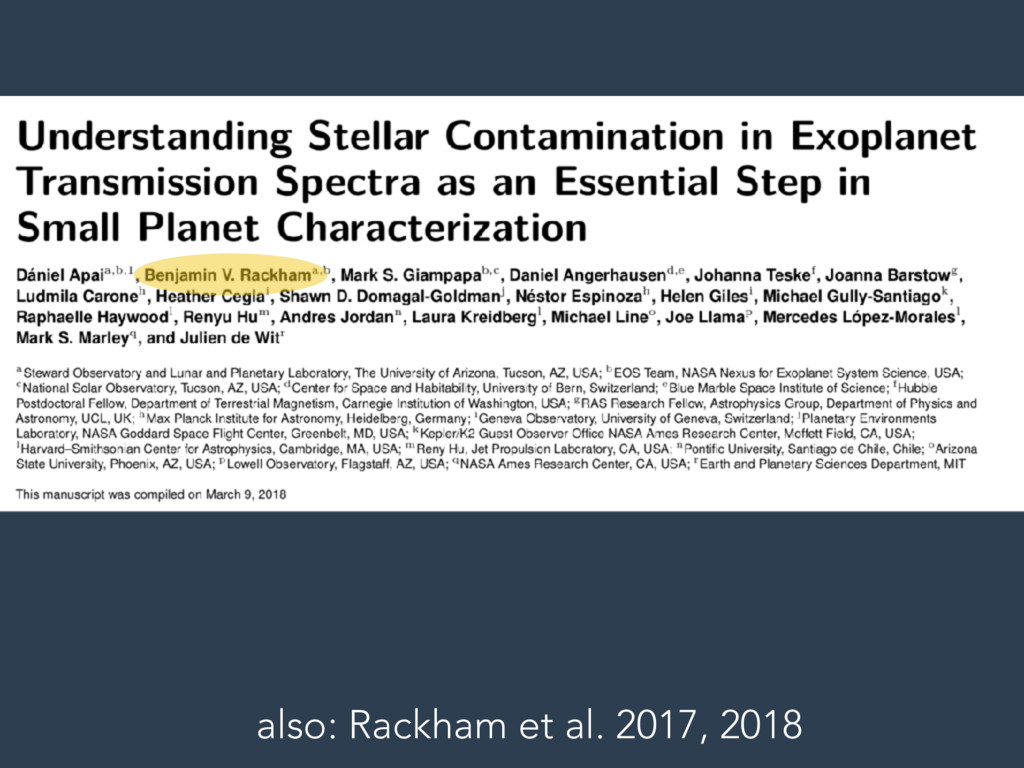
Includes content copied verbatim from white paper "Understanding Stellar Contamination in Exoplanet
Transmission Spectra as an Essential Step in
Small Planet Characterization" led by Daniel Apai, available at http://sites.nationalacademies.org/SSB/CurrentProjects/SSB_180659

gully

March 16, 2018
Tweet

More Decks by gully

Other Decks in Science

Transcript

  1. Starspots confound exoplanet transit spectroscopy, and a concept for mitigation

    Michael Gully-Santiago Kepler/K2 Guest Observer Office NASA Ames Research Center Bay Area Exoplanets Meeting March 2018
  2. Know thy planet, know thy starspots Michael Gully-Santiago Kepler/K2 Guest

    Observer Office NASA Ames Research Center Bay Area Exoplanets Meeting March 2018
  3. Star Planet Know thy planet, know thy star A conference

    in Pasadena last October. Starspots
  4. Starspots Star Planet Know thy planet, know thy star A

    conference in Pasadena last October. Know thy starspot, know thy star
  5. Starspots Star Planet Know thy planet, know thy star A

    conference in Pasadena last October. Know thy starspot, know thy star
  6. Starspots Star Planet Know thy planet, know thy star A

    conference in Pasadena last October. Know thy starspot, know thy star knowthystarspot.github.io
  7. Starspots Star Planet Know thy planet, know thy star A

    conference in Pasadena last October. Know thy starspot, know thy star A Splinter Session at #CoolStars20 in Boston Aug.2018
  8. Starspots Star Planet Know thy planet, know thy star A

    conference in Pasadena last October. Know thy starspot, know thy star A Splinter Session at #CoolStars20 in Boston Aug.2018 Know thy planet, know thy starspots This talk
  9. ⌦ = (R⇤/d)2 ⌦ = (R⇤/d)2 Solid angle (R⇤/d)2 stellar

    radius /d)2distance S emergent spectrum per solid angle f = ⌦ · S What spectrum do you measure when a planet transits your star? Out of transit:
  10. f = (⌦⇤ ⌦p) · S ⌦ = (R⇤/d)2 ⌦

    = (R⇤/d)2 Solid angle (R⇤/d)2 stellar radius /d)2distance S emergent spectrum per solid angle What spectrum do you measure when a planet transits your star? In transit: Rp
  11. ⌦ = (R⇤/d)2 What spectrum do you measure when a

    planet transits your star? Rp f ,out f ,in f ,out = ⌦⇤·S (⌦⇤ ⌦p)·S ⌦⇤·S
  12. ⌦ = (R⇤/d)2 What spectrum do you measure when a

    planet transits your star? Rp f ,out f ,in f ,out = ⌦p ⌦⇤ The fractional difference of flux in- and out- of transit is the ratio of areas. = Ap A⇤
  13. ⌦ = (R⇤/d)2 What spectrum do you measure when a

    planet transits your star? Rp If your planet has an atmosphere, you can measure the wavelength-dependent atmospheric transmission. = Ap( ) A⇤ = R2 p ( ) R2 ⇤
  14. What spectrum do you measure when a planet transits your

    ^star? Out of transit: spotted S ,spot Two distinct emission components: - ambient photosphere - starspot S ,amb f = ⌦amb · S ,amb + ⌦spot · S f = ⌦amb · S ,amb + ⌦spot · S ,amb f = ⌦amb · S ,amb + ⌦spot · S ,spot
  15. What spectrum do you measure when a planet transits your

    ^star? In transit: spotted S ,spot Assume: Planet occults ambient photosphere, misses the starspot S ,amb f = ⌦amb · S ,amb + ⌦spot · S f = ⌦amb · S ,amb + ⌦spot · S ,amb f = (⌦amb ⌦p) · S ,amb + ⌦spot · S ,spot ⌦p
  16. What spectrum do you measure when a planet transits your

    ^star? spotted S ,spot Assume: Planet occults ambient photosphere, misses the starspot S ,amb f = ⌦amb · S ,amb + ⌦spot · S f = ⌦amb · S ,amb + ⌦spot · S ,amb f ,out f ,in f ,out 6= ⌦p ⌦⇤ ! ⌦p
  17. What spectrum do you measure when a planet transits your

    ^star? spotted S ,spot Assume: Planet occults ambient photosphere, misses the starspot S ,amb f = ⌦amb · S ,amb + ⌦spot · S f = ⌦amb · S ,amb + ⌦spot · S ,amb ⌦p f ,out f ,in f ,out = ⌦p ⌦amb + ⌦spot S ,spot S ,amb
  18. What spectrum do you measure when a planet transits your

    ^star? spotted S ,spot Assume: Planet occults ambient photosphere, misses the starspot S ,amb f = ⌦amb · S ,amb + ⌦spot · S f = ⌦amb · S ,amb + ⌦spot · S ,amb ⌦p The planet transit spectrum cannot be trivially inverted without further assumptions about the starspot size and emergent spectrum.
  19. Pre-transit Stellar Disk is the Assumed Light Source Actual Light

    Source is the Chord Defined by the Planet’s Projection The Transit Light Source Effect Spectral Difference due to Different Spot/Faculae Contributions Contaminates Transit Spectrum Observed Transit Spectrum True Planetary Spectrum
  20. Simulation of TLSE with gray (featureless) spectra GJ1214-like photosphere assumptions,

    3.2% coverage fraction of spots Custom modifications to Starfish- Czekala et al. 2015, Gully-Santiago et al. 2017 (Å)
  21. Simulation of TLSE with gray (featureless) spectra Blocking the ambient

    photosphere blocks preferentially brighter flux, boosts fraction of starspot flux
  22. Simulation of TLSE with gray (featureless) spectra The boosted starspot

    signal mimics the spectrum of water in an exoplanet atmosphere.
  23. How large is a typical Transit Light Source Effect? Often

    larger than the planet signal itself. Rackham+ 2018
  24. 1.Assume that starspots are small enough to ignore. 2.Assume the

    starspot spectrum is similar to the ambient spectrum. 3.Constrain the starspot area and temperature. 4.Measure the starspot area and temperature. 5.Design a point-and-stare mission with multi-epoch in- and out- of transit spectroscopy; model spots through rotation period. 6.Adapt Doppler tomography methods? What can be done to mitigate the effect of starspots on the inferred exoplanet transit spectrum?
  25. Assume that starspots are small enough to ignore. f ,out

    f ,in f ,out = ⌦p ⌦amb + ⌦spot S ,spot S ,amb lim ⌦spot !0 f ,out f ,in f ,out = ⌦p ⌦⇤ What most folks do right now? How would you know the spots are small?
  26. If your answer is "Kepler/K2/HAT/TESS" amplitude is small... many geometric

    effects confound Amplitude --> fspot Rackham+ 2018
  27. Photometric amplitude If your answer is "Kepler/K2/HAT/TESS" amplitude is small...

    many geometric effects confound Amplitude --> fspot Rackham+ 2018
  28. Assume the starspot spectrum is similar to the ambient spectrum

    f ,out f ,in f ,out = ⌦p ⌦amb + ⌦spot S ,spot S ,amb f ,out f ,in f ,out = ⌦p ⌦⇤ Probably not justified based on expectations of starspot temperature contrasts. limS ,spot !S ,amb
  29. Constrain the starspot area and temperature. We don't know the

    typical coverage fraction of spots as a function of stellar (SpT / Age / evolutionary state / rotation). It seems like we should know this, but geometrical factors confound many measurement techniques. Most starspot detection methods underestimate spot coverage.
  30. How to measure starspot area and temperature: - Near-IR Interferometry

    (high fidelity, low scalability) Rottenbacher et al. 2016 - Zeeman Doppler Imaging (medium-high fidelity, low scalability) Donati et al. 2014 - Monochromatic lightcurve amplitudes (low fidelity, high scalability) Rebull et al. 2016ab, Douglas et al. 2017, #K2Clusters - Planet-transit spot modeling (medium fidelity, low scalability) Morris et al. 2017 - SED modeling (medium fidelity, medium scalability) Wolk and Walter 1996 - Lightcurve forward modeling (low fidelity, medium-low scalability) Notsu et al. 2013 - Polychromatic timeseries photometry (medium fidelity, high scalability) Grankin 1995, Grankin et al. 2007 - 2-component spectral modeling (medium fidelity, medium scalability) Neff, O'Neal, Saar 1995; Fang et al. 2016; Gully-Santiago et al. 2017 - 2-component time-resolved spectral modeling (high fidelity, low scalability) Gully-Santiago in progress w/ IGRINS, iSHELL - N-component spectral modeling, with N >2 (medium fidelity, low scalability) Not attempted AFAIK - Combinations of the above ( High fidelity, medium2 scalability) Gully-Santiago et al. 2017, this talk
  31. How to measure starspot area and temperature? - Near-IR Interferometry

    (high fidelity, low scalability) Rottenbacher et al. 2016 - Zeeman Doppler Imaging (medium-high fidelity, low scalability) Donati et al. 2014 - Monochromatic lightcurve amplitudes (low fidelity, high scalability) Rebull et al. 2016ab, Douglas et al. 2017, #K2Clusters - Planet-transit spot modeling (medium fidelity, low scalability) Morris et al. 2017 - SED modeling (medium-low fidelity, medium scalability) Wolk and Walter 1996 - Lightcurve forward modeling (low fidelity, medium-low scalability) Notsu et al. 2013 - Polychromatic timeseries photometry (medium fidelity, high scalability) Grankin 1995, Grankin et al. 2007 - 2-component spectral modeling (medium fidelity, medium scalability) Neff, O'Neal, Saar 1995; Fang et al. 2016; Gully-Santiago et al. 2017 - 2-component time-resolved spectral modeling (high fidelity, low scalability) Gully-Santiago in progress w/ IGRINS, iSHELL - N-component spectral modeling, with N >2 (medium fidelity, low scalability) Not attempted AFAIK - Combinations of the above ( High fidelity, medium2 scalability) Gully-Santiago et al. 2017, this talk
  32. Design a point-and-stare mission with multi-epoch in- and out- of

    transit spectroscopy; model spots through rotation period.
  33. Adapt Doppler tomography methods? In principle disparate velocity components can

    isolate the origin of the signal. Difficult in practice for slow rotators.
  34. Some level of stellar contamination should be expected for most,

    if not all stars. The stellar contamination can impact the spectral slope of the transmission spectrum (commonly used as a proxy of clouds and atmospheric particles) and may also introduce apparent atomic and molecular features The amplitude of the contamination is a complex function of the stellar heterogeneity and can range from negligible to levels that may overwhelm intrinsic planetary features. Summary
  35. Some level of stellar contamination should be expected for most,

    if not all stars. The stellar contamination can impact the spectral slope of the transmission spectrum (commonly used as a proxy of clouds and atmospheric particles) and may also introduce apparent atomic and molecular features The amplitude of the contamination is a complex function of the stellar heterogeneity and can range from negligible to levels that may overwhelm intrinsic planetary features. Summary
  36. Some level of stellar contamination should be expected for most,

    if not all stars. The stellar contamination can impact the spectral slope of the transmission spectrum (commonly used as a proxy of clouds and atmospheric particles) and may also introduce apparent atomic and molecular features The amplitude of the contamination is a complex function of the stellar heterogeneity and can range from negligible to levels that may overwhelm intrinsic planetary features. Summary
  37. Correction methods based on stellar variability (photometric or spectroscopic) only

    probe the non-axisymmetric component of the heterogeneity. These methods possibly/likely underestimate stellar stellar contamination by factors of ∼2-10. Stellar contamination is expected to change on timescales of the stellar rotation and the starspot evolution. For rapidly rotating stars (e.g., TRAPPIST-1) stellar contamination will likely change even during a single transit
 The current understanding of the spatial distribution of the temperature/spectra over stellar disks is insufficient to provide a robust basis for correction methods Summary
  38. Correction methods based on stellar variability (photometric or spectroscopic) only

    probe the non-axisymmetric component of the heterogeneity. These methods possibly/likely underestimate stellar stellar contamination by factors of ∼2-10. Stellar contamination is expected to change on timescales of the stellar rotation and the starspot evolution. For rapidly rotating stars (e.g., TRAPPIST-1) stellar contamination will likely change even during a single transit
 The current understanding of the spatial distribution of the temperature/spectra over stellar disks is insufficient to provide a robust basis for correction methods Summary
  39. Correction methods based on stellar variability (photometric or spectroscopic) only

    probe the non-axisymmetric component of the heterogeneity. These methods possibly/likely underestimate stellar stellar contamination by factors of ∼2-10. Stellar contamination is expected to change on timescales of the stellar rotation and the starspot evolution. For rapidly rotating stars (e.g., TRAPPIST-1) stellar contamination will likely change even during a single transit
 The current understanding of the spatial distribution of the temperature/spectra over stellar disks is insufficient to provide a robust basis for correction methods Summary
  40. K2 GO Cycle 6 Phase-2 proposals for C17, C18, C19

    due on April 19, 2018. Must use targets already selected in Phase-1 https://keplerscience.arc.nasa.gov/k2-approved-programs.html Also: accepting applications for year-long K2 interns on a rolling basis Advert