Upgrade to Pro — share decks privately, control downloads, hide ads and more …

The future of data analysis

The future of data analysis

Hadley Wickham

July 04, 2012
Tweet

More Decks by Hadley Wickham

Other Decks in Technology

Transcript

  1. Hadley Wickham Assistant Professor / Dobelman Family Junior Chair Department

    of Statistics / Rice University The future of data analysis July 2012 @ hadleyw ickham Monday, July 9, 12
  2. Hadley Wickham Assistant Professor / Dobelman Family Junior Chair Department

    of Statistics / Rice University The future of data analysis July 2012 @ hadleyw ickham near ^ Monday, July 9, 12
  3. Hadley Wickham Data Scientist in Residence Metamarkets July 2012 The

    future of data analysis @ hadleyw ickham near ^ Monday, July 9, 12
  4. Data analysis is the process by which data becomes understanding,

    knowledge and insight Data analysis is the process by which data becomes understanding, knowledge and insight Monday, July 9, 12
  5. Data analysis is the process by which data becomes understanding,

    knowledge and insight Data analysis is the process by which data becomes understanding, knowledge and insight Monday, July 9, 12
  6. # Load data and create smaller subsets tb <- read.csv("tb.csv")

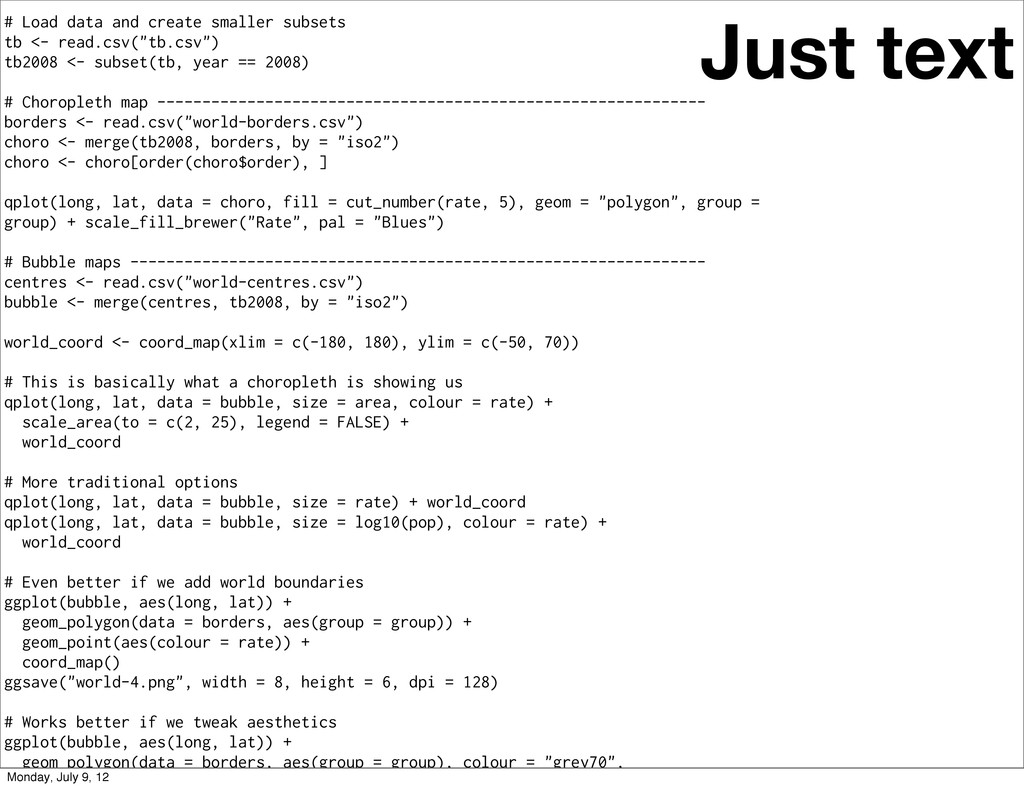
    tb2008 <- subset(tb, year == 2008) # Choropleth map ------------------------------------------------------------- borders <- read.csv("world-borders.csv") choro <- merge(tb2008, borders, by = "iso2") choro <- choro[order(choro$order), ] qplot(long, lat, data = choro, fill = cut_number(rate, 5), geom = "polygon", group = group) + scale_fill_brewer("Rate", pal = "Blues") # Bubble maps ---------------------------------------------------------------- centres <- read.csv("world-centres.csv") bubble <- merge(centres, tb2008, by = "iso2") world_coord <- coord_map(xlim = c(-180, 180), ylim = c(-50, 70)) # This is basically what a choropleth is showing us qplot(long, lat, data = bubble, size = area, colour = rate) + scale_area(to = c(2, 25), legend = FALSE) + world_coord # More traditional options qplot(long, lat, data = bubble, size = rate) + world_coord qplot(long, lat, data = bubble, size = log10(pop), colour = rate) + world_coord # Even better if we add world boundaries ggplot(bubble, aes(long, lat)) + geom_polygon(data = borders, aes(group = group)) + geom_point(aes(colour = rate)) + coord_map() ggsave("world-4.png", width = 8, height = 6, dpi = 128) # Works better if we tweak aesthetics ggplot(bubble, aes(long, lat)) + geom_polygon(data = borders, aes(group = group), colour = "grey70", fill = NA) + Just text Monday, July 9, 12
  7. R + js python data scientists + sql regex xpath

    data languages Monday, July 9, 12
  8. R + js python data scientists + C/C++ fortran scala

    tool builders + sql regex xpath data languages Monday, July 9, 12
  9. The future is already here – it’s just not evenly

    distributed. William Gibson Monday, July 9, 12
  10. More of this in the future • Human readable text

    formats • Programming data analysis with open source software • Git and github (for code and data) • Virtual machines (+ EC2) • Open web APIs (for paid services) Monday, July 9, 12
  11. Still to come • View source • Capture and recreate

    dependencies • Download data • Build virtual machine • Github integration: forking & pull requests Monday, July 9, 12
  12. Still to come • Synchronisation between presenter and audience •

    “Run this code” and environment synching Monday, July 9, 12
  13. ggplot2 + concise + data tools - static d3 +

    web + flexible - verbose Monday, July 9, 12
  14. ggplot2 + concise + data tools - static d3 +

    web + flexible - verbose ??? Monday, July 9, 12
  15. r2d3 • R DSL builds json (trivial serialisation of ggplot2

    call) • Rendered in browser with js + d3 • Websockets allow callbacks from browser to and computation engine (and vice versa) • Declare interaction with functional reactive programming • (If front-end api is right, should be possible to support multiple language backends) Supported by m etam arkets Monday, July 9, 12
  16. Hybrid computation In browser (js) Local compute (R, python, ...)

    Distributed compute The future is heterogeneous Monday, July 9, 12
  17. Reproducible research/ Deployment = data analysis + software development. Better

    tools to capture all dependencies. Easy way of instantiating vm, either locally or on the cloud. Better debugging tools. Monday, July 9, 12
  18. Data analysis Hard to track progress and replay different branches

    of the analysis and ensure you've explored the space fully. Hard to swap out data/pieces of the analysis. How can we do better? Monday, July 9, 12
  19. Conclusion • Important to program data analysis (for frequent users)

    • We need better tools for sharing (incl. teaching), reproducible research, visualisation and introspection. • Most data analysis challenges are not purely statistical. Monday, July 9, 12