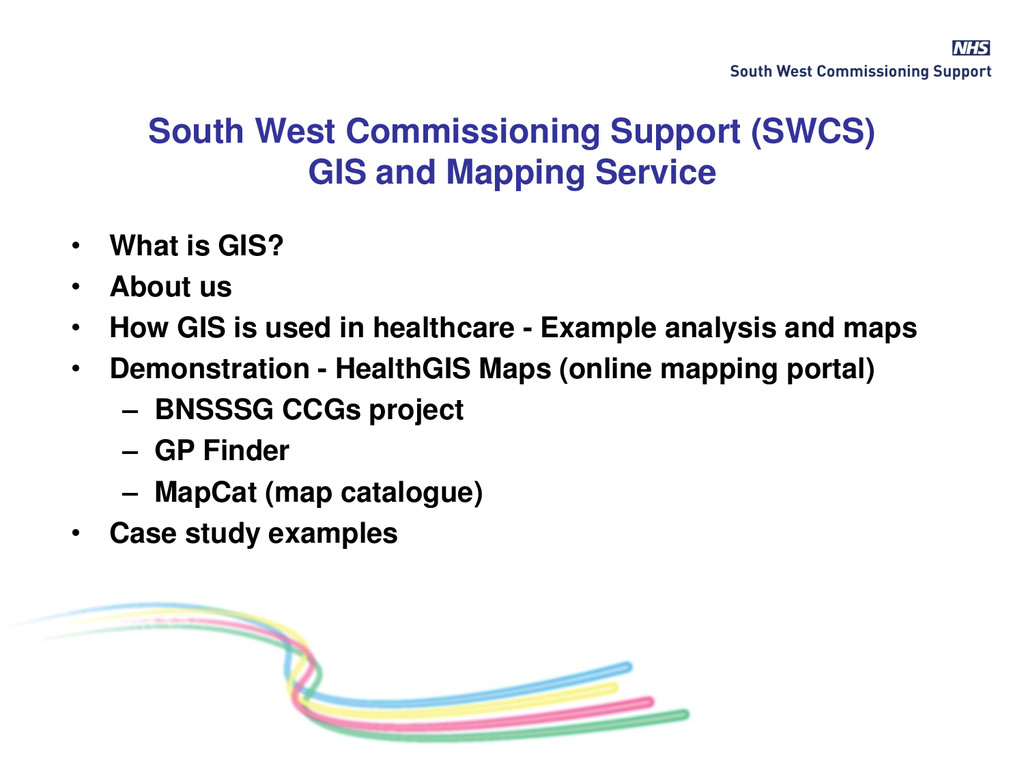
What is GIS? • About us • How GIS is used in healthcare - Example analysis and maps • Demonstration - HealthGIS Maps (online mapping portal) – BNSSSG CCGs project – GP Finder – MapCat (map catalogue) • Case study examples
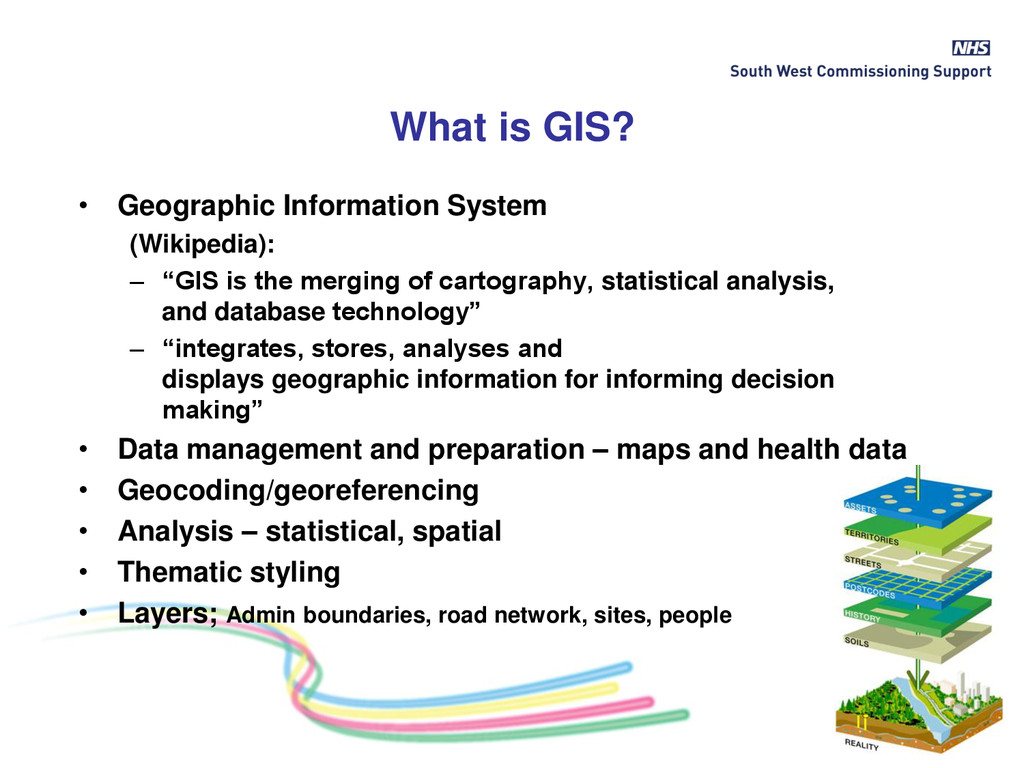
is the merging of cartography, statistical analysis, and database technology” – “integrates, stores, analyses and displays geographic information for informing decision making” • Data management and preparation – maps and health data • Geocoding/georeferencing • Analysis – statistical, spatial • Thematic styling • Layers; Admin boundaries, road network, sites, people
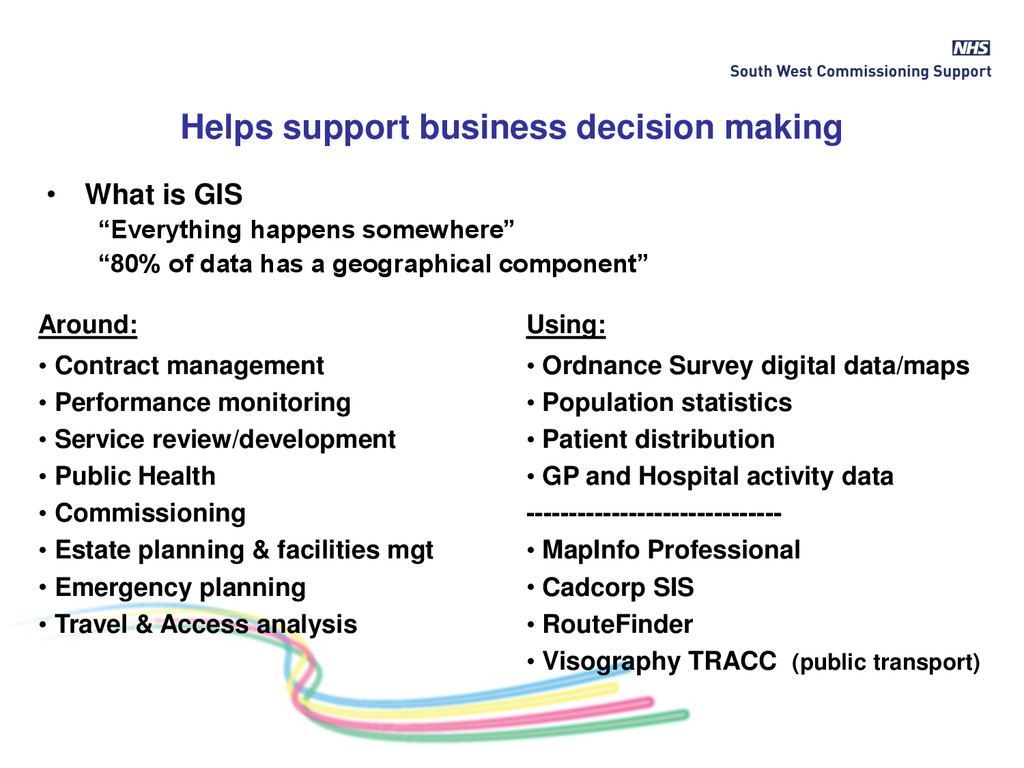
• Performance monitoring • Service review/development • Public Health • Commissioning • Estate planning & facilities mgt • Emergency planning • Travel & Access analysis • Ordnance Survey digital data/maps • Population statistics • Patient distribution • GP and Hospital activity data ------------------------------ • MapInfo Professional • Cadcorp SIS • RouteFinder • Visography TRACC (public transport) • What is GIS “Everything happens somewhere” “80% of data has a geographical component”
Consortium - moved to South West CSU in 2013 • Supporting Avon HA/PCTs/CCGs since 1995 • Ordnance Survey licensing - OpenData & PSMA (2010/11) • Growth in demand from wider NHS • Developed team of specialised GIS analysts/developers • Traditional GIS analysis and mapping • HealthGIS Maps (on-line mapping portal) • Licensed partner with Ordnance Survey (May 2014)
• Other Area Teams – East Anglia (Serco), Shropshire & Staffs • Strategic Clinical Network (SW) – formerly Avon, Som, Wilts + Peninsula, Dorset, 3 Counties (Glos) cancer networks • Public Health depts in Local Authorities – Avon, Wiltshire, Dorset • Community Health – Bristol, North Somerset, South Gloucestershire, Sirona Care & Health • PCC (Primary Care Commissioning) • NHS Property Services (BNSSSG) • Mental Health Trust (NW London) • Ad-hocs; Acute Trusts, BBC Children in Need, NHS Scotland Customers
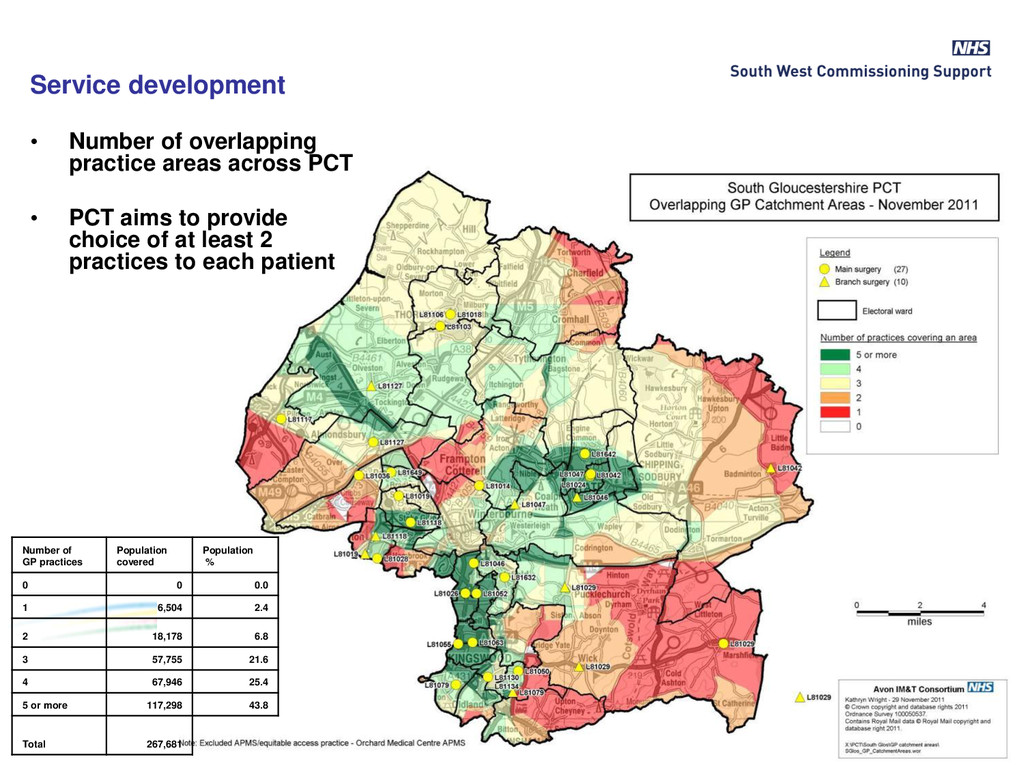
• PCT aims to provide choice of at least 2 practices to each patient Number of GP practices Population covered Population % 0 0 0.0 1 6,504 2.4 2 18,178 6.8 3 57,755 21.6 4 67,946 25.4 5 or more 117,298 43.8 Total 267,681
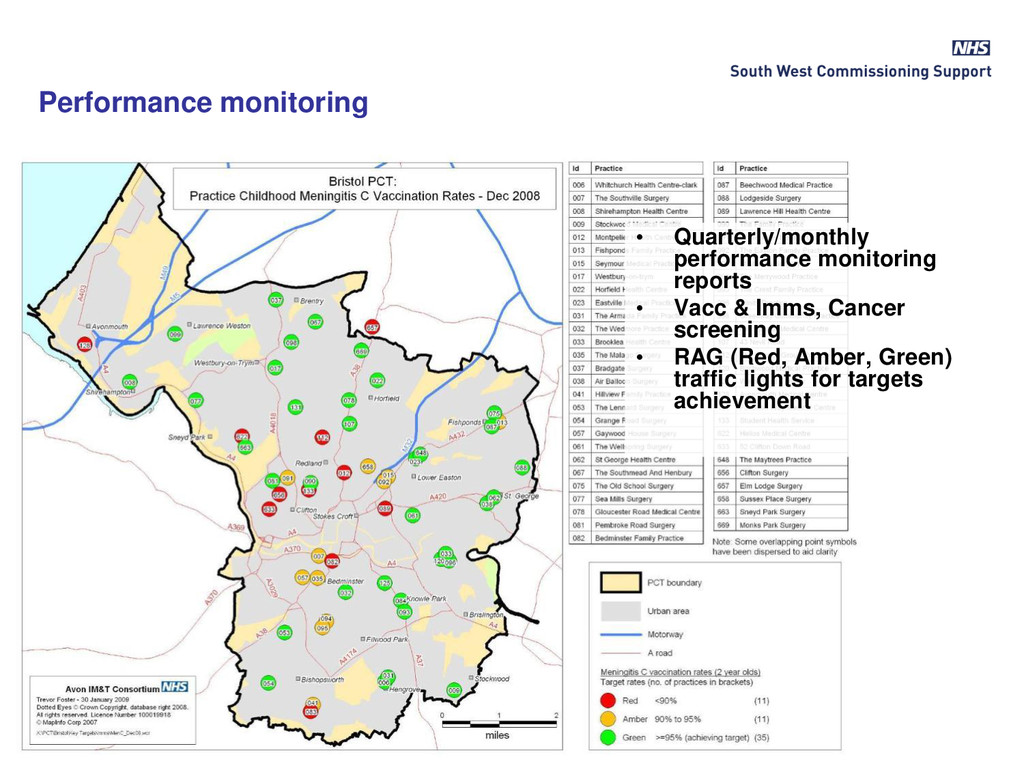
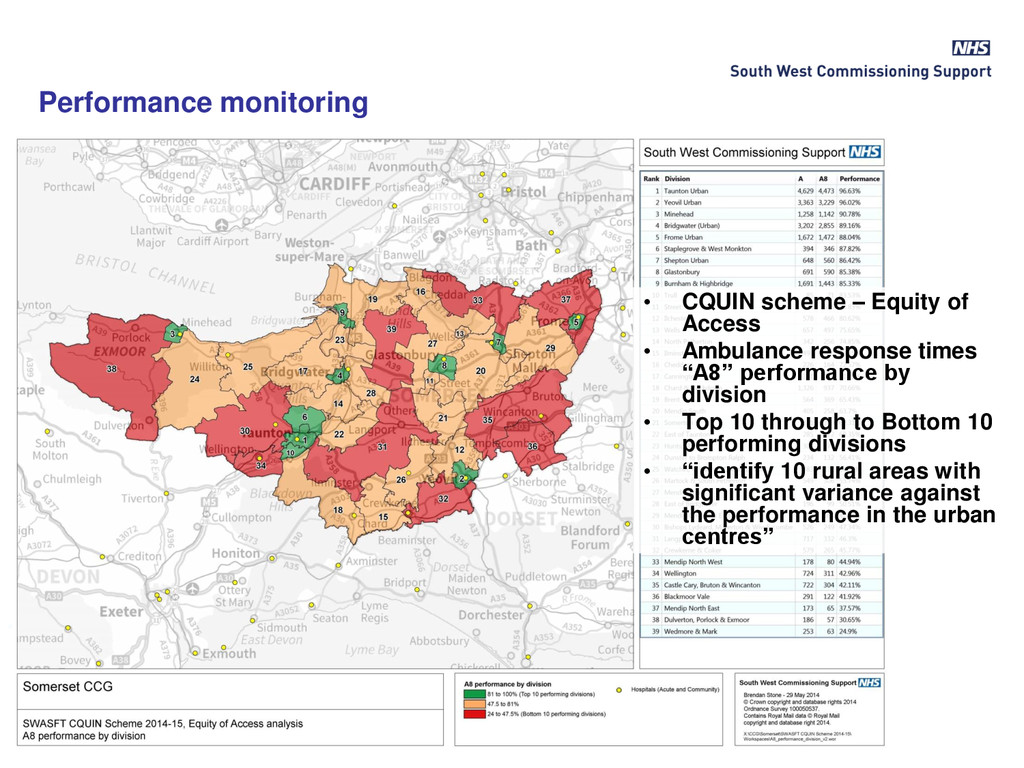
times “A8” performance by division • Top 10 through to Bottom 10 performing divisions • “identify 10 rural areas with significant variance against the performance in the urban centres” Performance monitoring
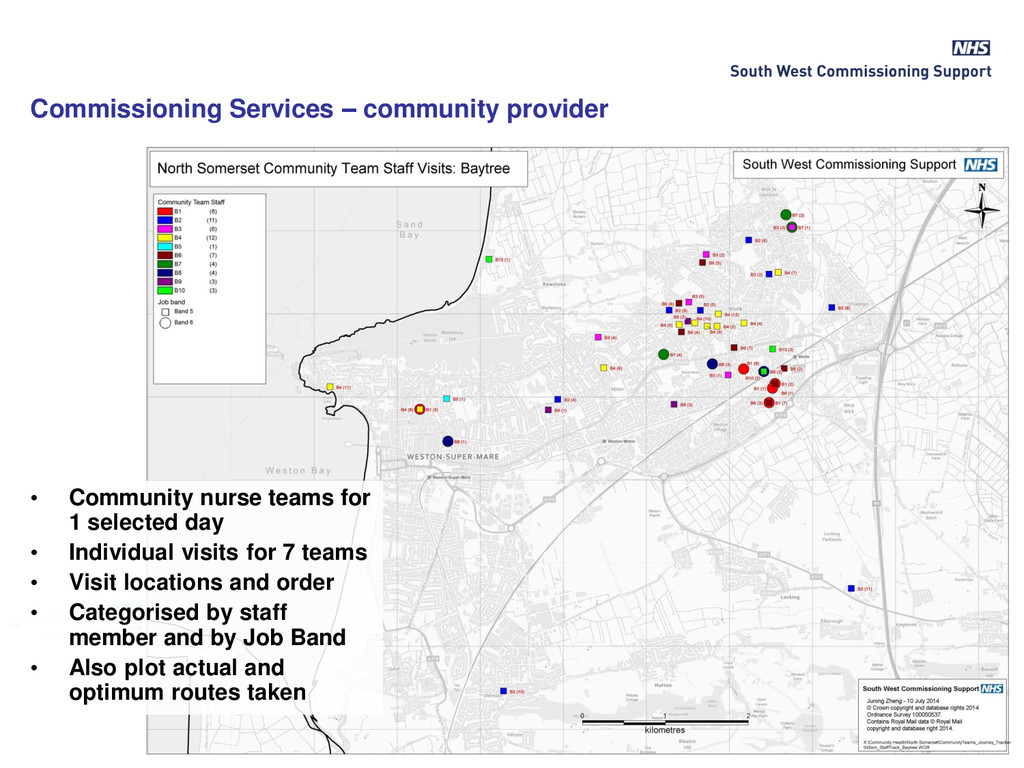
1 selected day • Individual visits for 7 teams • Visit locations and order • Categorised by staff member and by Job Band • Also plot actual and optimum routes taken
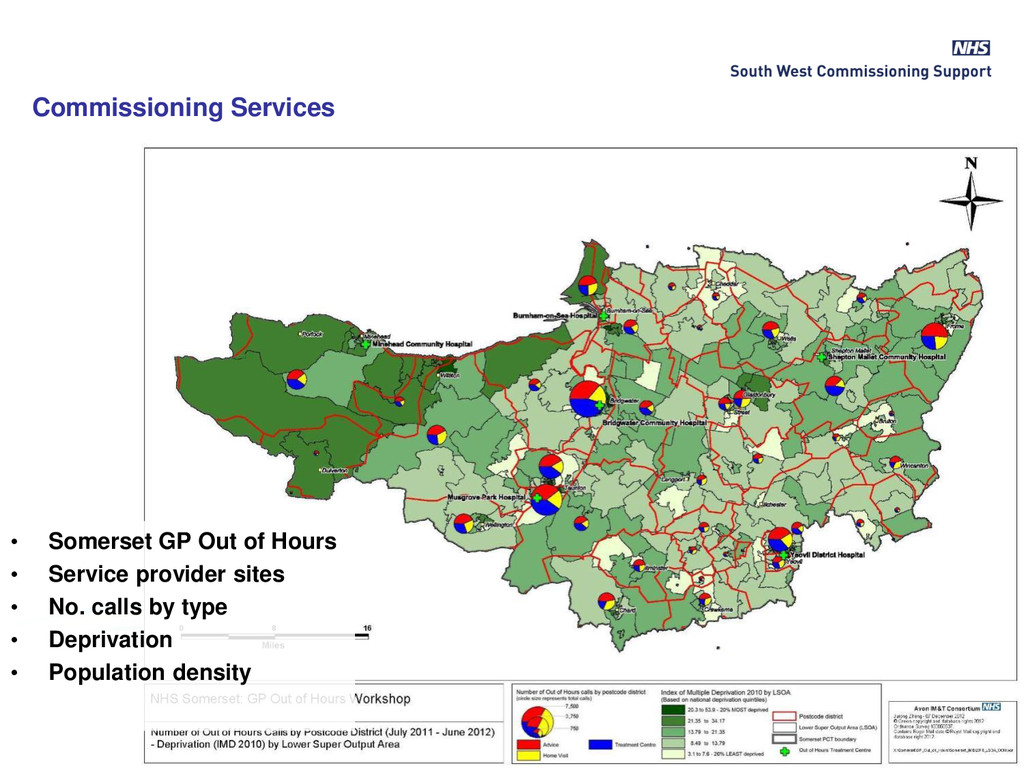
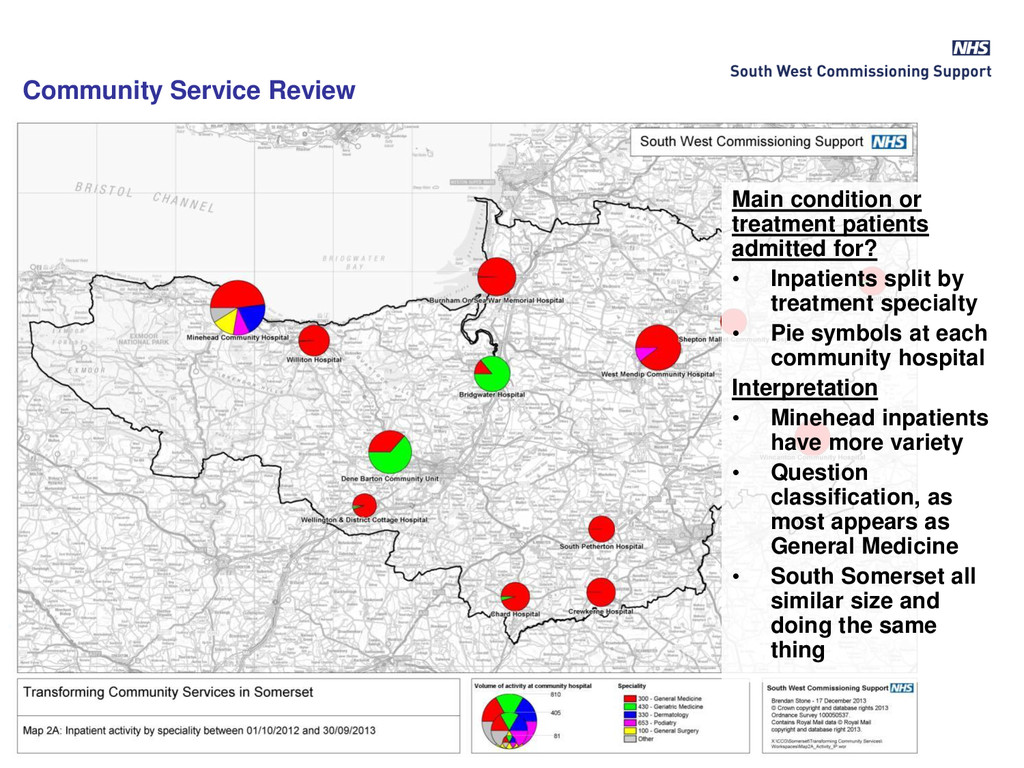
• Inpatients split by treatment specialty • Pie symbols at each community hospital Interpretation • Minehead inpatients have more variety • Question classification, as most appears as General Medicine • South Somerset all similar size and doing the same thing
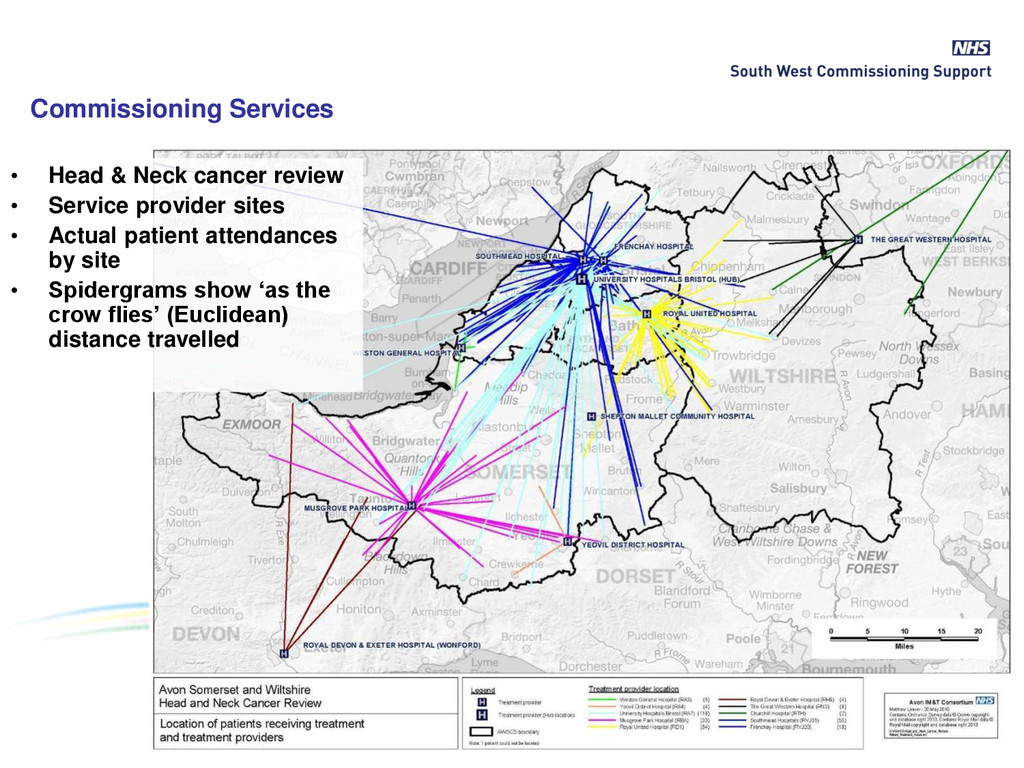
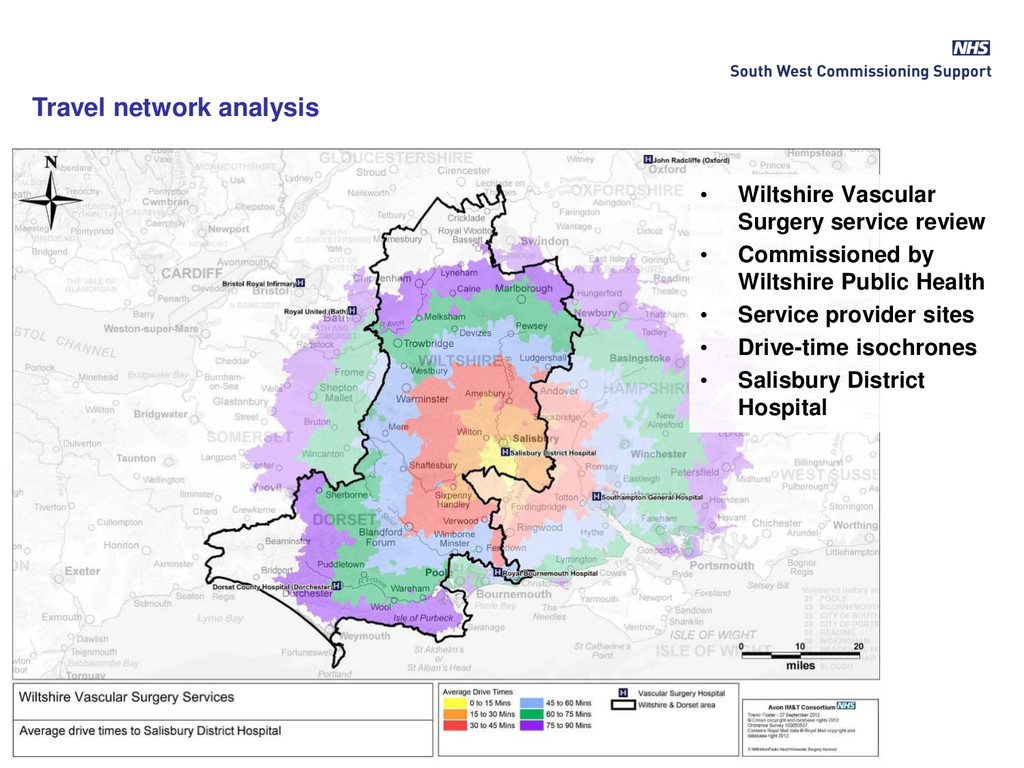
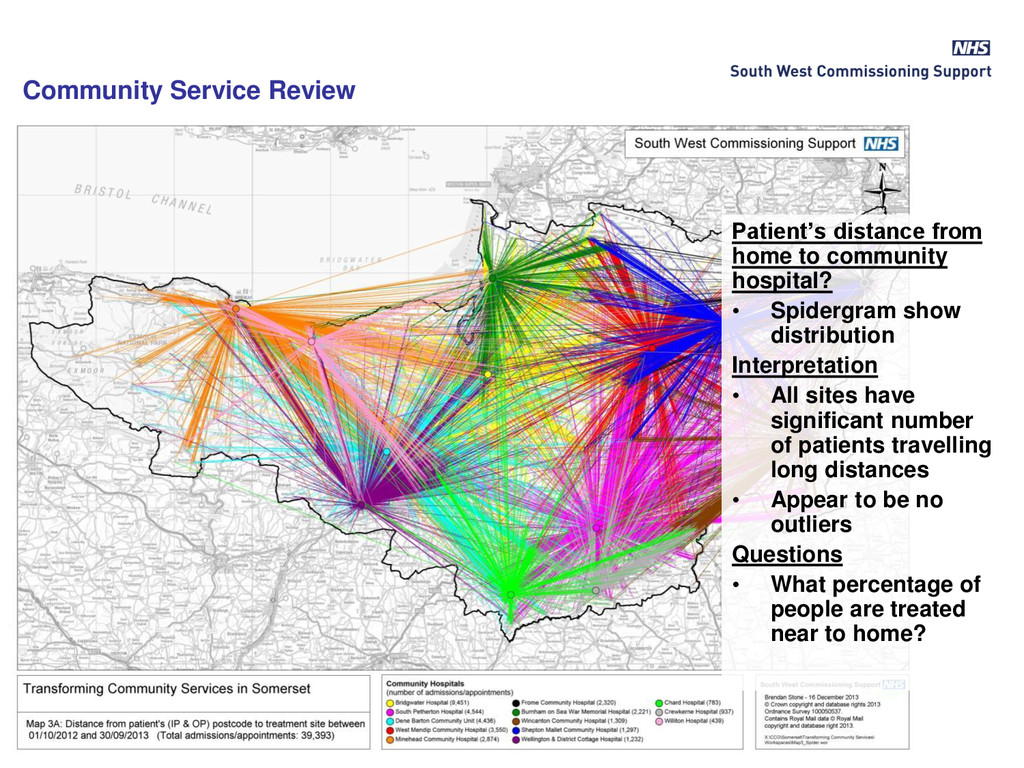
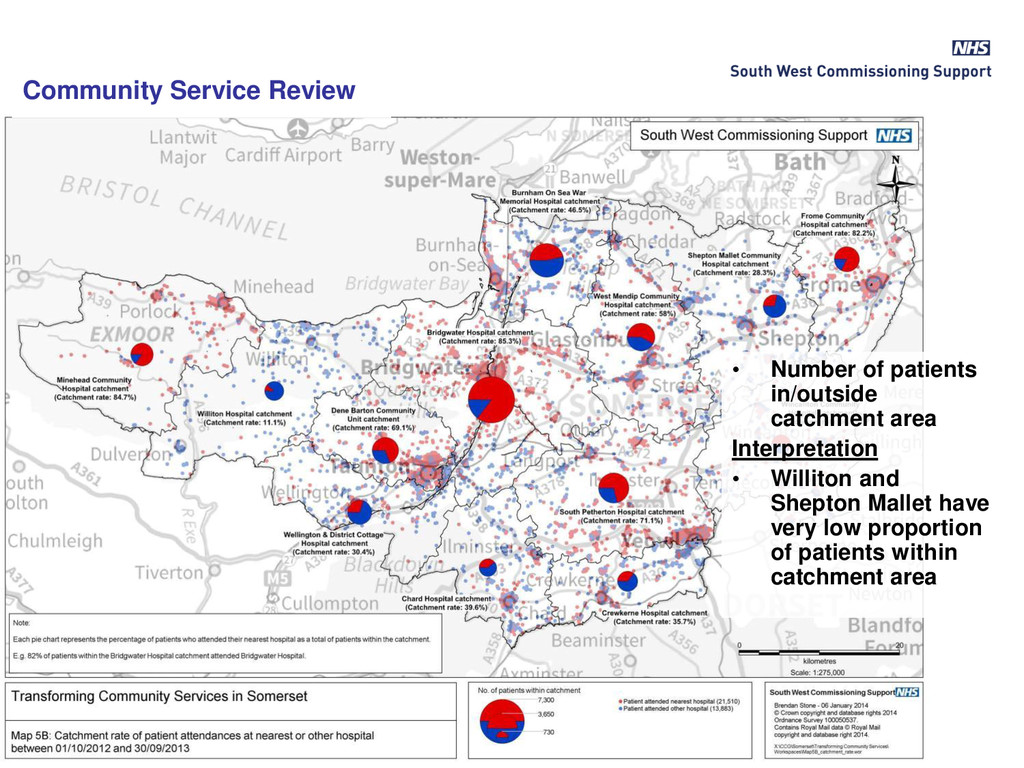
• Spidergram show distribution Interpretation • All sites have significant number of patients travelling long distances • Appear to be no outliers Questions • What percentage of people are treated near to home?
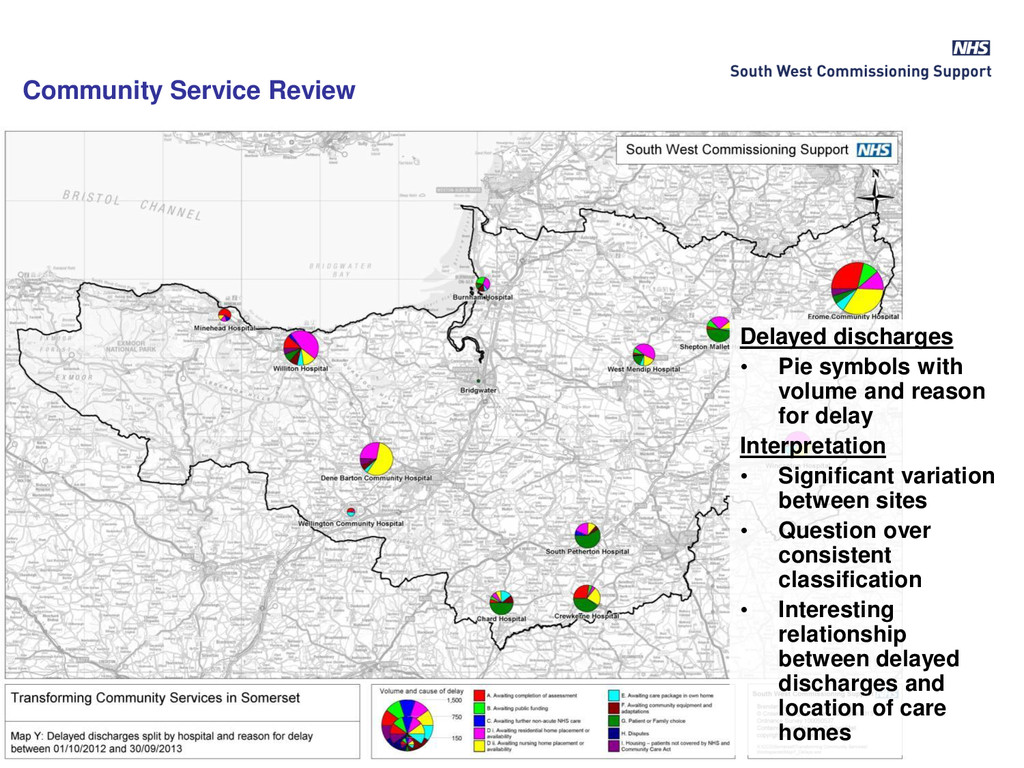
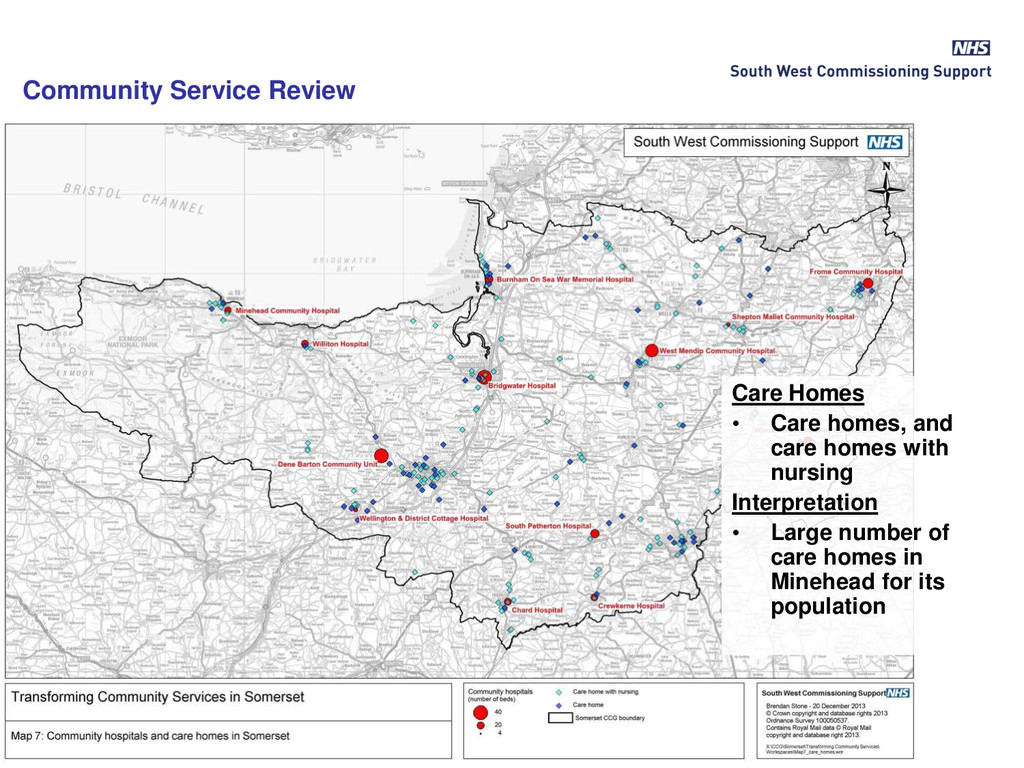
and reason for delay Interpretation • Significant variation between sites • Question over consistent classification • Interesting relationship between delayed discharges and location of care homes
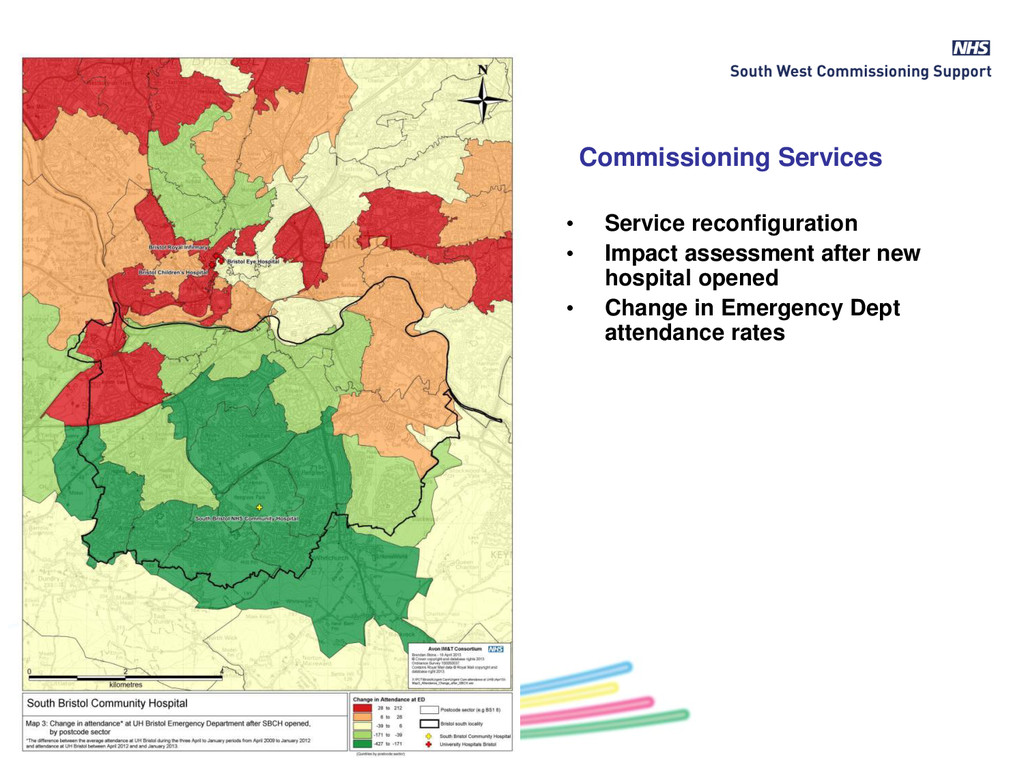
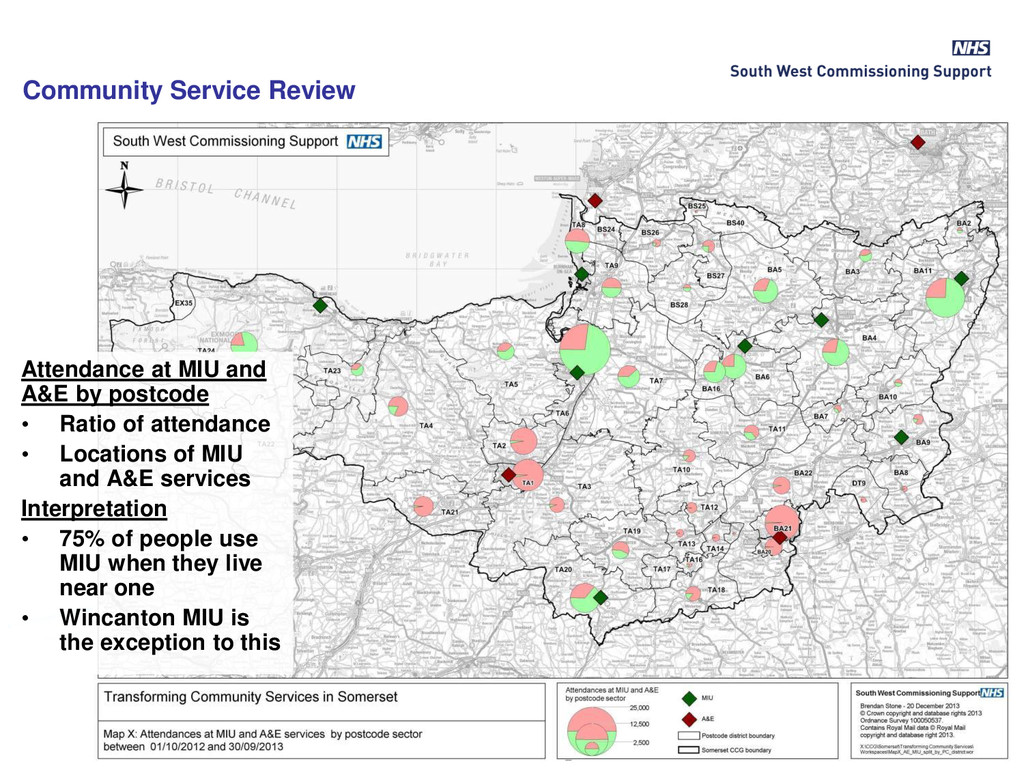
• Ratio of attendance • Locations of MIU and A&E services Interpretation • 75% of people use MIU when they live near one • Wincanton MIU is the exception to this
![• Further information? • Contact us at [email protected] or [email protected]](https://files.speakerdeck.com/presentations/6b6bc25f11a14114be155876444192d1/slide_30.jpg)