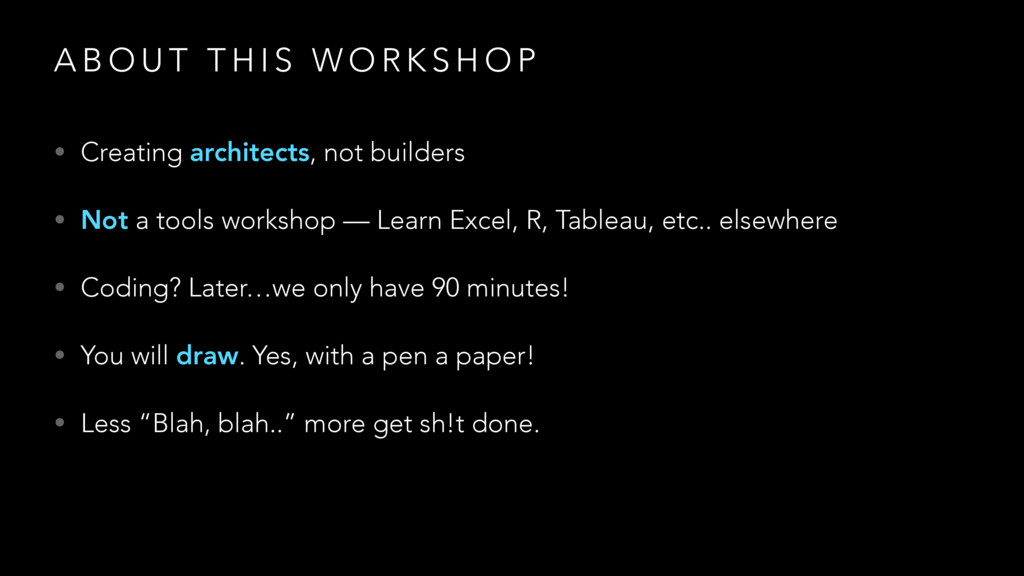
O R K S H O P • Creating architects, not builders • Not a tools workshop — Learn Excel, R, Tableau, etc.. elsewhere • Coding? Later…we only have 90 minutes! • You will draw. Yes, with a pen a paper! • Less “Blah, blah..” more get sh!t done.
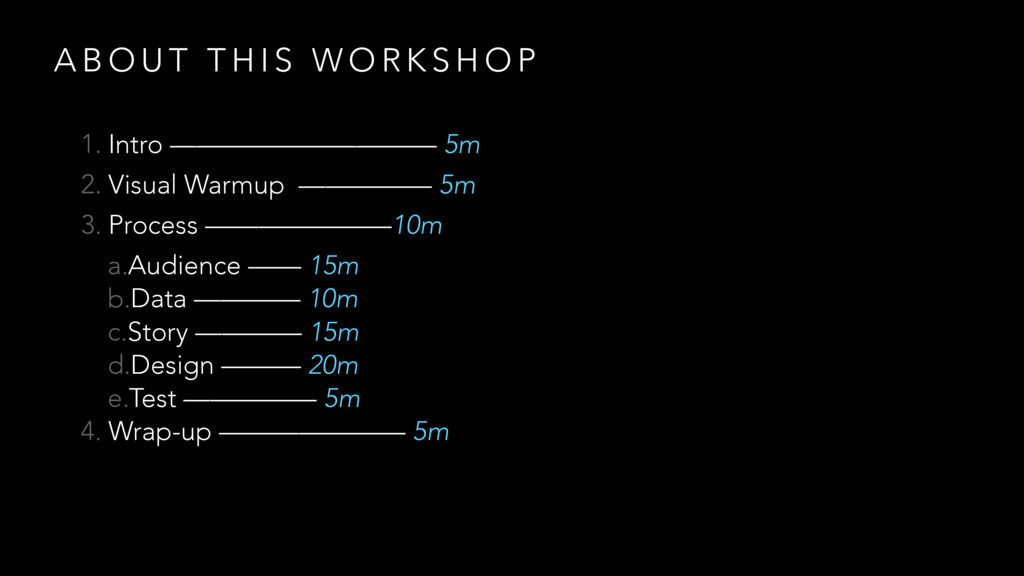
O R K S H O P 1. Intro —————————— 5m 2. Visual Warmup ————— 5m 3. Process ———————10m a.Audience —— 15m b.Data ———— 10m c.Story ———— 15m d.Design ——— 20m e.Test ————— 5m 4. Wrap-up ——————— 5m
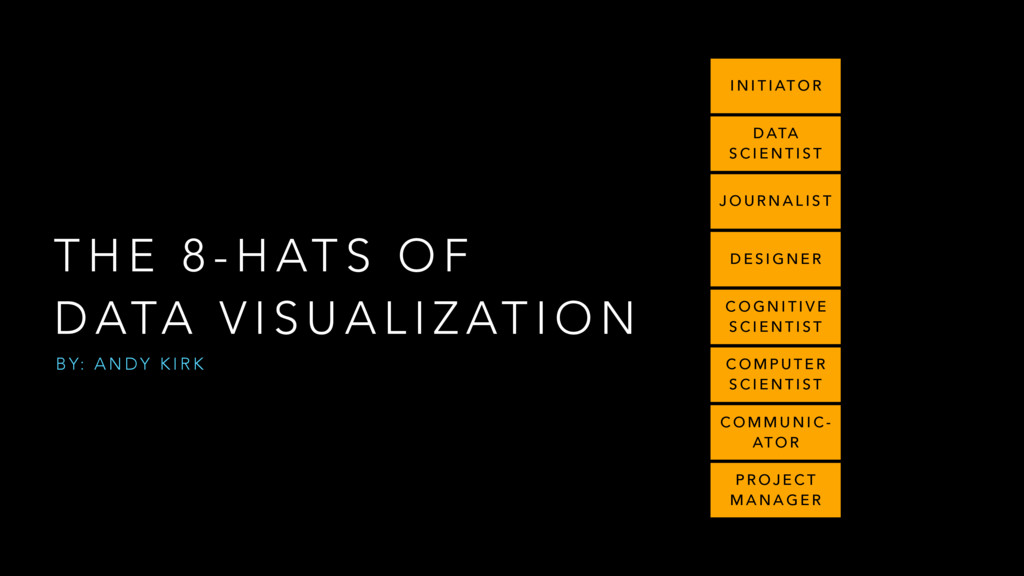
D ATA V I S U A L I Z AT I O N I N I T I AT O R D ATA S C I E N T I S T J O U R N A L I S T D E S I G N E R C O G N I T I V E S C I E N T I S T C O M P U T E R S C I E N T I S T C O M M U N I C - AT O R P R O J E C T M A N A G E R B Y: A N D Y K I R K
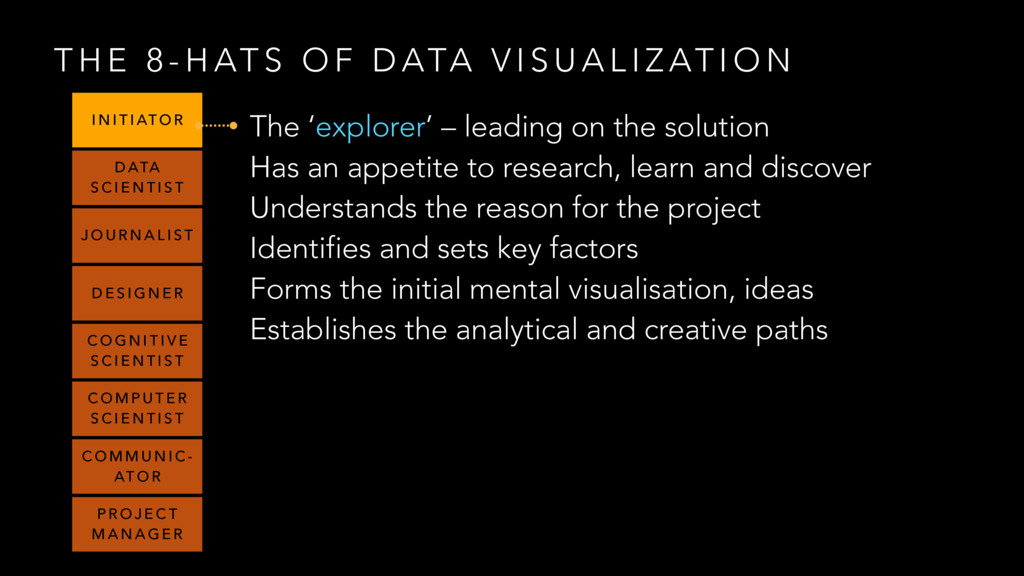
D ATA V I S U A L I Z AT I O N I N I T I AT O R D ATA S C I E N T I S T J O U R N A L I S T D E S I G N E R C O G N I T I V E S C I E N T I S T C O M P U T E R S C I E N T I S T C O M M U N I C - AT O R P R O J E C T M A N A G E R The ‘explorer’ – leading on the solution Has an appetite to research, learn and discover Understands the reason for the project Identifies and sets key factors Forms the initial mental visualisation, ideas Establishes the analytical and creative paths
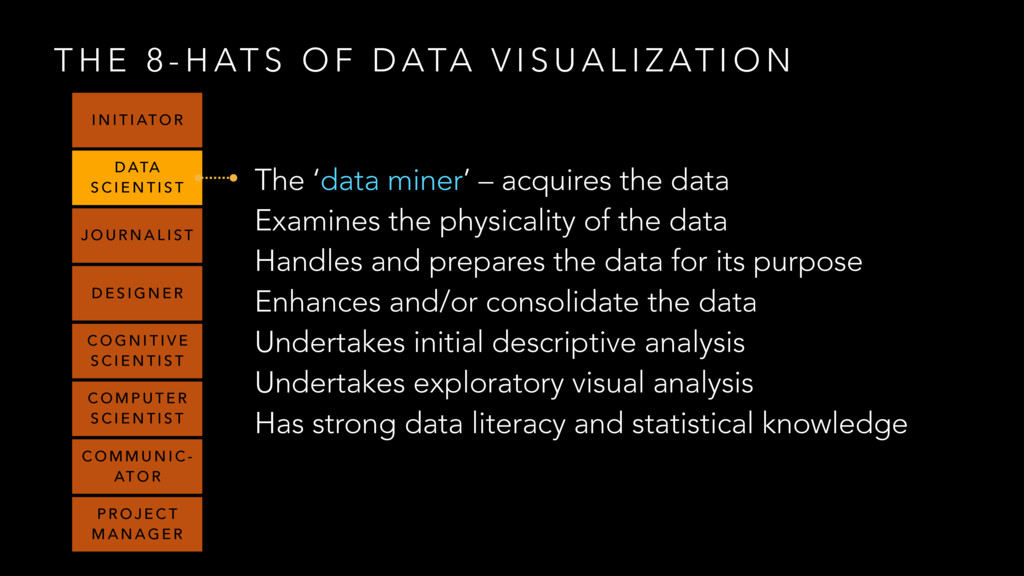
D ATA V I S U A L I Z AT I O N I N I T I AT O R D ATA S C I E N T I S T J O U R N A L I S T D E S I G N E R C O G N I T I V E S C I E N T I S T C O M P U T E R S C I E N T I S T C O M M U N I C - AT O R P R O J E C T M A N A G E R The ‘data miner’ – acquires the data Examines the physicality of the data Handles and prepares the data for its purpose Enhances and/or consolidate the data Undertakes initial descriptive analysis Undertakes exploratory visual analysis Has strong data literacy and statistical knowledge
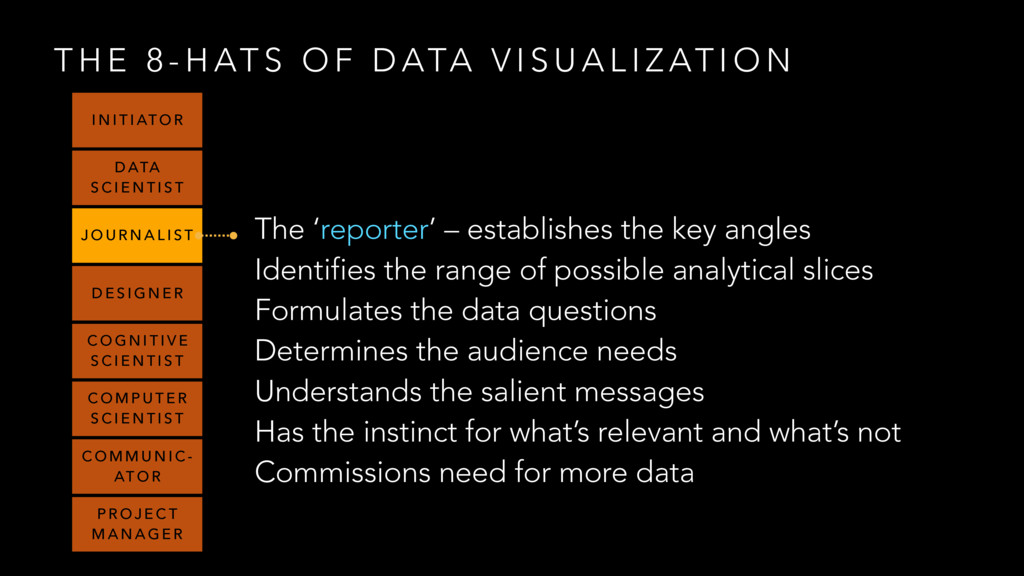
D ATA V I S U A L I Z AT I O N I N I T I AT O R D ATA S C I E N T I S T J O U R N A L I S T D E S I G N E R C O G N I T I V E S C I E N T I S T C O M P U T E R S C I E N T I S T C O M M U N I C - AT O R P R O J E C T M A N A G E R The ‘reporter’ – establishes the key angles Identifies the range of possible analytical slices Formulates the data questions Determines the audience needs Understands the salient messages Has the instinct for what’s relevant and what’s not Commissions need for more data
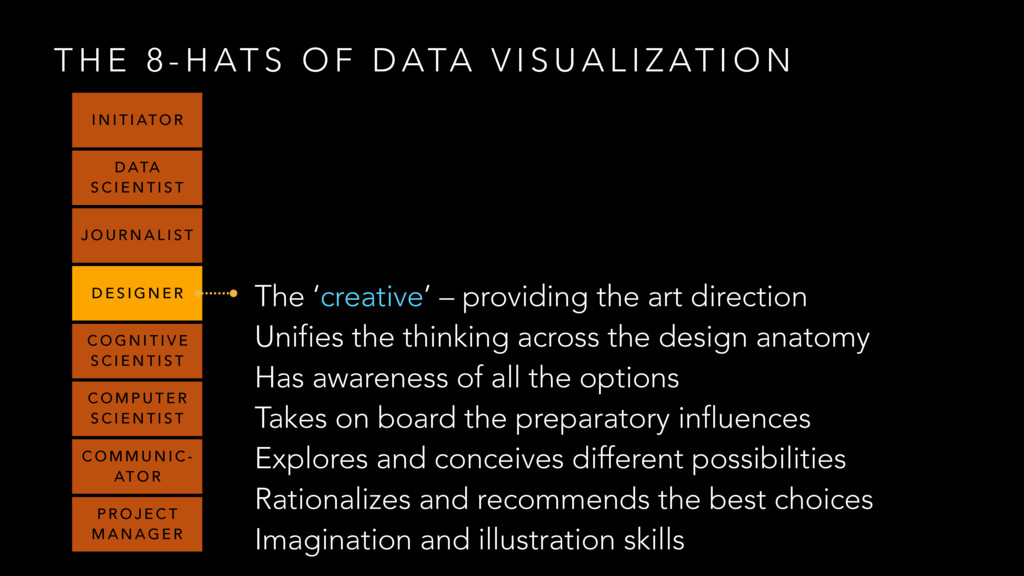
D ATA V I S U A L I Z AT I O N I N I T I AT O R D ATA S C I E N T I S T J O U R N A L I S T D E S I G N E R C O G N I T I V E S C I E N T I S T C O M P U T E R S C I E N T I S T C O M M U N I C - AT O R P R O J E C T M A N A G E R The ‘creative’ – providing the art direction Unifies the thinking across the design anatomy Has awareness of all the options Takes on board the preparatory influences Explores and conceives different possibilities Rationalizes and recommends the best choices Imagination and illustration skills
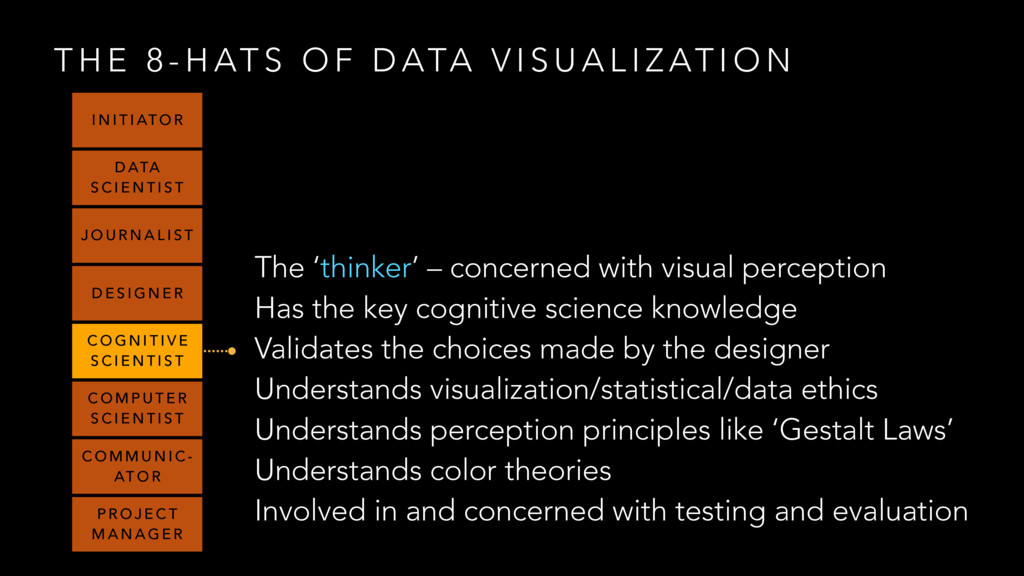
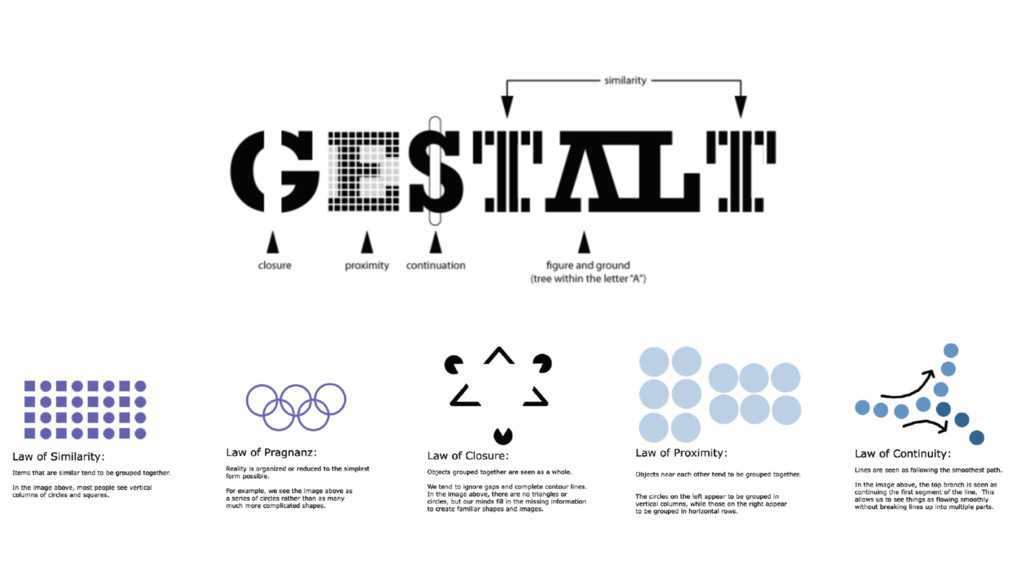
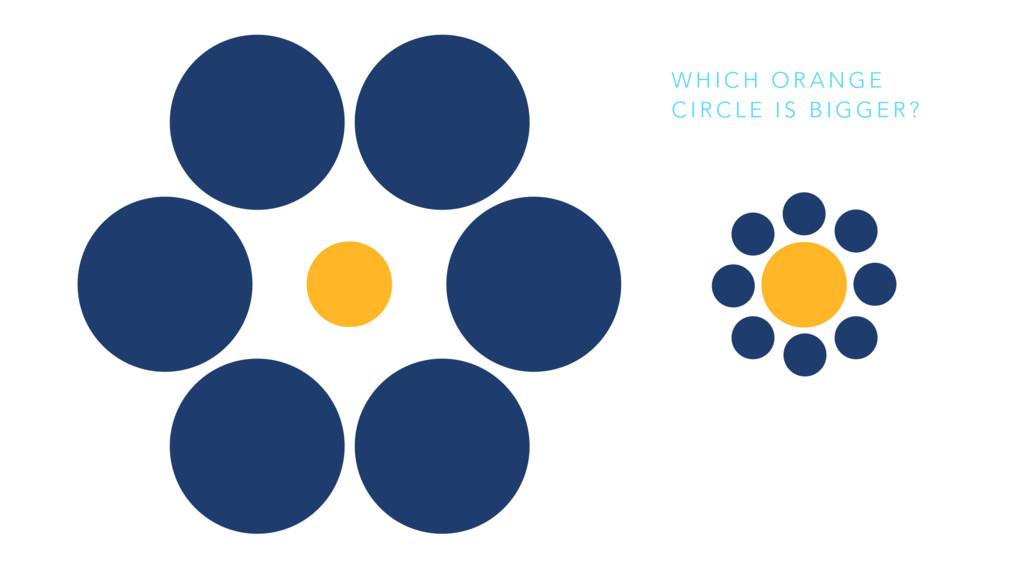
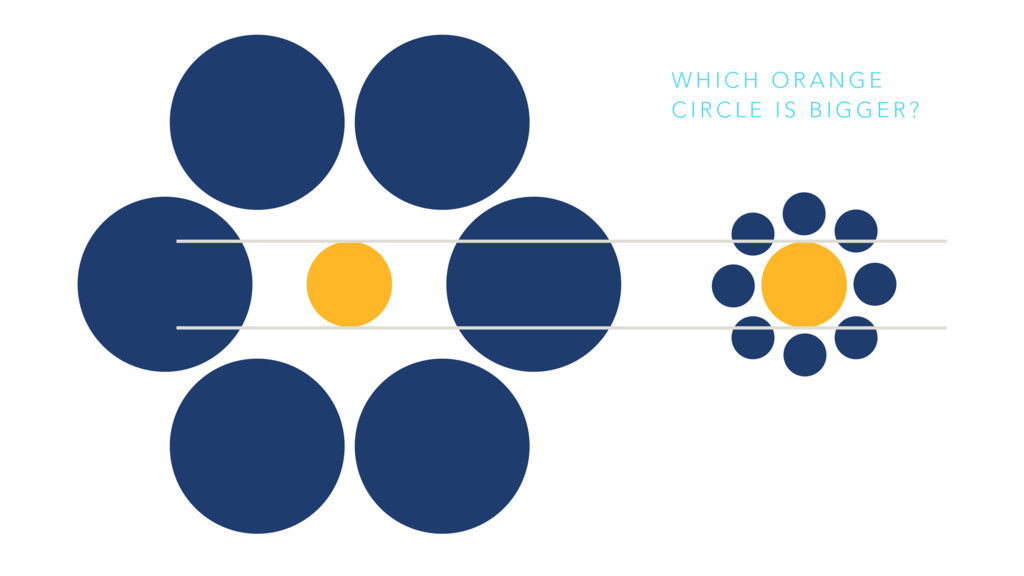
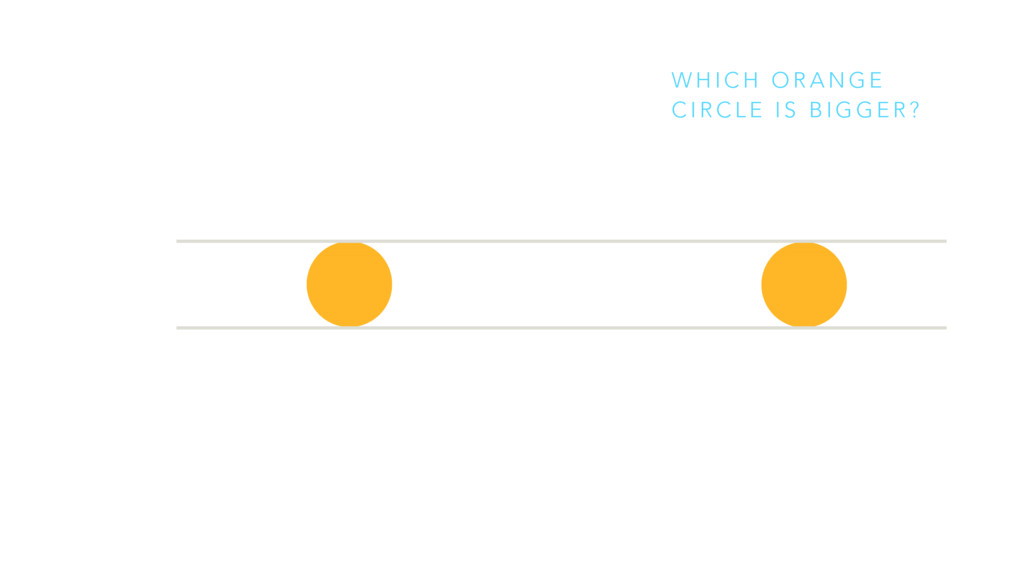
D ATA V I S U A L I Z AT I O N The ‘thinker’ – concerned with visual perception Has the key cognitive science knowledge Validates the choices made by the designer Understands visualization/statistical/data ethics Understands perception principles like ‘Gestalt Laws’ Understands color theories Involved in and concerned with testing and evaluation I N I T I AT O R D ATA S C I E N T I S T J O U R N A L I S T D E S I G N E R C O G N I T I V E S C I E N T I S T C O M P U T E R S C I E N T I S T C O M M U N I C - AT O R P R O J E C T M A N A G E R
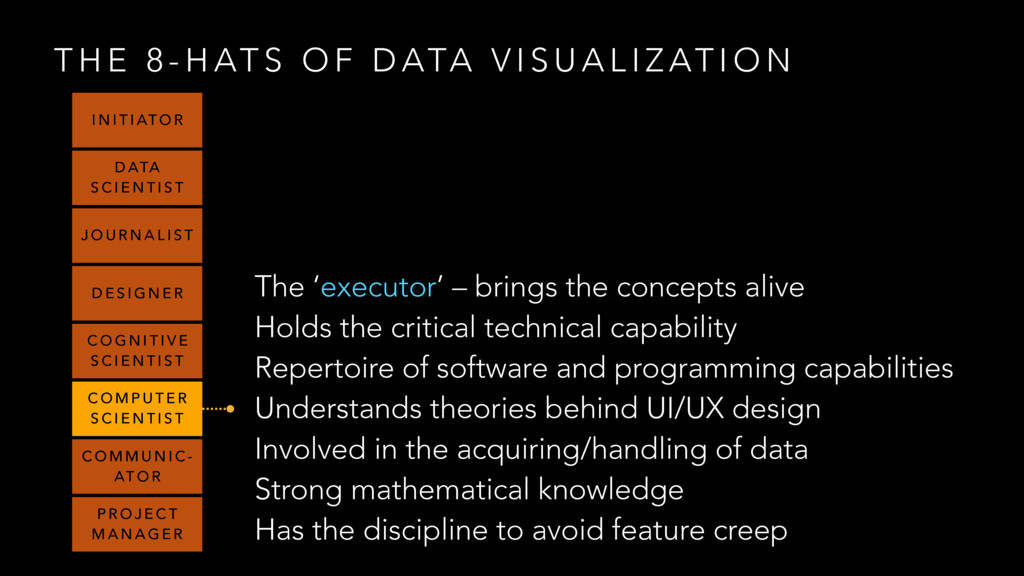
D ATA V I S U A L I Z AT I O N The ‘executor’ – brings the concepts alive Holds the critical technical capability Repertoire of software and programming capabilities Understands theories behind UI/UX design Involved in the acquiring/handling of data Strong mathematical knowledge Has the discipline to avoid feature creep I N I T I AT O R D ATA S C I E N T I S T J O U R N A L I S T D E S I G N E R C O G N I T I V E S C I E N T I S T C O M P U T E R S C I E N T I S T C O M M U N I C - AT O R P R O J E C T M A N A G E R
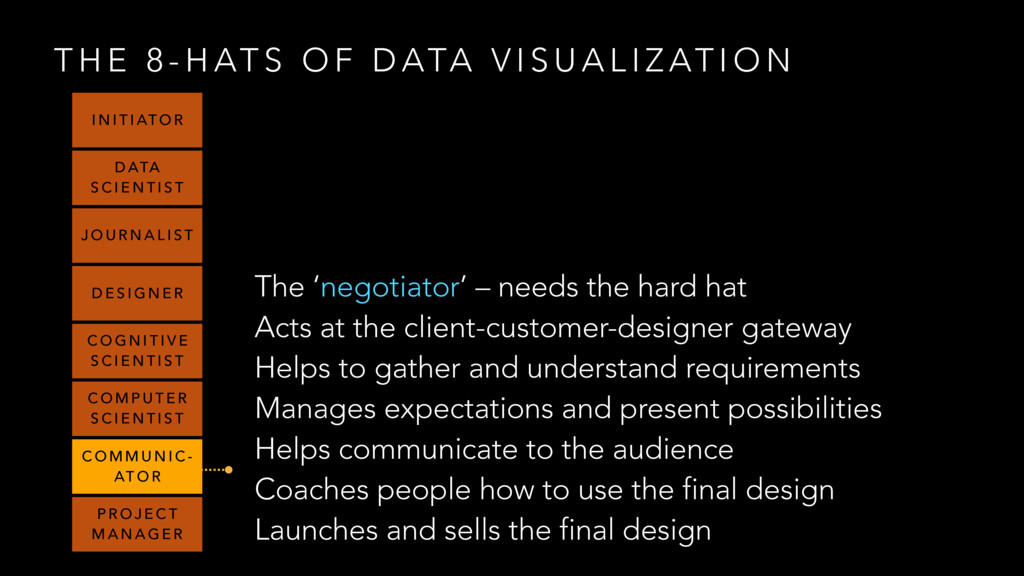
D ATA V I S U A L I Z AT I O N The ‘negotiator’ – needs the hard hat Acts at the client-customer-designer gateway Helps to gather and understand requirements Manages expectations and present possibilities Helps communicate to the audience Coaches people how to use the final design Launches and sells the final design I N I T I AT O R D ATA S C I E N T I S T J O U R N A L I S T D E S I G N E R C O G N I T I V E S C I E N T I S T C O M P U T E R S C I E N T I S T C O M M U N I C - AT O R P R O J E C T M A N A G E R
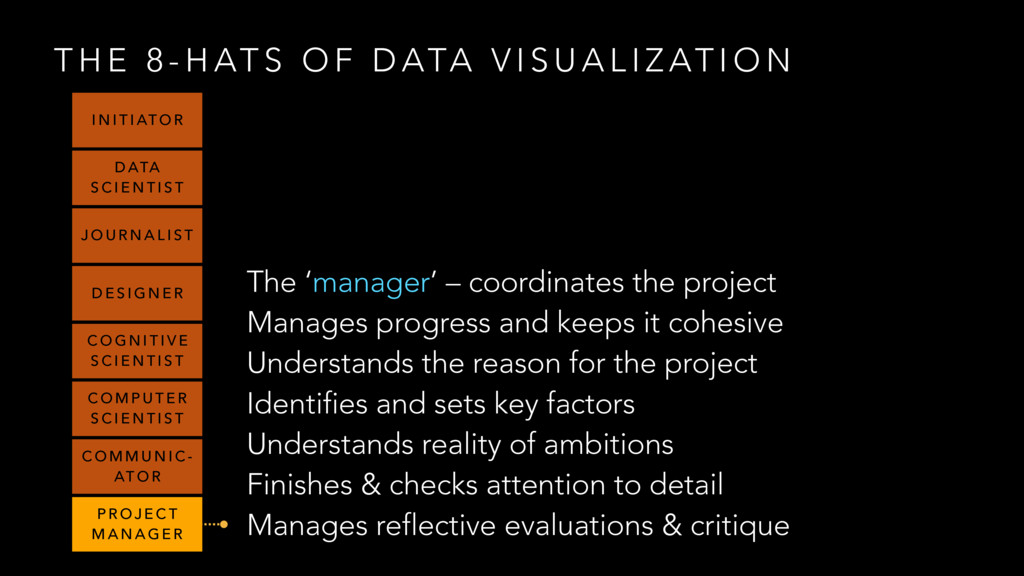
D ATA V I S U A L I Z AT I O N The ‘manager’ – coordinates the project Manages progress and keeps it cohesive Understands the reason for the project Identifies and sets key factors Understands reality of ambitions Finishes & checks attention to detail Manages reflective evaluations & critique I N I T I AT O R D ATA S C I E N T I S T J O U R N A L I S T D E S I G N E R C O G N I T I V E S C I E N T I S T C O M P U T E R S C I E N T I S T C O M M U N I C - AT O R P R O J E C T M A N A G E R
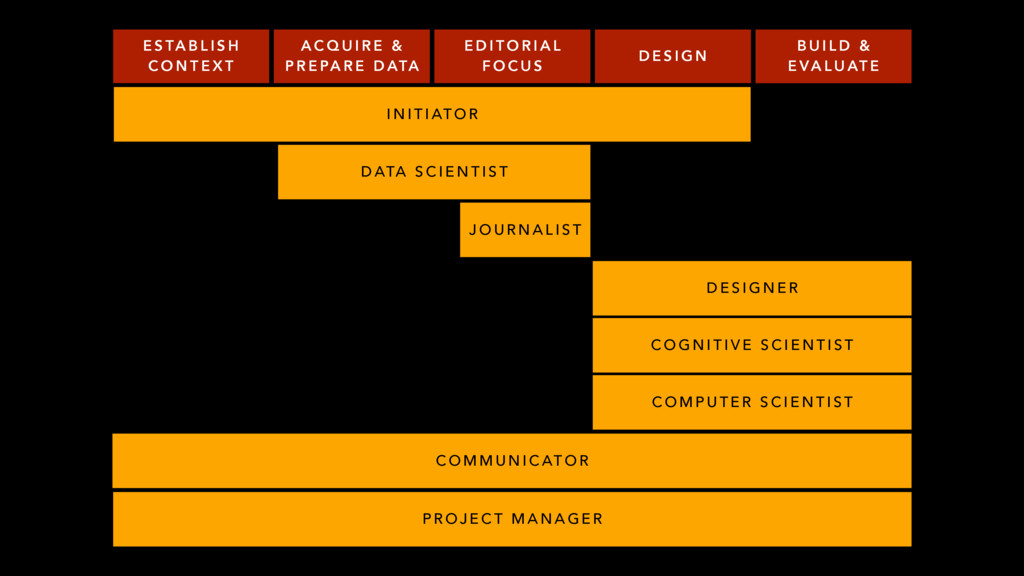
D E S I G N E R C O G N I T I V E S C I E N T I S T C O M P U T E R S C I E N T I S T C O M M U N I C AT O R P R O J E C T M A N A G E R E S TA B L I S H C O N T E X T A C Q U I R E & P R E PA R E D ATA E D I T O R I A L F O C U S D E S I G N B U I L D & E VA L U AT E I N I T I AT O R D ATA S C I E N T I S T
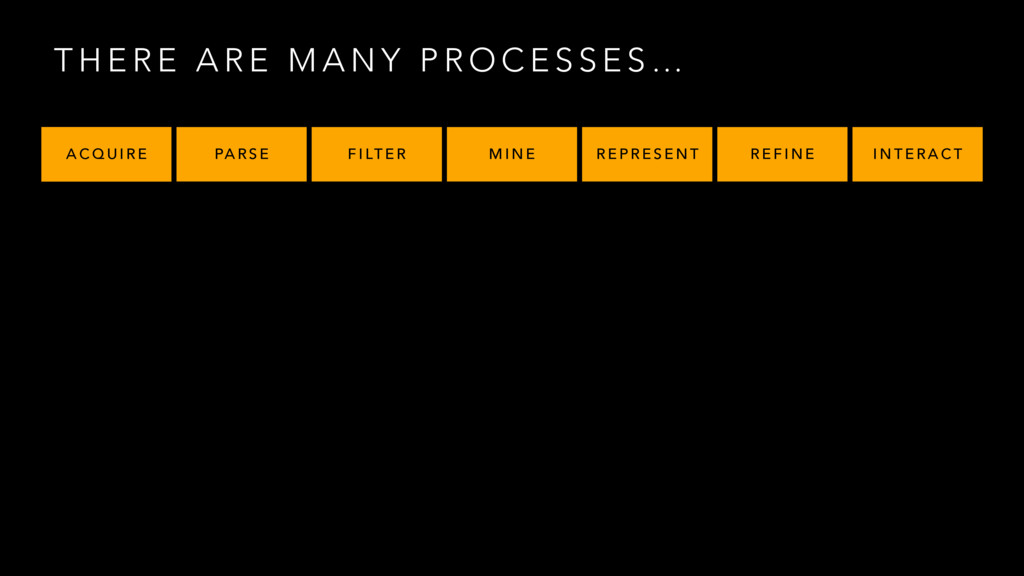
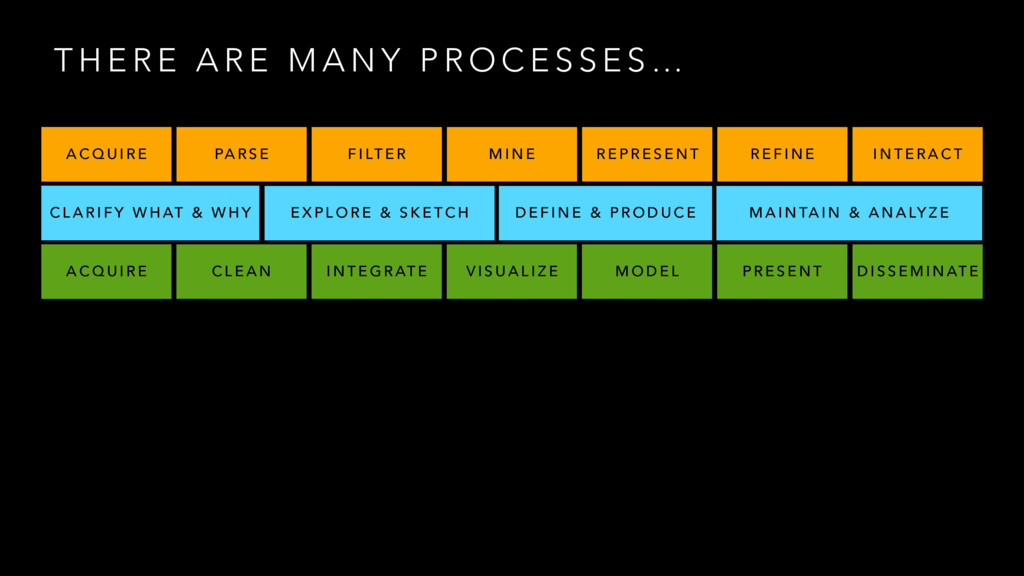
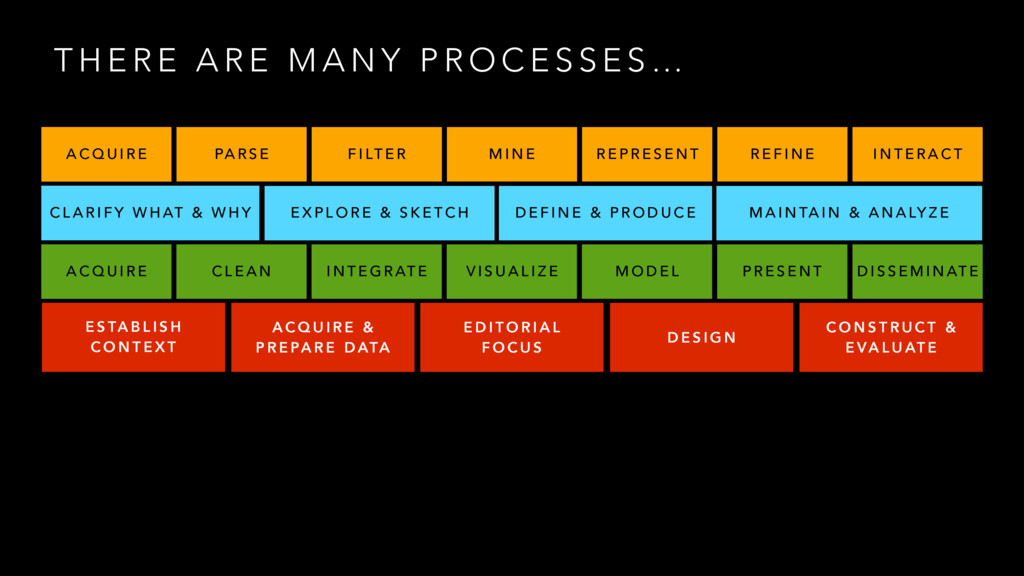
N Y P R O C E S S E S … A C Q U I R E PA R S E F I LT E R M I N E R E P R E S E N T R E F I N E I N T E R A C T C L A R I F Y W H AT & W H Y E X P L O R E & S K E T C H D E F I N E & P R O D U C E M A I N TA I N & A N A LY Z E
N Y P R O C E S S E S … A C Q U I R E PA R S E F I LT E R M I N E R E P R E S E N T R E F I N E I N T E R A C T C L A R I F Y W H AT & W H Y E X P L O R E & S K E T C H D E F I N E & P R O D U C E M A I N TA I N & A N A LY Z E A C Q U I R E C L E A N I N T E G R AT E V I S U A L I Z E M O D E L P R E S E N T D I S S E M I N AT E
N Y P R O C E S S E S … A C Q U I R E PA R S E F I LT E R M I N E R E P R E S E N T R E F I N E I N T E R A C T C L A R I F Y W H AT & W H Y E X P L O R E & S K E T C H D E F I N E & P R O D U C E M A I N TA I N & A N A LY Z E A C Q U I R E C L E A N I N T E G R AT E V I S U A L I Z E M O D E L P R E S E N T D I S S E M I N AT E E S TA B L I S H C O N T E X T A C Q U I R E & P R E PA R E D ATA E D I T O R I A L F O C U S D E S I G N C O N S T R U C T & E VA L U AT E
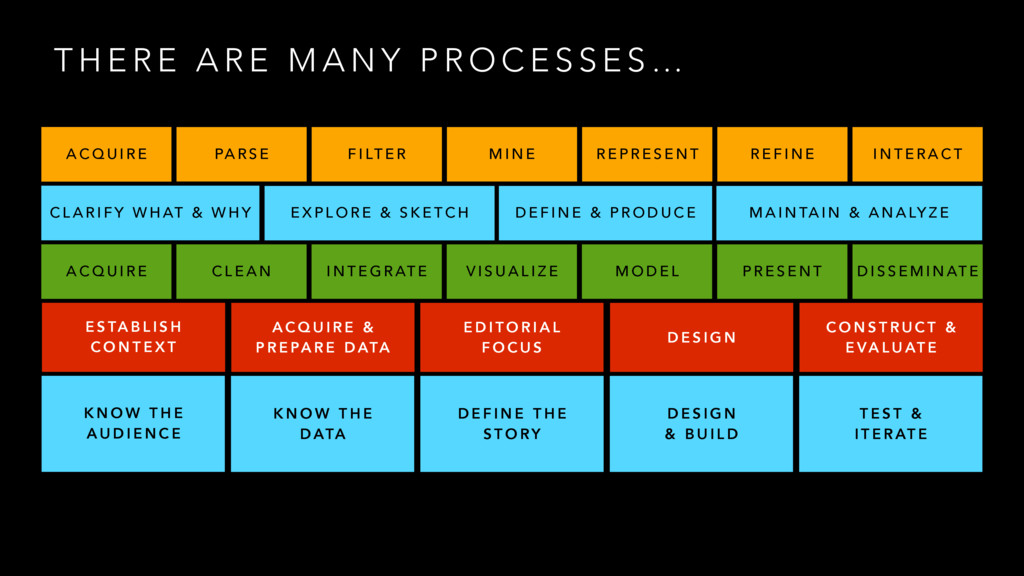
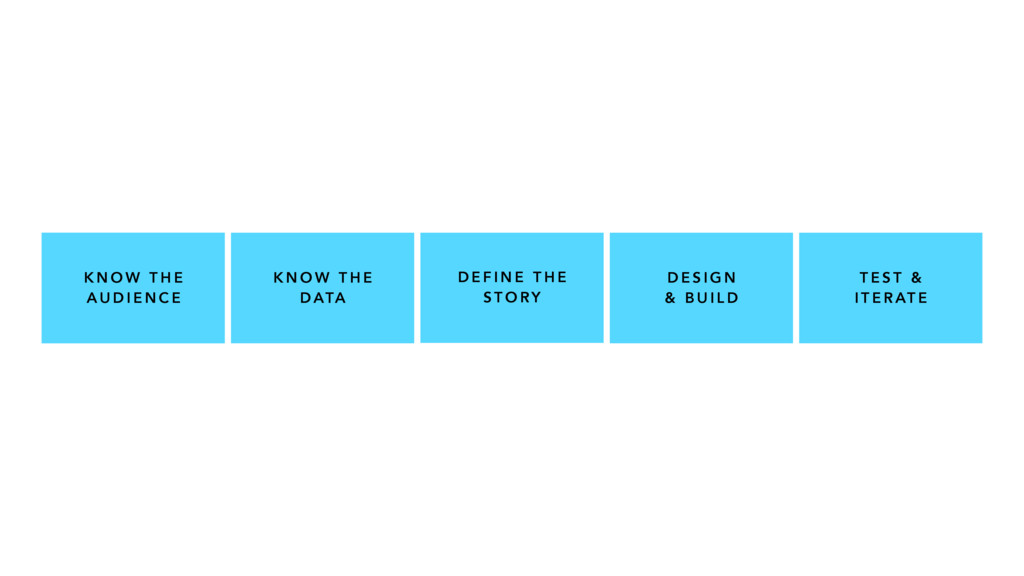
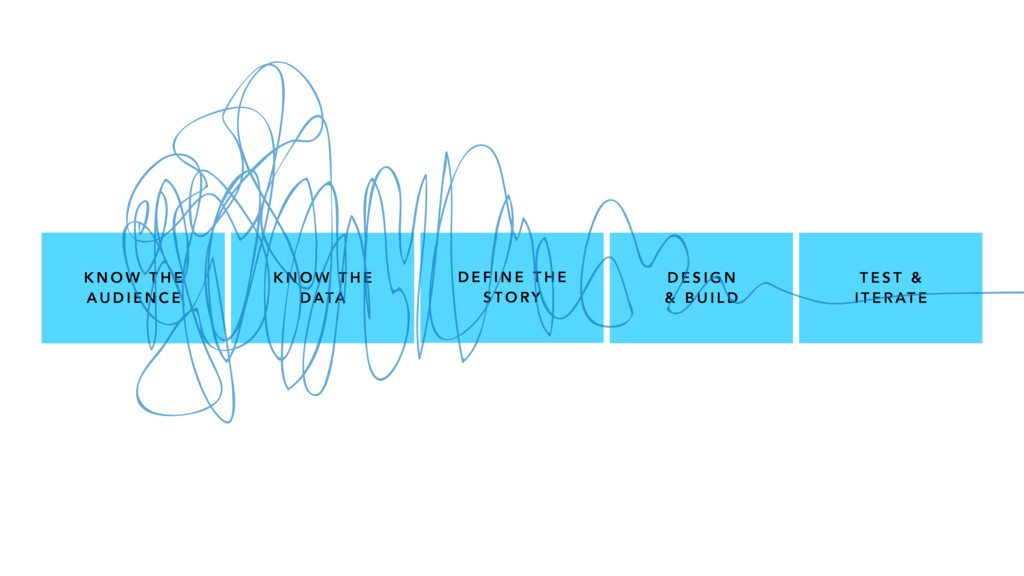
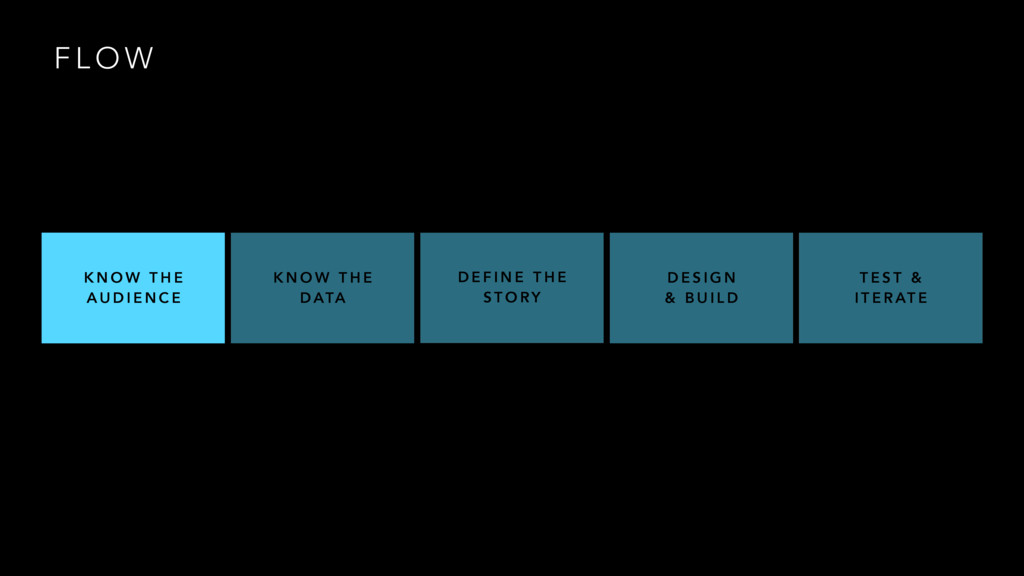
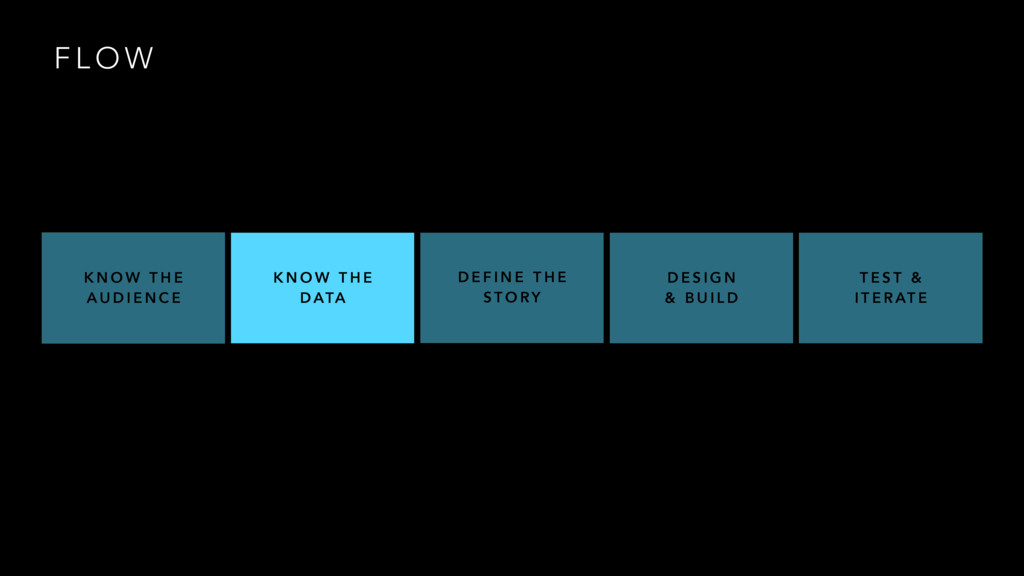
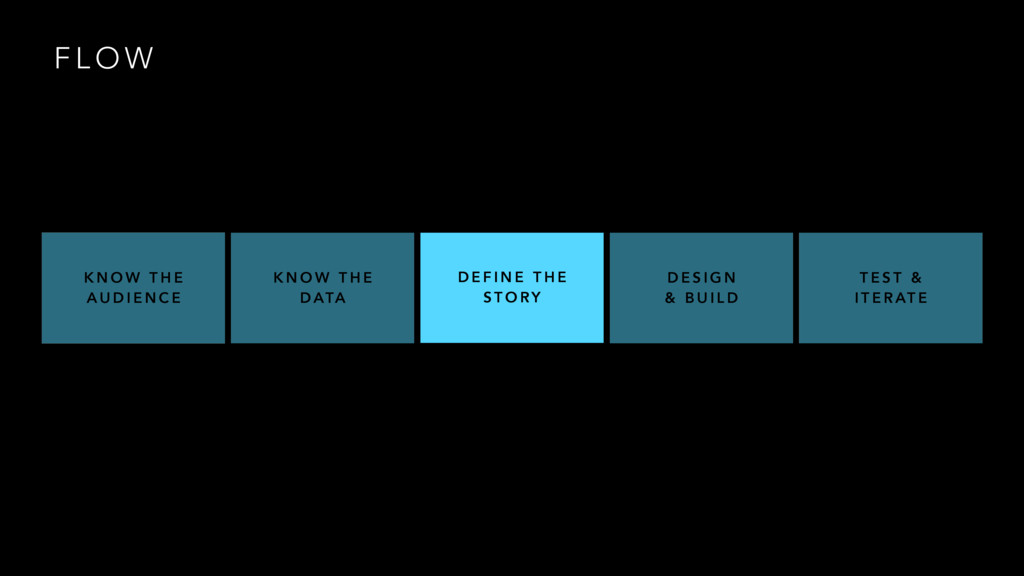
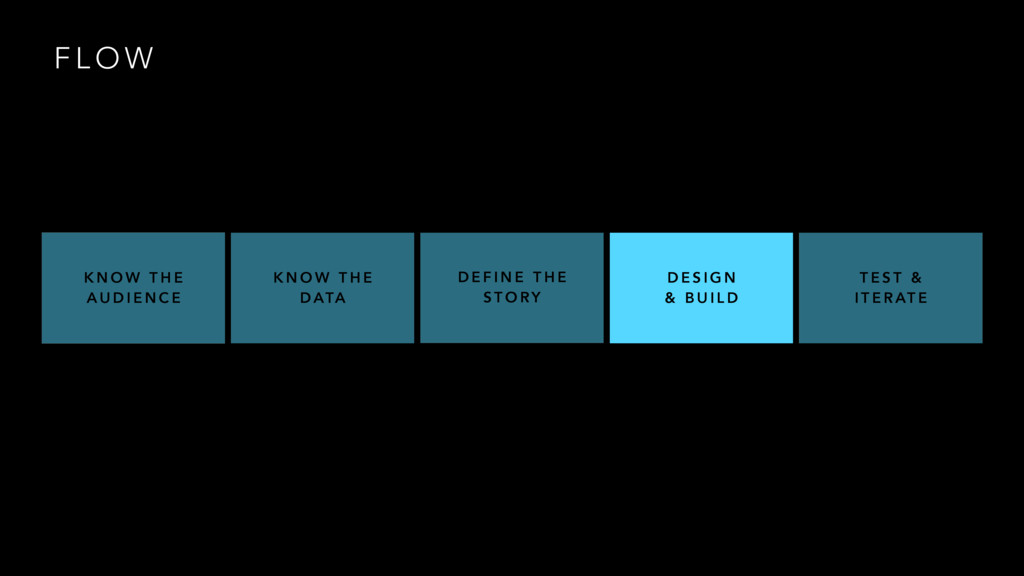
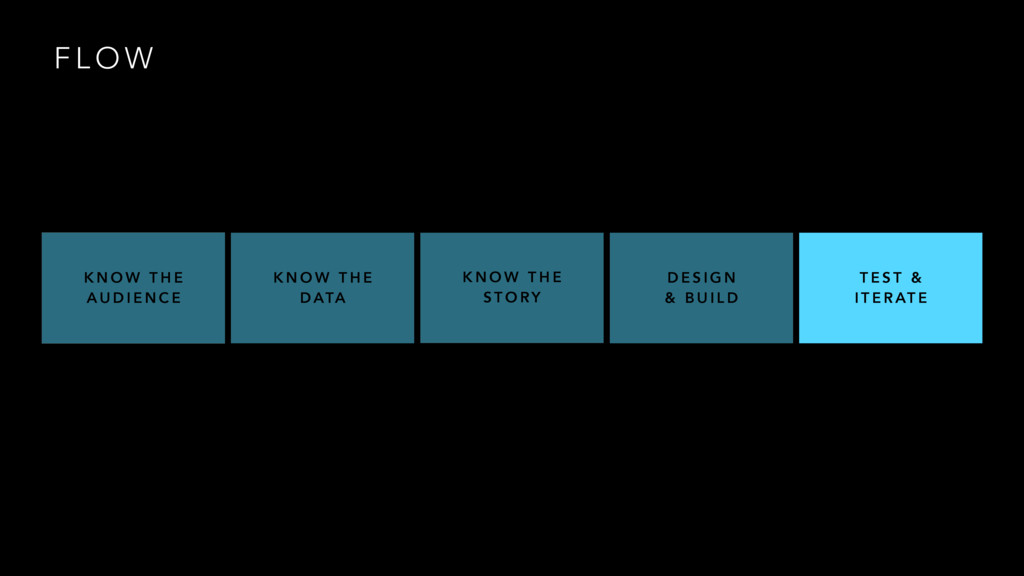
N Y P R O C E S S E S … A C Q U I R E PA R S E F I LT E R M I N E R E P R E S E N T R E F I N E I N T E R A C T C L A R I F Y W H AT & W H Y E X P L O R E & S K E T C H D E F I N E & P R O D U C E M A I N TA I N & A N A LY Z E A C Q U I R E C L E A N I N T E G R AT E V I S U A L I Z E M O D E L P R E S E N T D I S S E M I N AT E E S TA B L I S H C O N T E X T A C Q U I R E & P R E PA R E D ATA E D I T O R I A L F O C U S D E S I G N C O N S T R U C T & E VA L U AT E K N O W T H E A U D I E N C E K N O W T H E D ATA D E F I N E T H E S T O RY D E S I G N & B U I L D T E S T & I T E R AT E
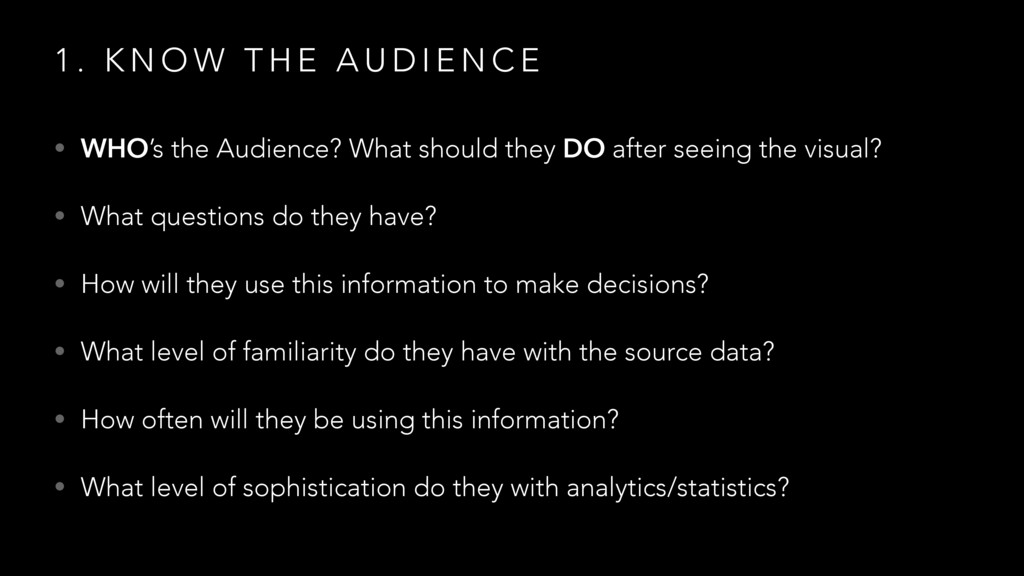
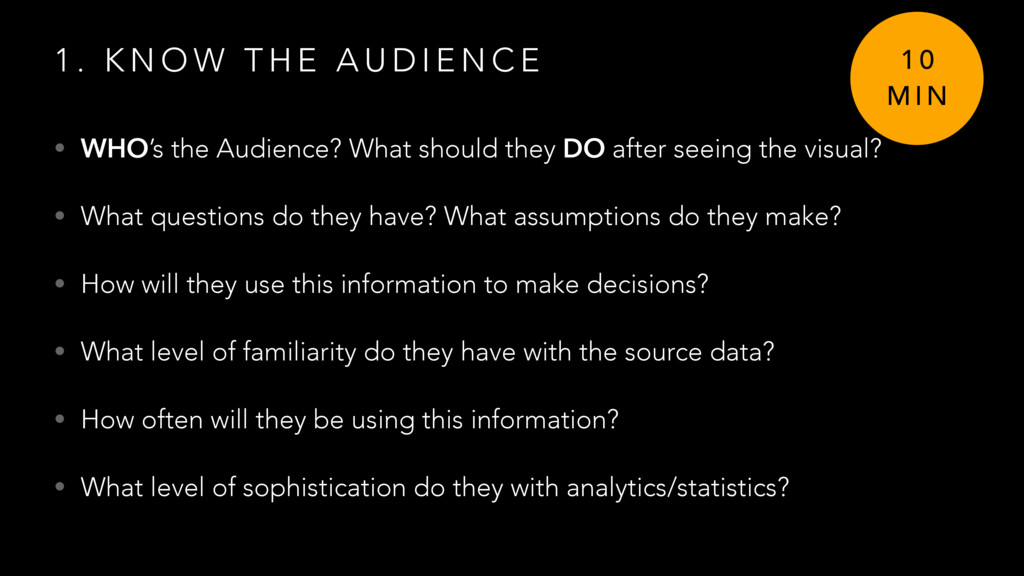
U D I E N C E • WHO’s the Audience? What should they DO after seeing the visual? • What questions do they have? • How will they use this information to make decisions? • What level of familiarity do they have with the source data? • How often will they be using this information? • What level of sophistication do they with analytics/statistics?
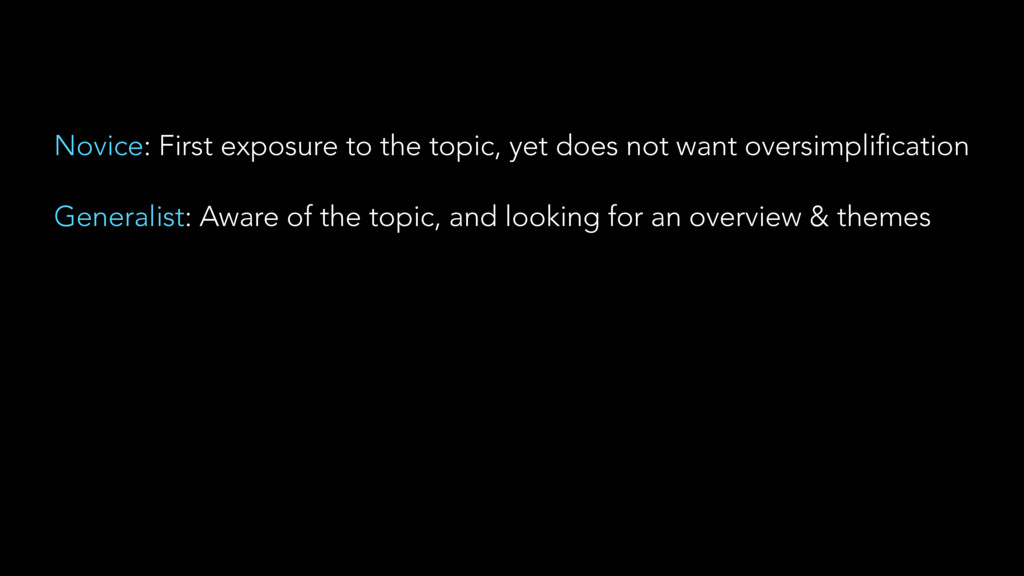
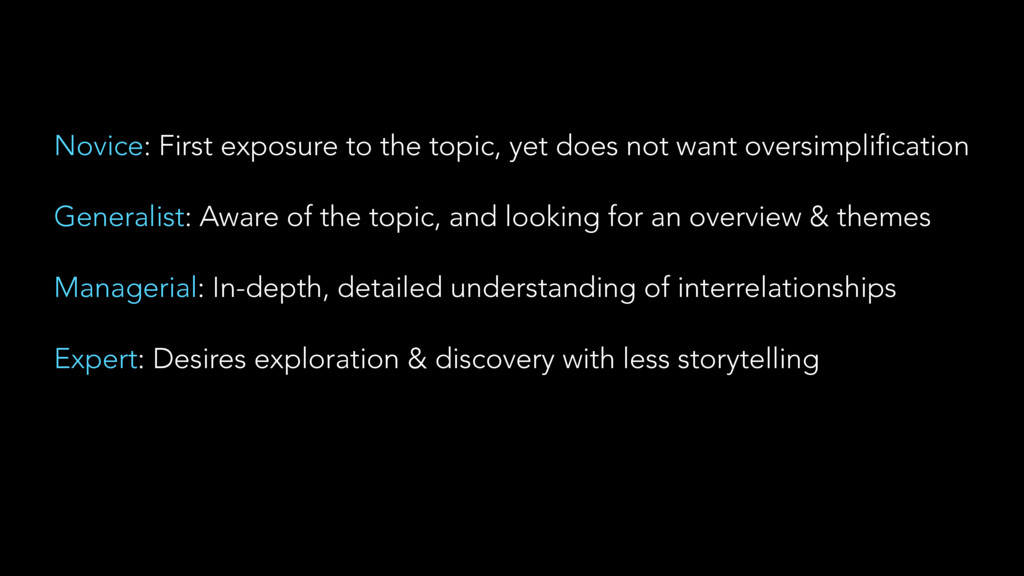
oversimplification Generalist: Aware of the topic, and looking for an overview & themes Managerial: In-depth, detailed understanding of interrelationships
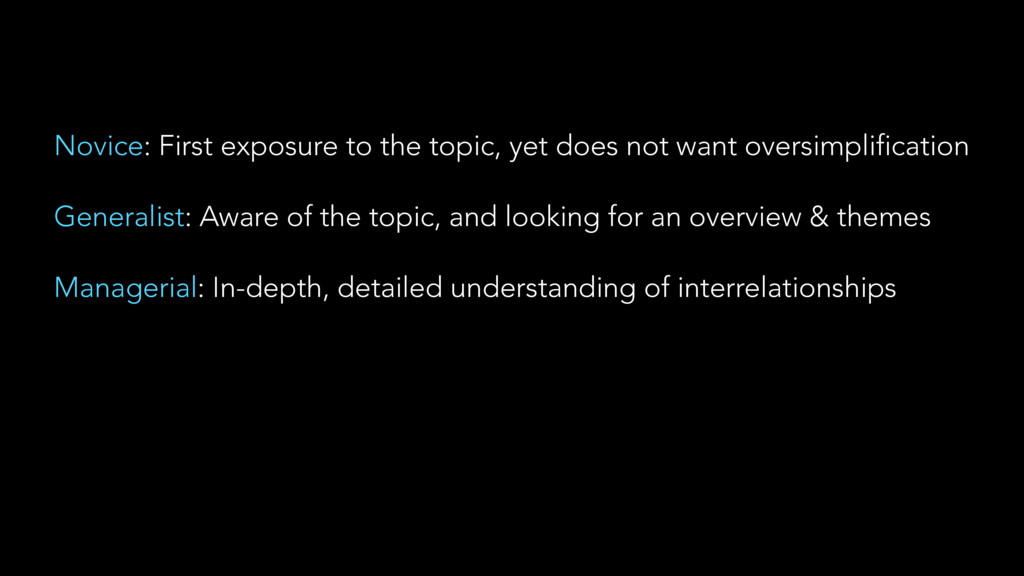
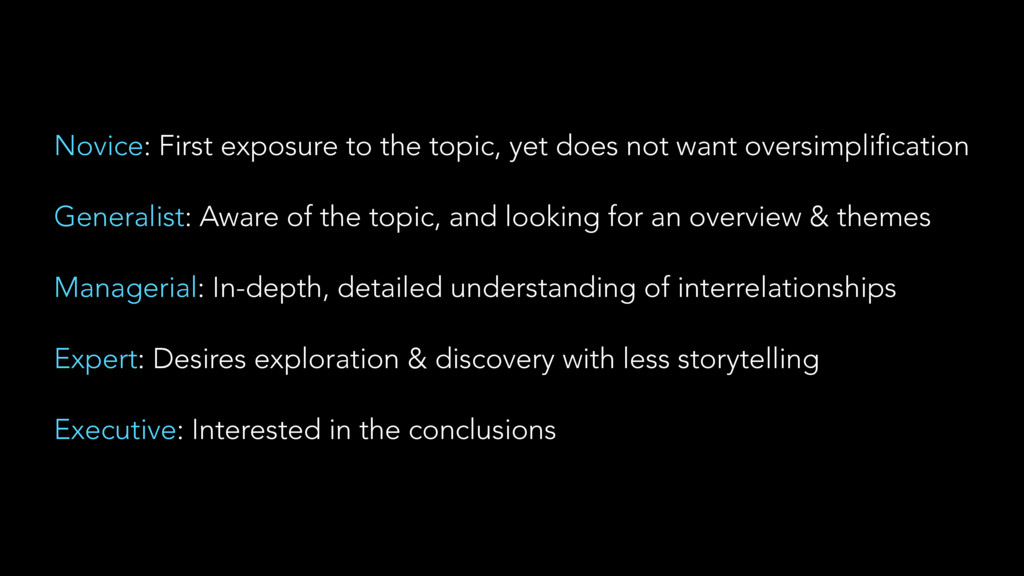
oversimplification Generalist: Aware of the topic, and looking for an overview & themes Managerial: In-depth, detailed understanding of interrelationships Expert: Desires exploration & discovery with less storytelling
oversimplification Generalist: Aware of the topic, and looking for an overview & themes Managerial: In-depth, detailed understanding of interrelationships Expert: Desires exploration & discovery with less storytelling Executive: Interested in the conclusions
U D I E N C E • WHO’s the Audience? What should they DO after seeing the visual? • What questions do they have? What assumptions do they make? • How will they use this information to make decisions? • What level of familiarity do they have with the source data? • How often will they be using this information? • What level of sophistication do they with analytics/statistics? 1 0 M I N
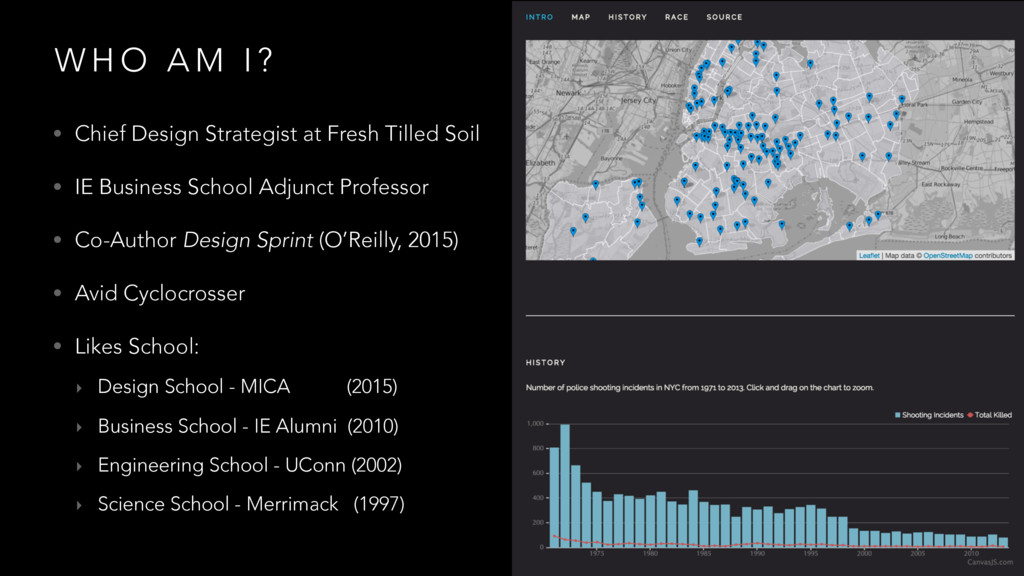
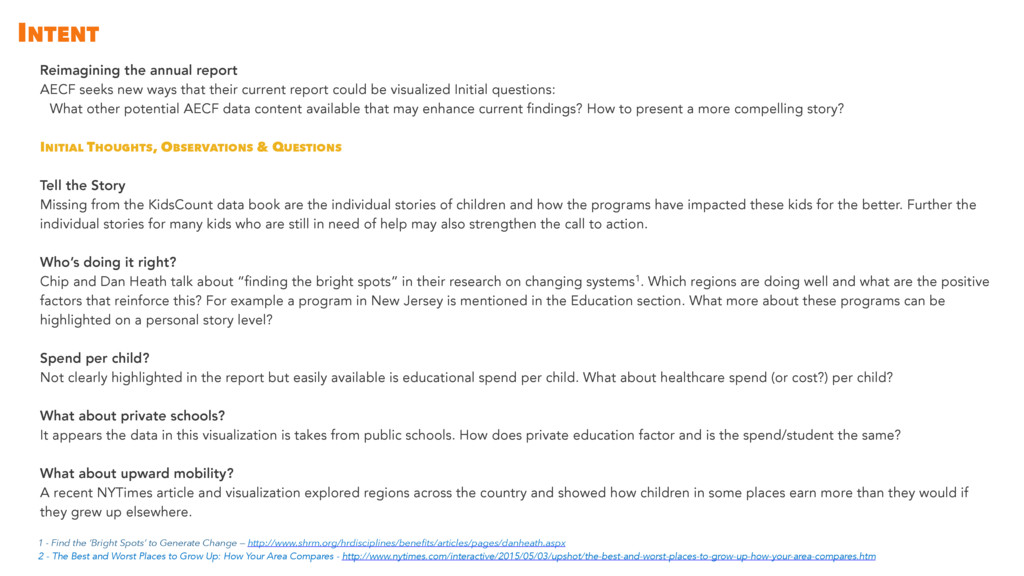
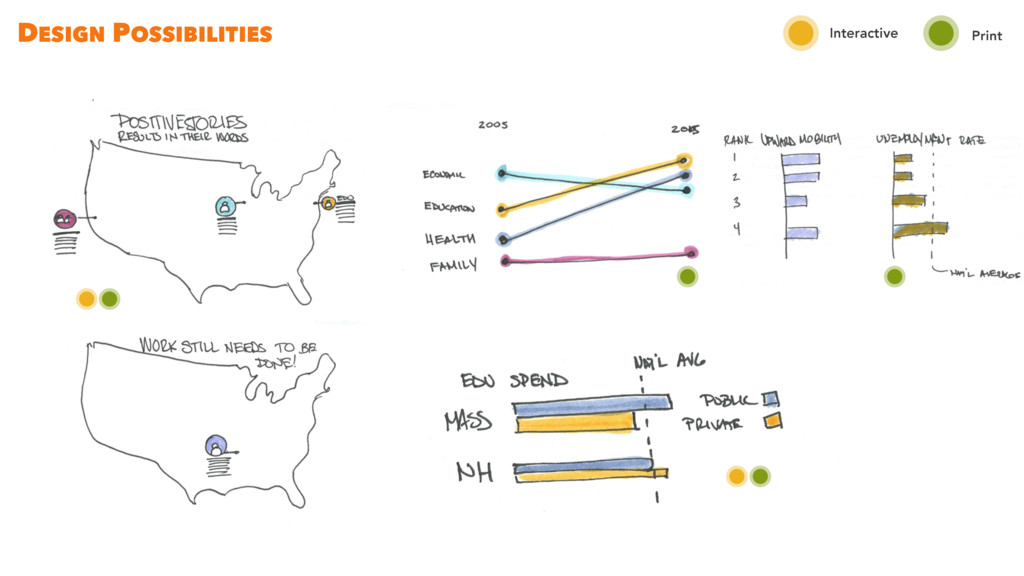
their current report could be visualized Initial questions: What other potential AECF data content available that may enhance current findings? How to present a more compelling story? INITIAL THOUGHTS, OBSERVATIONS & QUESTIONS Tell the Story Missing from the KidsCount data book are the individual stories of children and how the programs have impacted these kids for the better. Further the individual stories for many kids who are still in need of help may also strengthen the call to action. Who’s doing it right? Chip and Dan Heath talk about “finding the bright spots” in their research on changing systems1. Which regions are doing well and what are the positive factors that reinforce this? For example a program in New Jersey is mentioned in the Education section. What more about these programs can be highlighted on a personal story level? Spend per child? Not clearly highlighted in the report but easily available is educational spend per child. What about healthcare spend (or cost?) per child? What about private schools? It appears the data in this visualization is takes from public schools. How does private education factor and is the spend/student the same? What about upward mobility? A recent NYTimes article and visualization explored regions across the country and showed how children in some places earn more than they would if they grew up elsewhere. 1 - Find the ‘Bright Spots’ to Generate Change — http://www.shrm.org/hrdisciplines/benefits/articles/pages/danheath.aspx 2 - The Best and Worst Places to Grow Up: How Your Area Compares - http://www.nytimes.com/interactive/2015/05/03/upshot/the-best-and-worst-places-to-grow-up-how-your-area-compares.htm
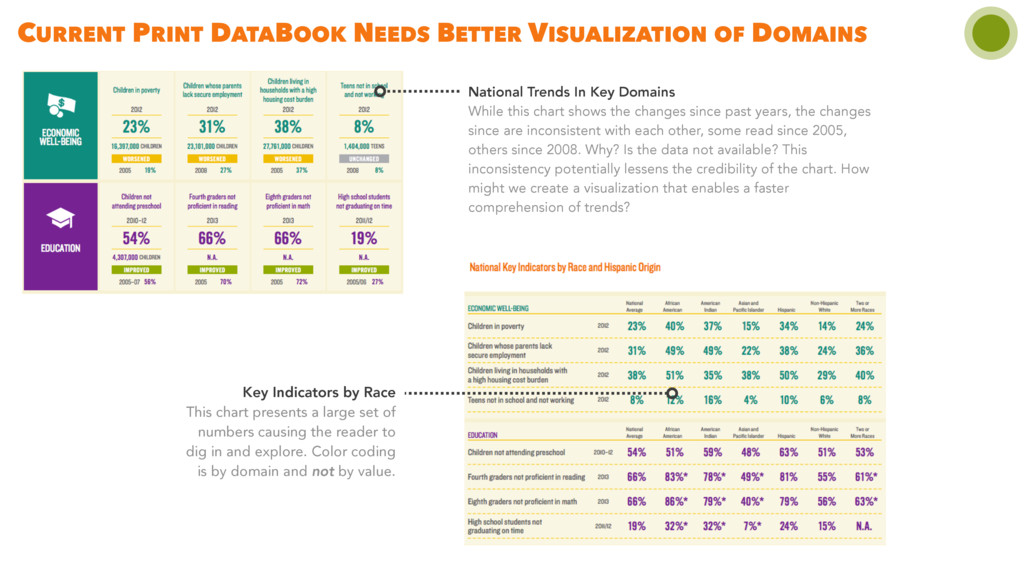
In Key Domains While this chart shows the changes since past years, the changes since are inconsistent with each other, some read since 2005, others since 2008. Why? Is the data not available? This inconsistency potentially lessens the credibility of the chart. How might we create a visualization that enables a faster comprehension of trends? Key Indicators by Race This chart presents a large set of numbers causing the reader to dig in and explore. Color coding is by domain and not by value.
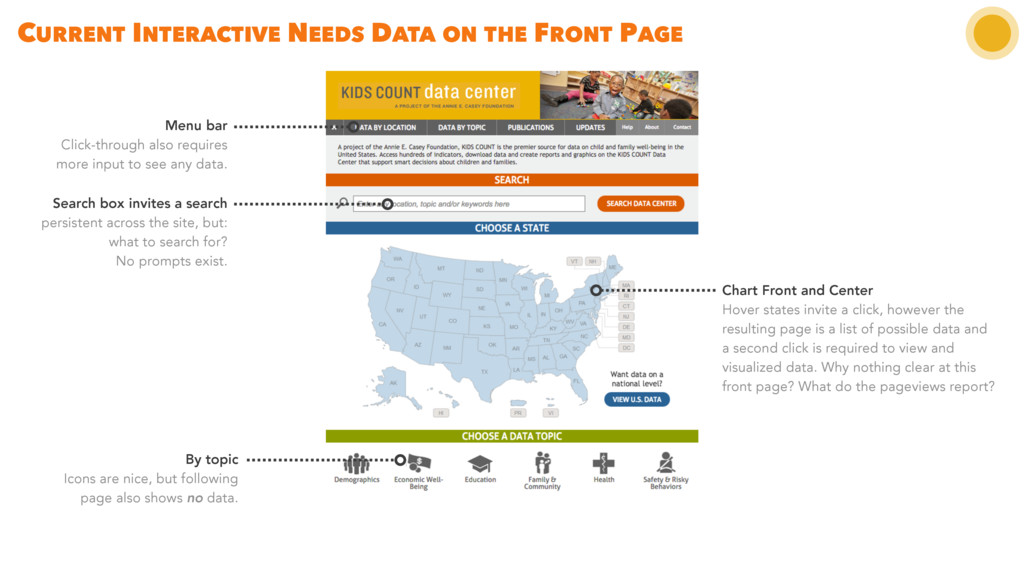
and Center Hover states invite a click, however the resulting page is a list of possible data and a second click is required to view and visualized data. Why nothing clear at this front page? What do the pageviews report? Search box invites a search persistent across the site, but: what to search for? No prompts exist. By topic Icons are nice, but following page also shows no data. Menu bar Click-through also requires more input to see any data.
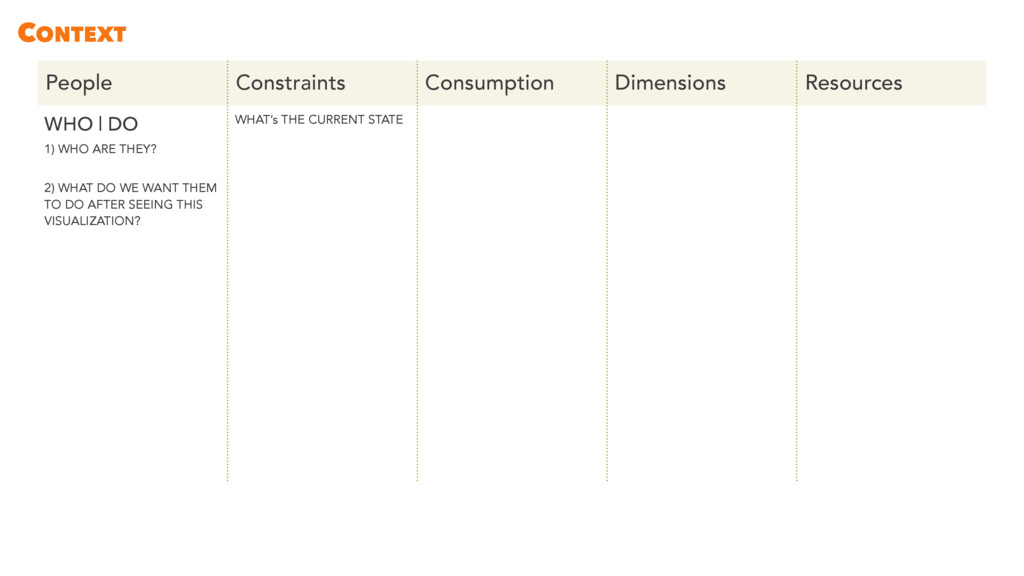
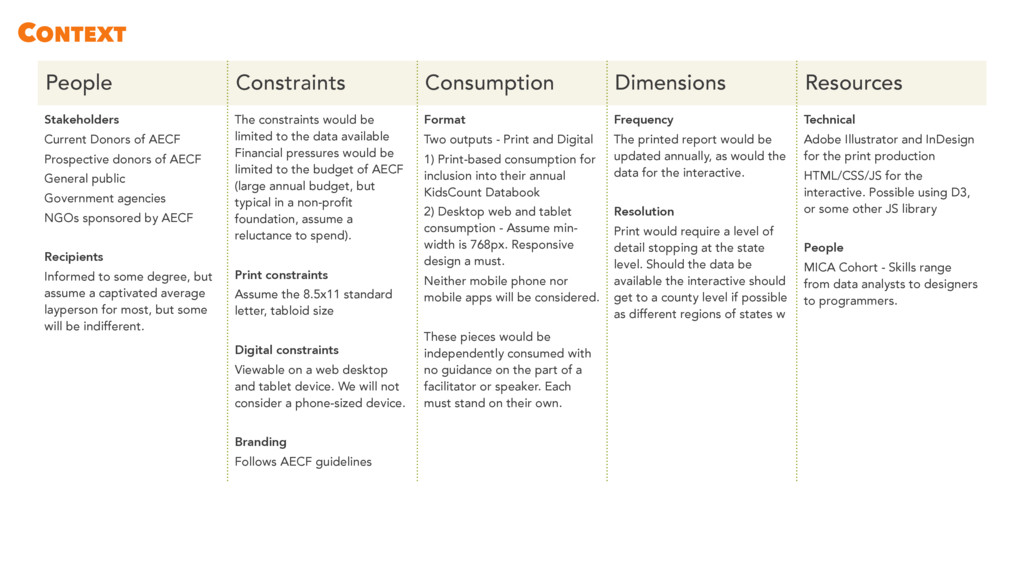
Prospective donors of AECF General public Government agencies NGOs sponsored by AECF Recipients Informed to some degree, but assume a captivated average layperson for most, but some will be indifferent. The constraints would be limited to the data available Financial pressures would be limited to the budget of AECF (large annual budget, but typical in a non-profit foundation, assume a reluctance to spend). Print constraints Assume the 8.5x11 standard letter, tabloid size Digital constraints Viewable on a web desktop and tablet device. We will not consider a phone-sized device. Branding Follows AECF guidelines Format Two outputs - Print and Digital 1) Print-based consumption for inclusion into their annual KidsCount Databook 2) Desktop web and tablet consumption - Assume min- width is 768px. Responsive design a must. Neither mobile phone nor mobile apps will be considered. These pieces would be independently consumed with no guidance on the part of a facilitator or speaker. Each must stand on their own. Frequency The printed report would be updated annually, as would the data for the interactive. Resolution Print would require a level of detail stopping at the state level. Should the data be available the interactive should get to a county level if possible as different regions of states w Technical Adobe Illustrator and InDesign for the print production HTML/CSS/JS for the interactive. Possible using D3, or some other JS library People MICA Cohort - Skills range from data analysts to designers to programmers. CONTEXT
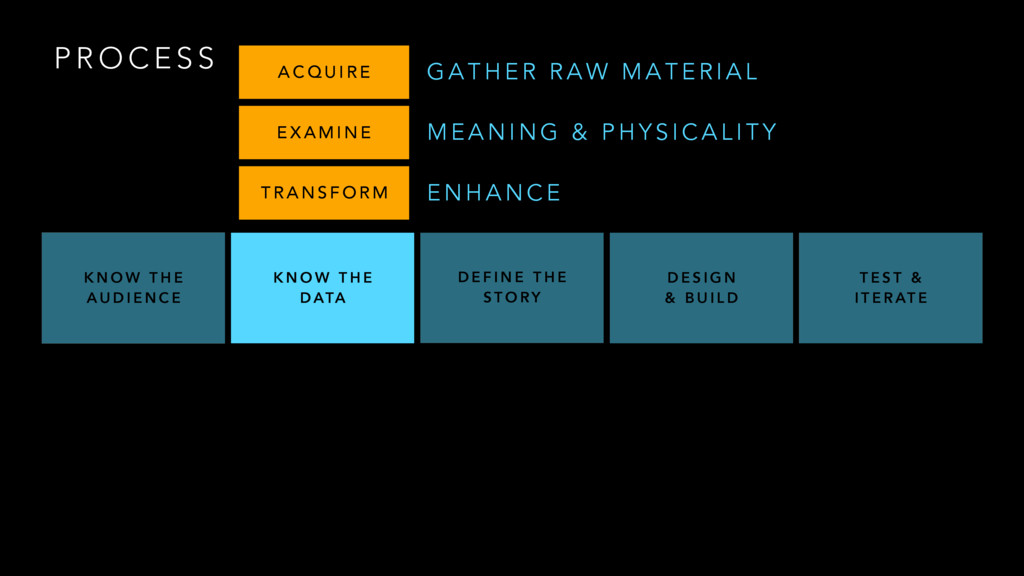
W T H E A U D I E N C E K N O W T H E D ATA D E F I N E T H E S T O RY D E S I G N & B U I L D T E S T & I T E R AT E A C Q U I R E E X A M I N E T R A N S F O R M G A T H E R R A W M A T E R I A L M E A N I N G & P H Y S I C A L I T Y E N H A N C E
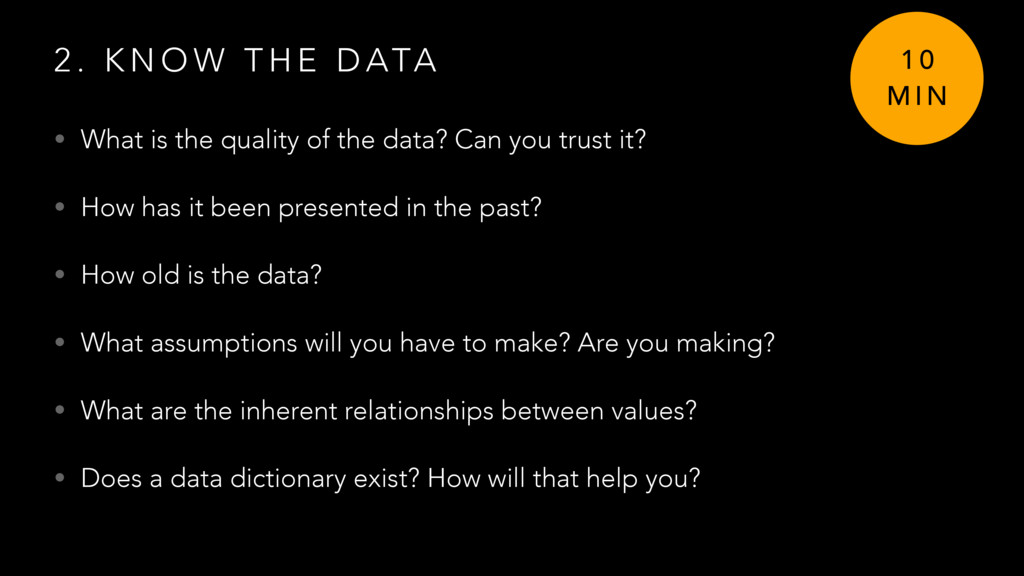
ATA • What is the quality of the data? Can you trust it? • How has it been presented in the past? • How old is the data? • What assumptions will you have to make? Are you making? • What are the inherent relationships between values? • Does a data dictionary exist? How will that help you? 1 0 M I N
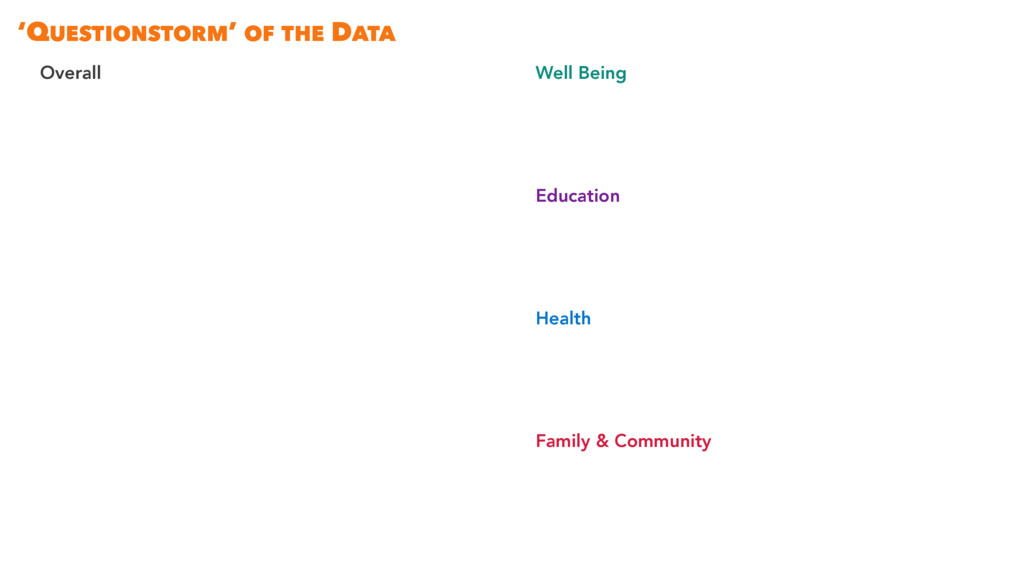
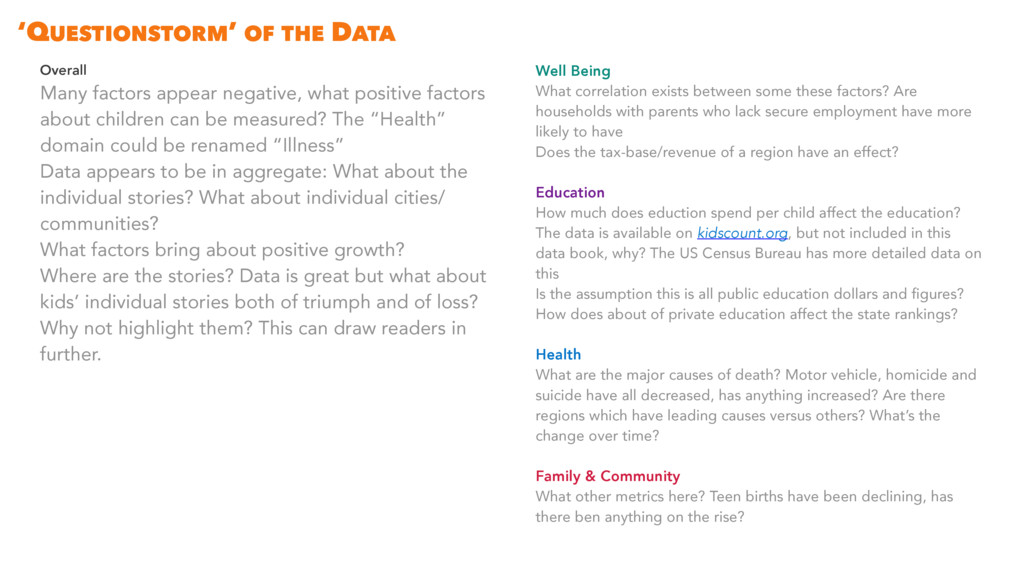
can be measured? The “Health” domain could be renamed “Illness” Data appears to be in aggregate: What about the individual stories? What about individual cities/ communities? What factors bring about positive growth? Where are the stories? Data is great but what about kids’ individual stories both of triumph and of loss? Why not highlight them? This can draw readers in further. Well Being What correlation exists between some these factors? Are households with parents who lack secure employment have more likely to have Does the tax-base/revenue of a region have an effect? Education How much does eduction spend per child affect the education? The data is available on kidscount.org, but not included in this data book, why? The US Census Bureau has more detailed data on this Is the assumption this is all public education dollars and figures? How does about of private education affect the state rankings? Health What are the major causes of death? Motor vehicle, homicide and suicide have all decreased, has anything increased? Are there regions which have leading causes versus others? What’s the change over time? Family & Community What other metrics here? Teen births have been declining, has there ben anything on the rise? ‘QUESTIONSTORM’ OF THE DATA
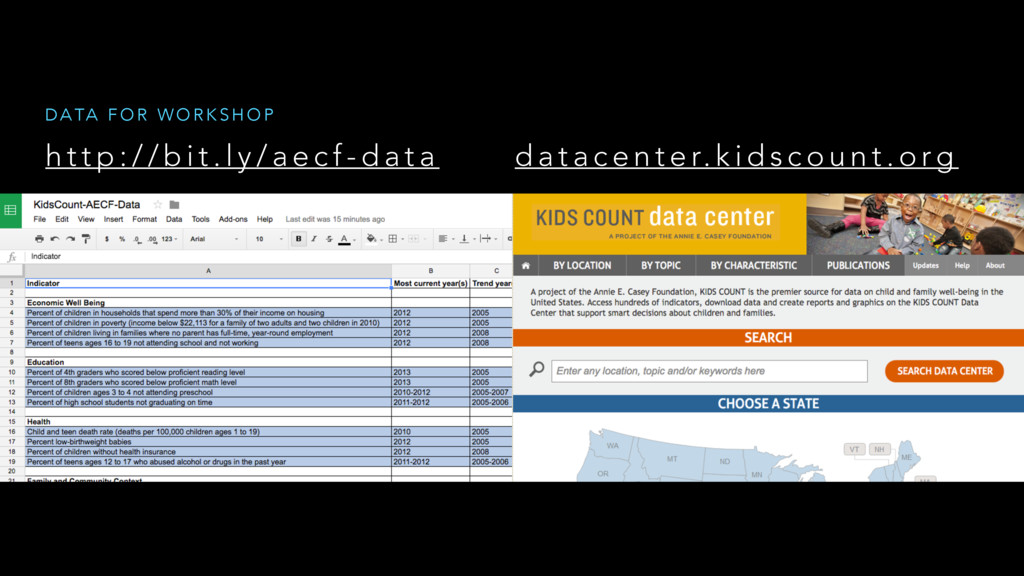
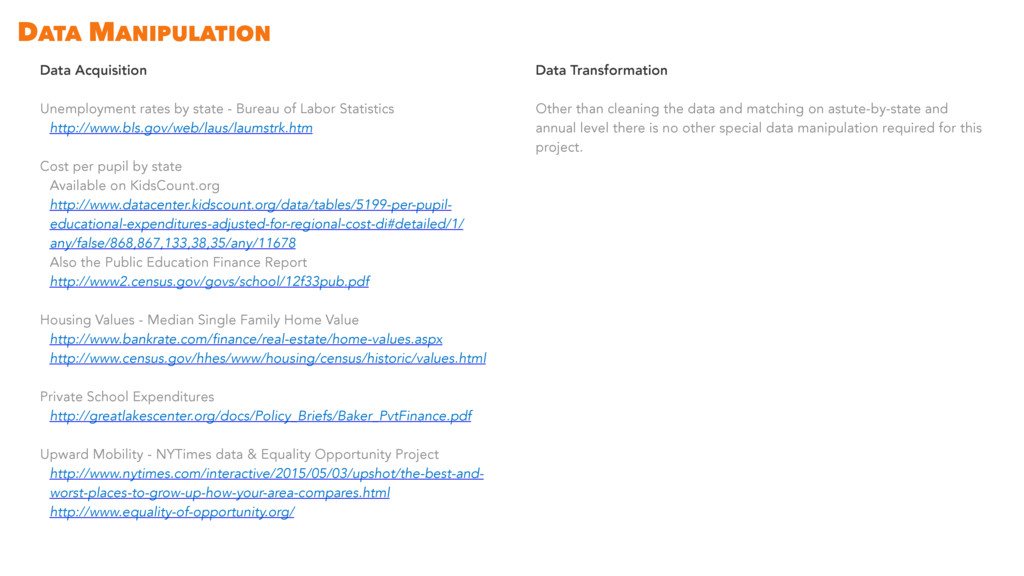
Statistics http://www.bls.gov/web/laus/laumstrk.htm Cost per pupil by state Available on KidsCount.org http://www.datacenter.kidscount.org/data/tables/5199-per-pupil- educational-expenditures-adjusted-for-regional-cost-di#detailed/1/ any/false/868,867,133,38,35/any/11678 Also the Public Education Finance Report http://www2.census.gov/govs/school/12f33pub.pdf Housing Values - Median Single Family Home Value http://www.bankrate.com/finance/real-estate/home-values.aspx http://www.census.gov/hhes/www/housing/census/historic/values.html Private School Expenditures http://greatlakescenter.org/docs/Policy_Briefs/Baker_PvtFinance.pdf Upward Mobility - NYTimes data & Equality Opportunity Project http://www.nytimes.com/interactive/2015/05/03/upshot/the-best-and- worst-places-to-grow-up-how-your-area-compares.html http://www.equality-of-opportunity.org/ Data Transformation Other than cleaning the data and matching on astute-by-state and annual level there is no other special data manipulation required for this project. DATA MANIPULATION
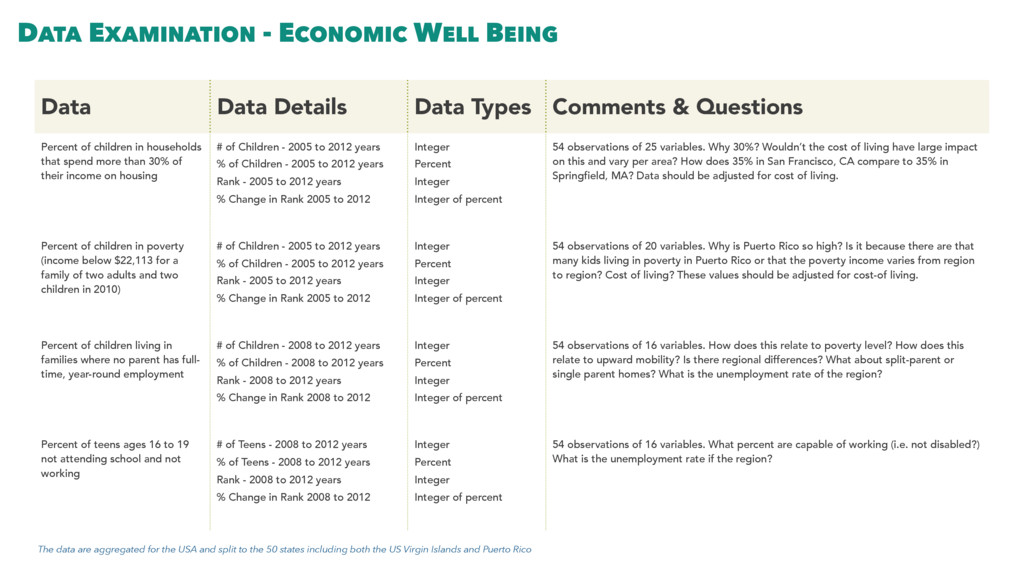
Types Comments & Questions Percent of children in households that spend more than 30% of their income on housing # of Children - 2005 to 2012 years % of Children - 2005 to 2012 years Rank - 2005 to 2012 years % Change in Rank 2005 to 2012 Integer Percent Integer Integer of percent 54 observations of 25 variables. Why 30%? Wouldn’t the cost of living have large impact on this and vary per area? How does 35% in San Francisco, CA compare to 35% in Springfield, MA? Data should be adjusted for cost of living. Percent of children in poverty (income below $22,113 for a family of two adults and two children in 2010) # of Children - 2005 to 2012 years % of Children - 2005 to 2012 years Rank - 2005 to 2012 years % Change in Rank 2005 to 2012 Integer Percent Integer Integer of percent 54 observations of 20 variables. Why is Puerto Rico so high? Is it because there are that many kids living in poverty in Puerto Rico or that the poverty income varies from region to region? Cost of living? These values should be adjusted for cost-of living. Percent of children living in families where no parent has full- time, year-round employment # of Children - 2008 to 2012 years % of Children - 2008 to 2012 years Rank - 2008 to 2012 years % Change in Rank 2008 to 2012 Integer Percent Integer Integer of percent 54 observations of 16 variables. How does this relate to poverty level? How does this relate to upward mobility? Is there regional differences? What about split-parent or single parent homes? What is the unemployment rate of the region? Percent of teens ages 16 to 19 not attending school and not working # of Teens - 2008 to 2012 years % of Teens - 2008 to 2012 years Rank - 2008 to 2012 years % Change in Rank 2008 to 2012 Integer Percent Integer Integer of percent 54 observations of 16 variables. What percent are capable of working (i.e. not disabled?) What is the unemployment rate if the region? The data are aggregated for the USA and split to the 50 states including both the US Virgin Islands and Puerto Rico
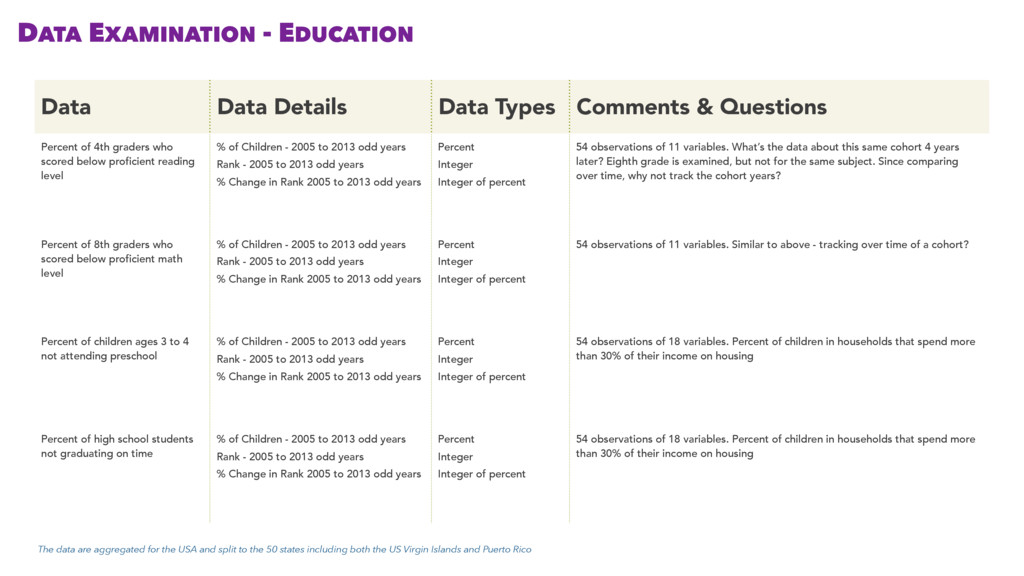
& Questions Percent of 4th graders who scored below proficient reading level % of Children - 2005 to 2013 odd years Rank - 2005 to 2013 odd years % Change in Rank 2005 to 2013 odd years Percent Integer Integer of percent 54 observations of 11 variables. What’s the data about this same cohort 4 years later? Eighth grade is examined, but not for the same subject. Since comparing over time, why not track the cohort years? Percent of 8th graders who scored below proficient math level % of Children - 2005 to 2013 odd years Rank - 2005 to 2013 odd years % Change in Rank 2005 to 2013 odd years Percent Integer Integer of percent 54 observations of 11 variables. Similar to above - tracking over time of a cohort? Percent of children ages 3 to 4 not attending preschool % of Children - 2005 to 2013 odd years Rank - 2005 to 2013 odd years % Change in Rank 2005 to 2013 odd years Percent Integer Integer of percent 54 observations of 18 variables. Percent of children in households that spend more than 30% of their income on housing Percent of high school students not graduating on time % of Children - 2005 to 2013 odd years Rank - 2005 to 2013 odd years % Change in Rank 2005 to 2013 odd years Percent Integer Integer of percent 54 observations of 18 variables. Percent of children in households that spend more than 30% of their income on housing The data are aggregated for the USA and split to the 50 states including both the US Virgin Islands and Puerto Rico
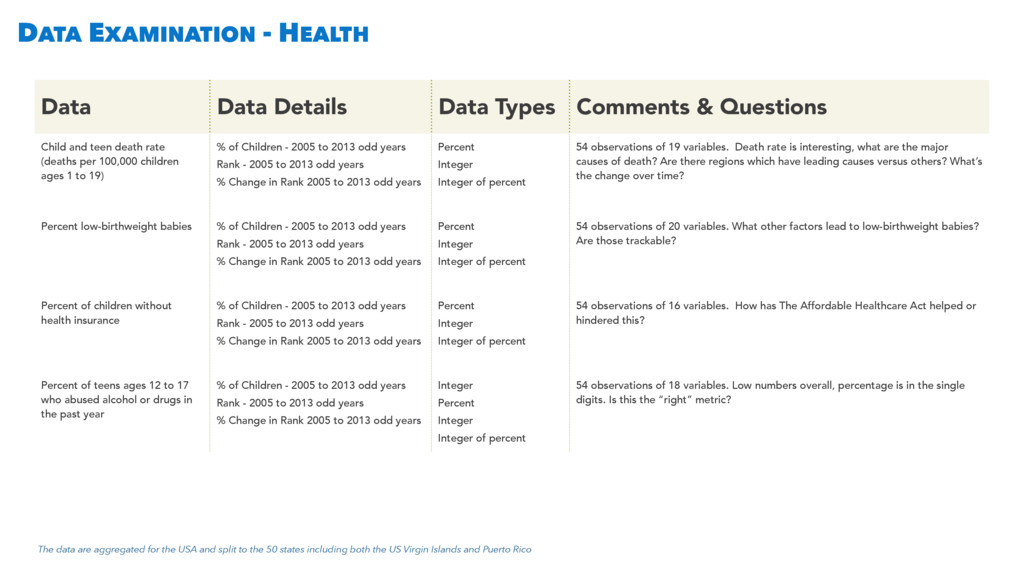
& Questions Child and teen death rate (deaths per 100,000 children ages 1 to 19) % of Children - 2005 to 2013 odd years Rank - 2005 to 2013 odd years % Change in Rank 2005 to 2013 odd years Percent Integer Integer of percent 54 observations of 19 variables. Death rate is interesting, what are the major causes of death? Are there regions which have leading causes versus others? What’s the change over time? Percent low-birthweight babies % of Children - 2005 to 2013 odd years Rank - 2005 to 2013 odd years % Change in Rank 2005 to 2013 odd years Percent Integer Integer of percent 54 observations of 20 variables. What other factors lead to low-birthweight babies? Are those trackable? Percent of children without health insurance % of Children - 2005 to 2013 odd years Rank - 2005 to 2013 odd years % Change in Rank 2005 to 2013 odd years Percent Integer Integer of percent 54 observations of 16 variables. How has The Affordable Healthcare Act helped or hindered this? Percent of teens ages 12 to 17 who abused alcohol or drugs in the past year % of Children - 2005 to 2013 odd years Rank - 2005 to 2013 odd years % Change in Rank 2005 to 2013 odd years Integer Percent Integer Integer of percent 54 observations of 18 variables. Low numbers overall, percentage is in the single digits. Is this the “right” metric? The data are aggregated for the USA and split to the 50 states including both the US Virgin Islands and Puerto Rico
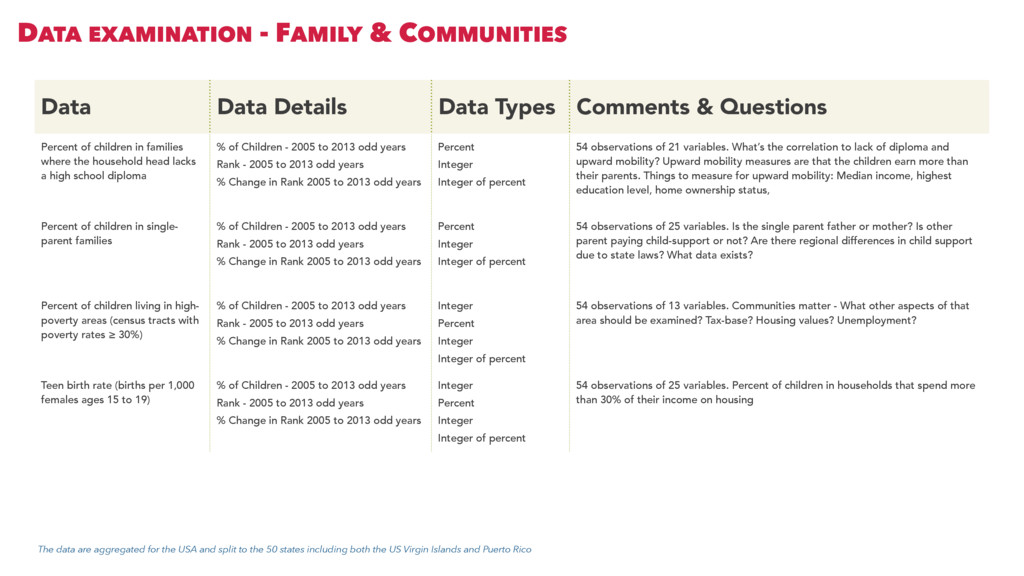
Types Comments & Questions Percent of children in families where the household head lacks a high school diploma % of Children - 2005 to 2013 odd years Rank - 2005 to 2013 odd years % Change in Rank 2005 to 2013 odd years Percent Integer Integer of percent 54 observations of 21 variables. What’s the correlation to lack of diploma and upward mobility? Upward mobility measures are that the children earn more than their parents. Things to measure for upward mobility: Median income, highest education level, home ownership status, Percent of children in single- parent families % of Children - 2005 to 2013 odd years Rank - 2005 to 2013 odd years % Change in Rank 2005 to 2013 odd years Percent Integer Integer of percent 54 observations of 25 variables. Is the single parent father or mother? Is other parent paying child-support or not? Are there regional differences in child support due to state laws? What data exists? Percent of children living in high- poverty areas (census tracts with poverty rates ≥ 30%) % of Children - 2005 to 2013 odd years Rank - 2005 to 2013 odd years % Change in Rank 2005 to 2013 odd years Integer Percent Integer Integer of percent 54 observations of 13 variables. Communities matter - What other aspects of that area should be examined? Tax-base? Housing values? Unemployment? Teen birth rate (births per 1,000 females ages 15 to 19) % of Children - 2005 to 2013 odd years Rank - 2005 to 2013 odd years % Change in Rank 2005 to 2013 odd years Integer Percent Integer Integer of percent 54 observations of 25 variables. Percent of children in households that spend more than 30% of their income on housing The data are aggregated for the USA and split to the 50 states including both the US Virgin Islands and Puerto Rico
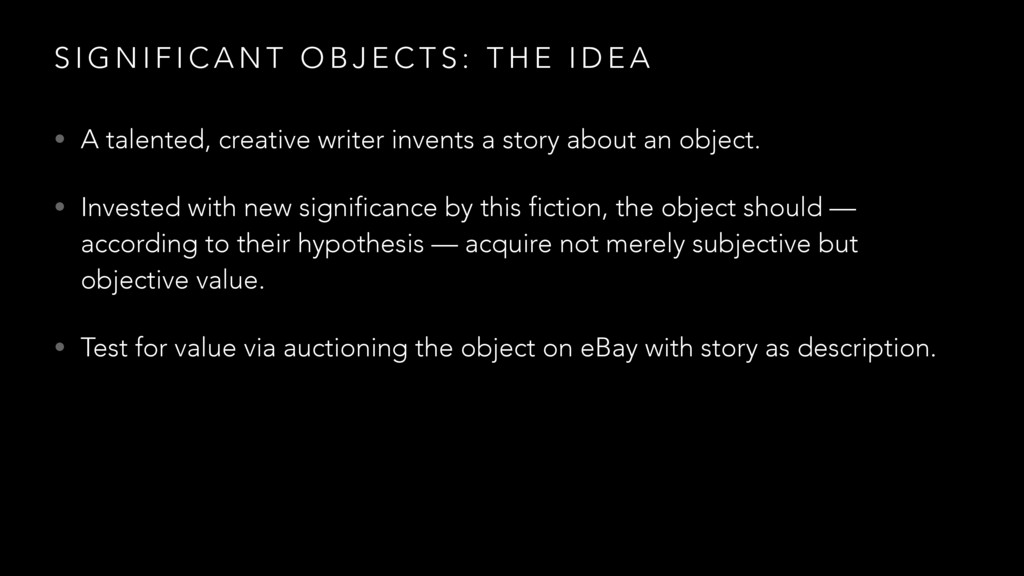
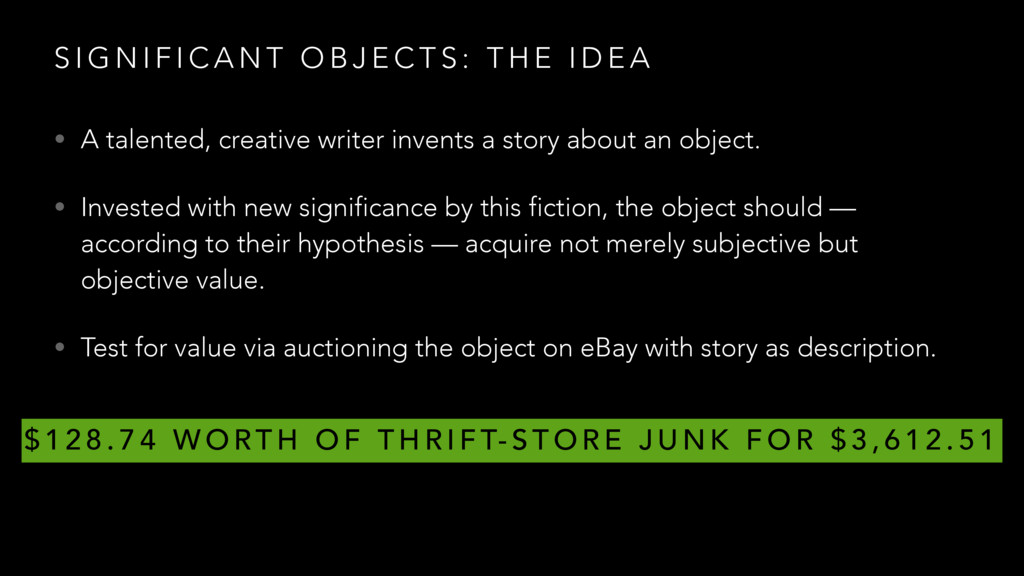
T O B J E C T S : T H E I D E A • A talented, creative writer invents a story about an object. • Invested with new significance by this fiction, the object should — according to their hypothesis — acquire not merely subjective but objective value. • Test for value via auctioning the object on eBay with story as description.
T O B J E C T S : T H E I D E A • A talented, creative writer invents a story about an object. • Invested with new significance by this fiction, the object should — according to their hypothesis — acquire not merely subjective but objective value. • Test for value via auctioning the object on eBay with story as description. $ 1 2 8 . 7 4 W O RT H O F T H R I F T- S T O R E J U N K F O R $ 3 , 6 1 2 . 5 1
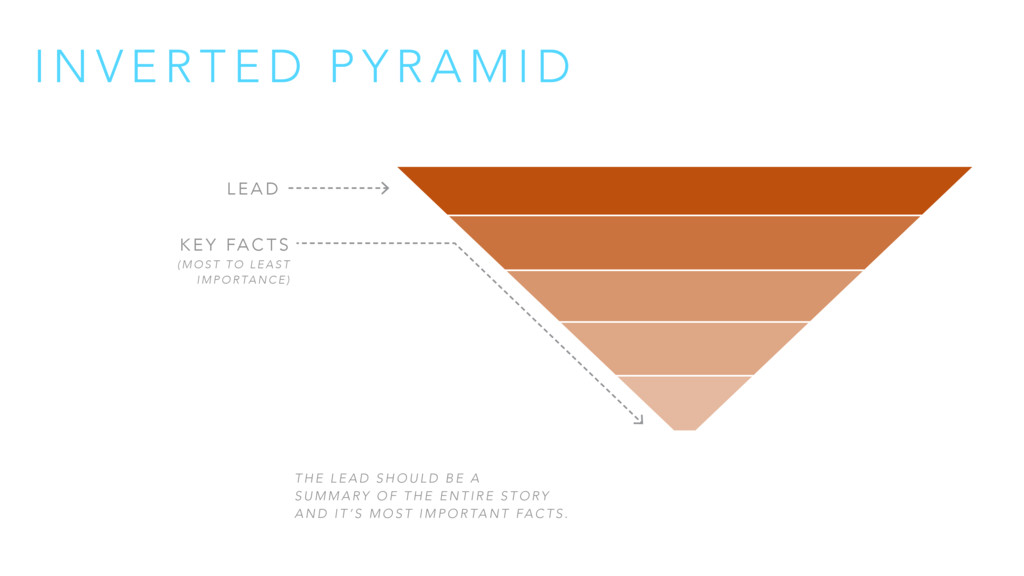
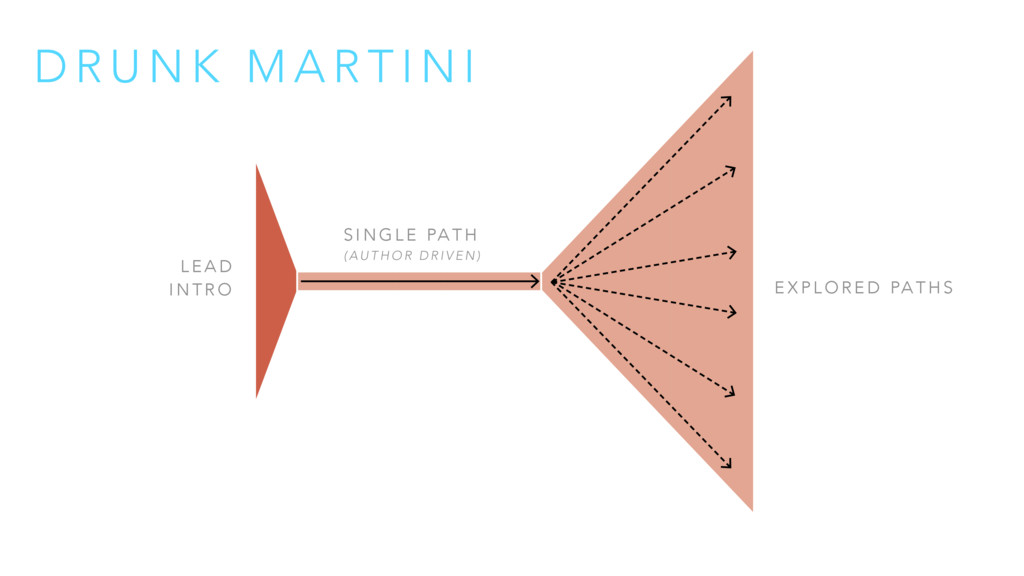
R A M I D L E A D K E Y FA C T S ( M O S T T O L E A S T I M P O R TA N C E ) T H E L E A D S H O U L D B E A S U M M A RY O F T H E E N T I R E S T O RY A N D I T ’ S M O S T I M P O R TA N T FA C T S .
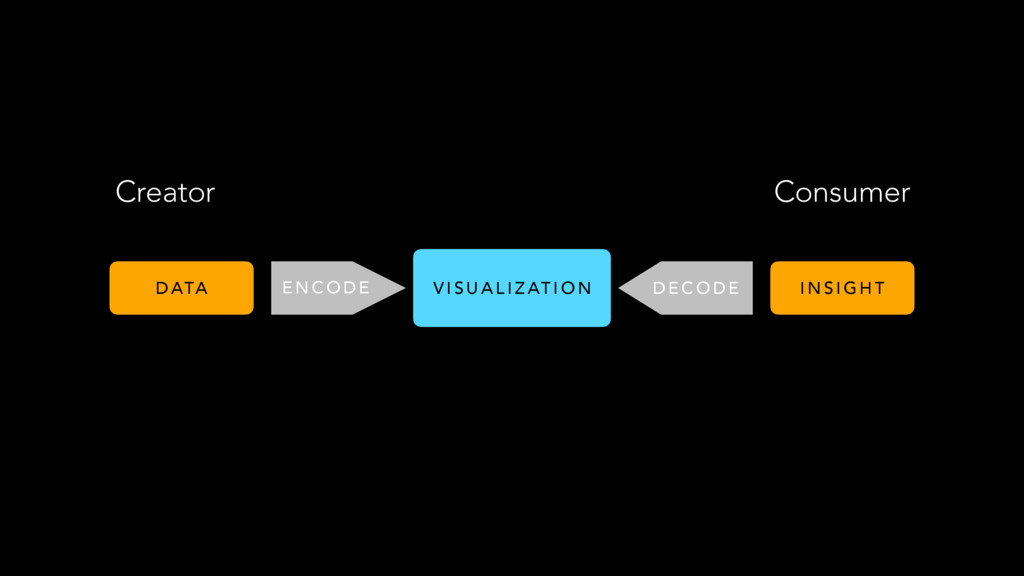
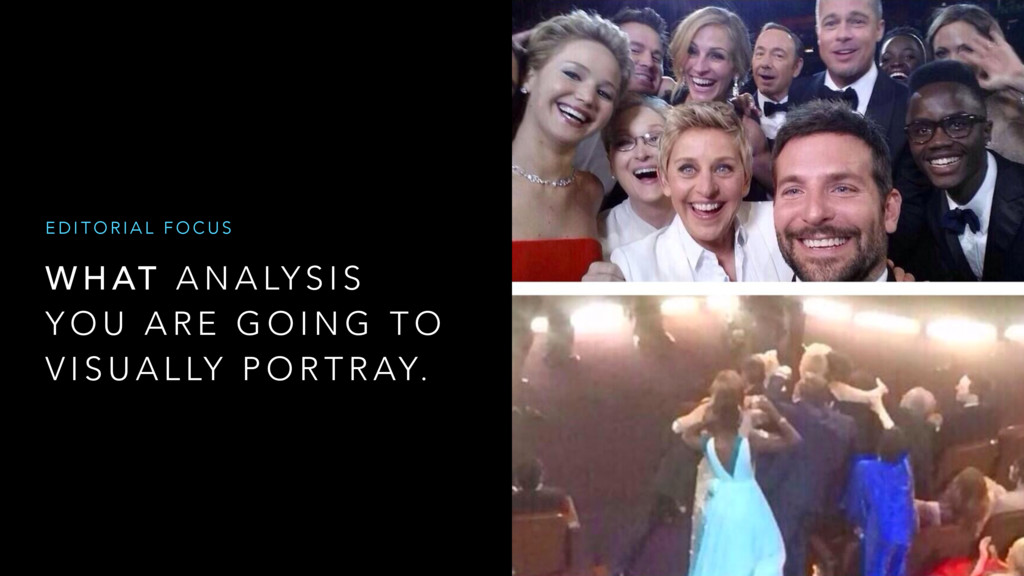
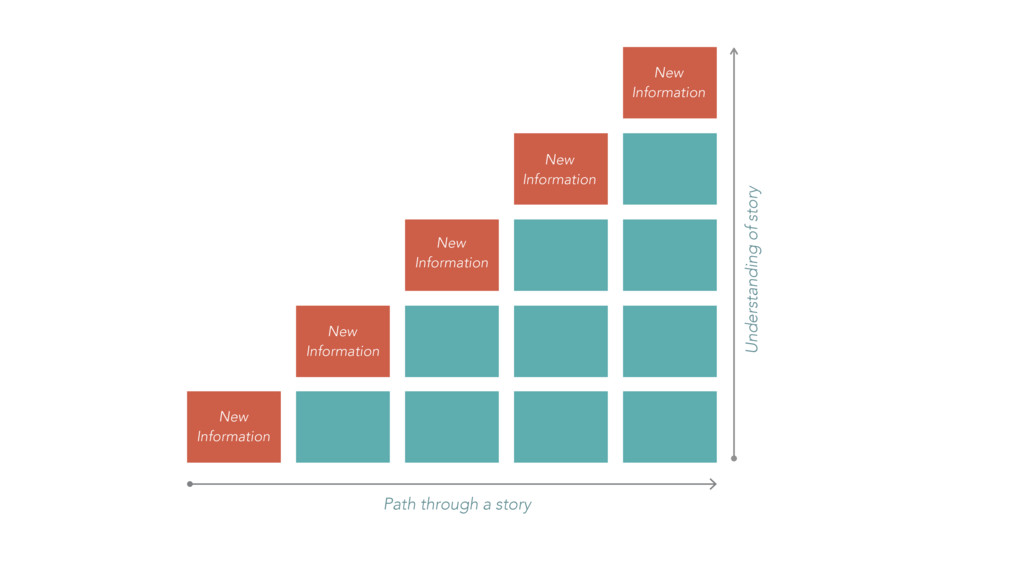
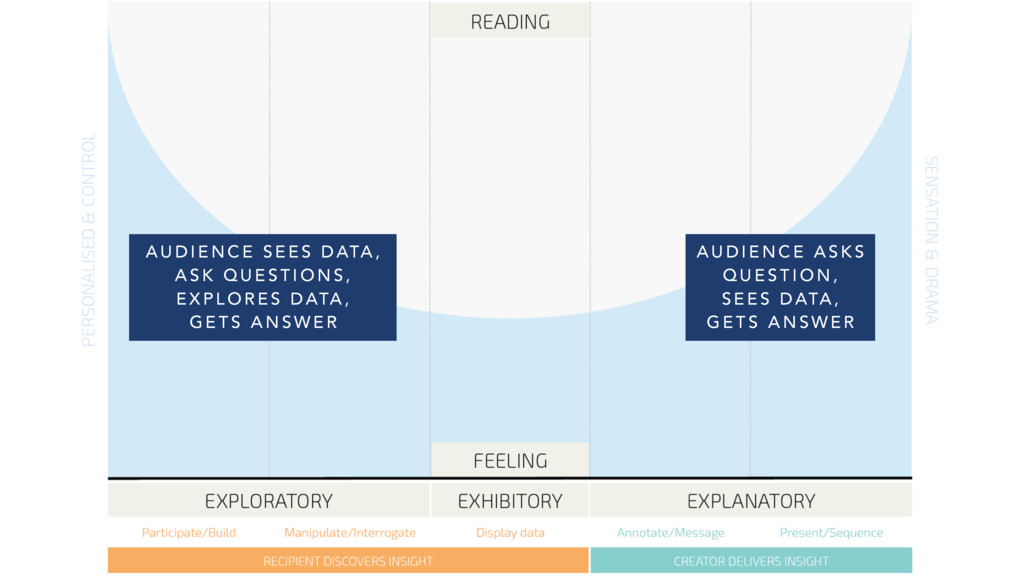
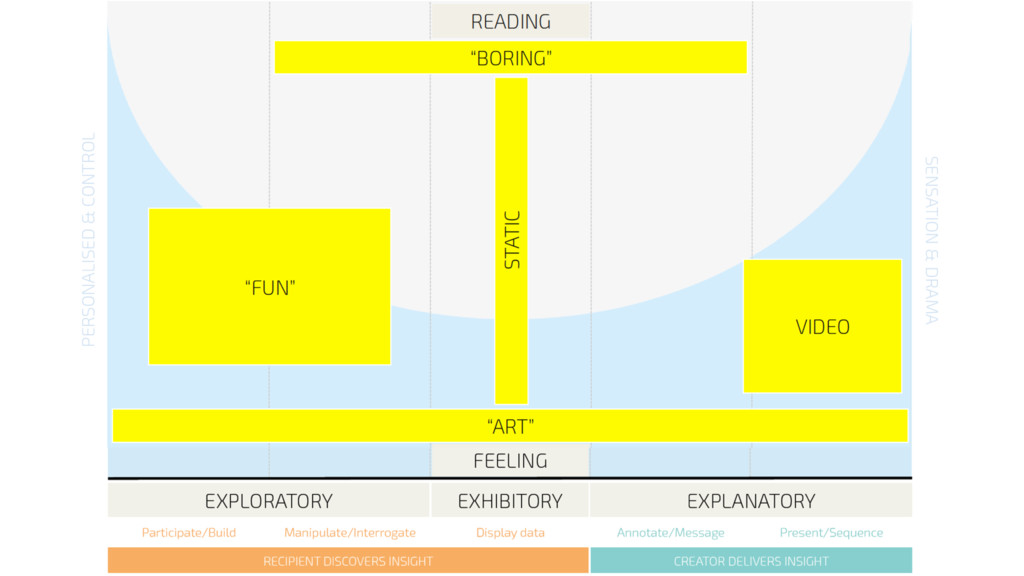
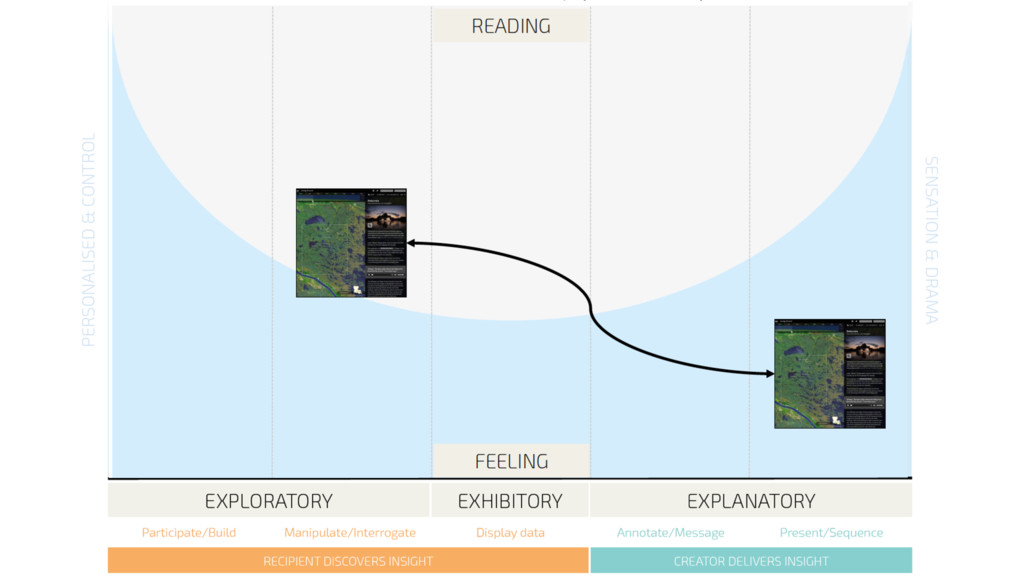
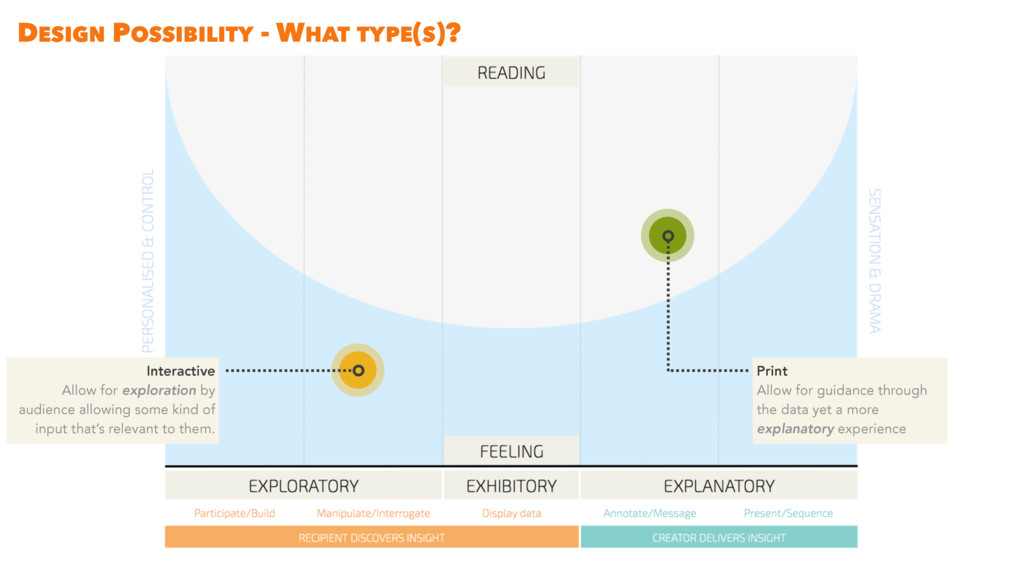
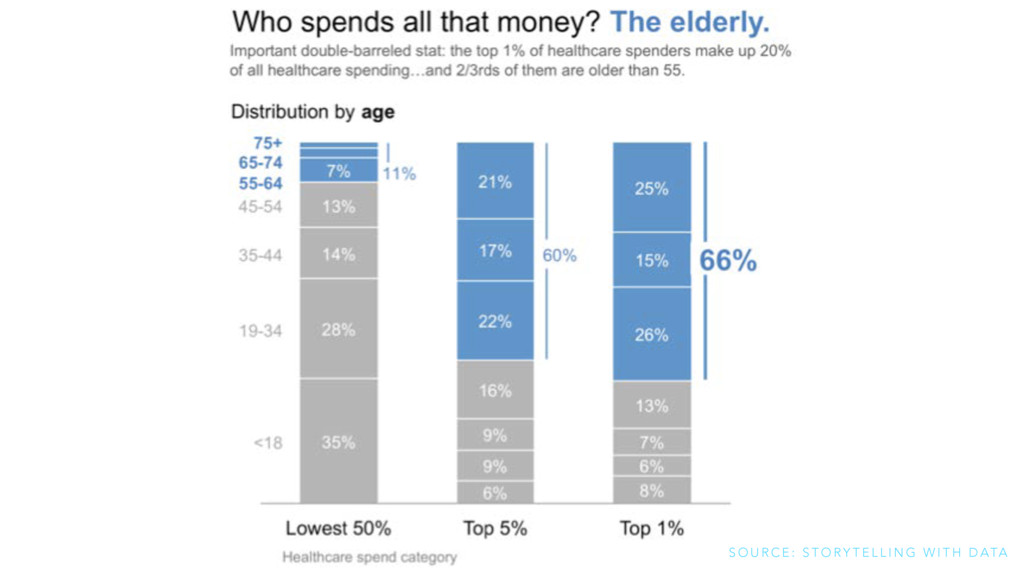
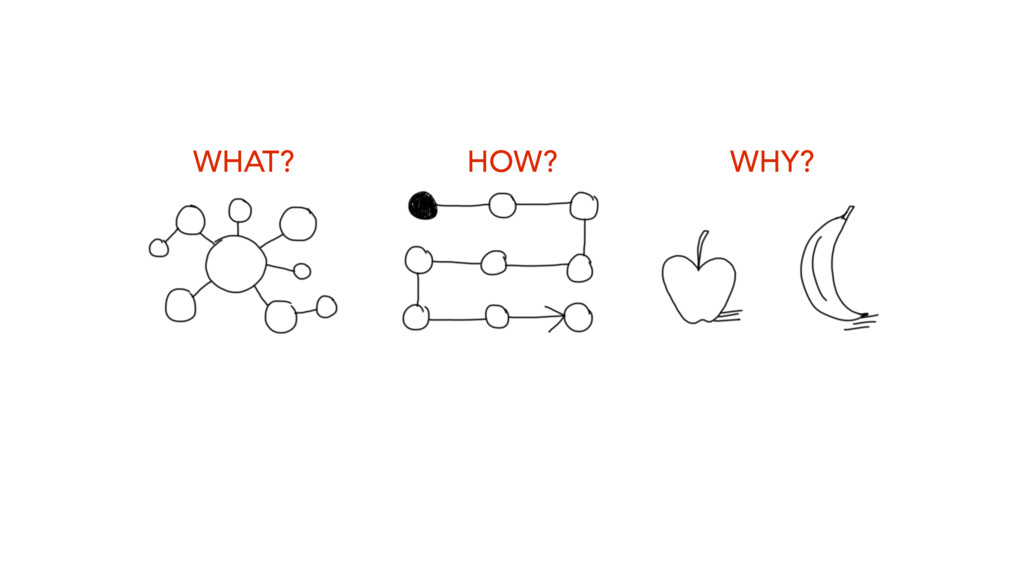
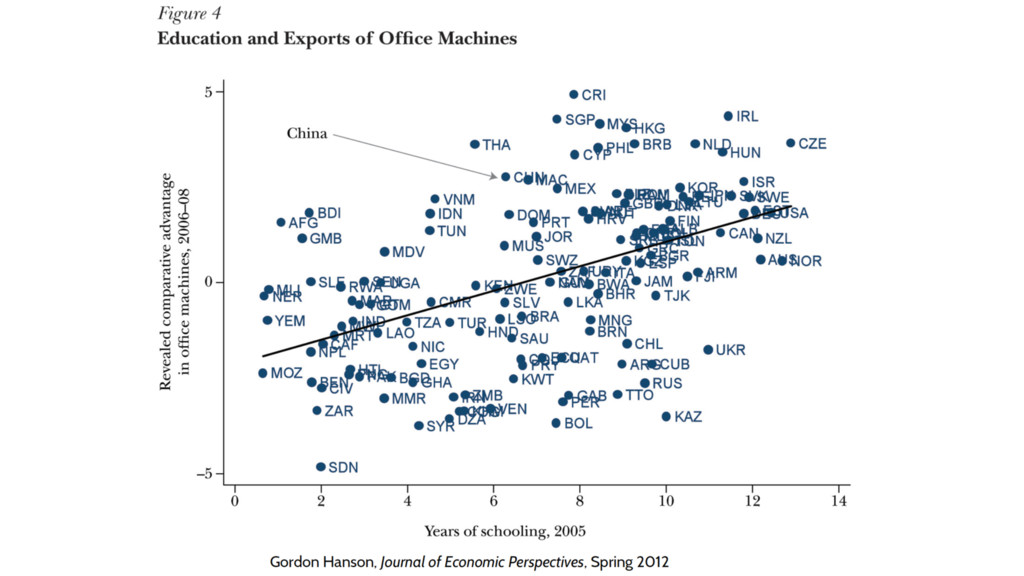
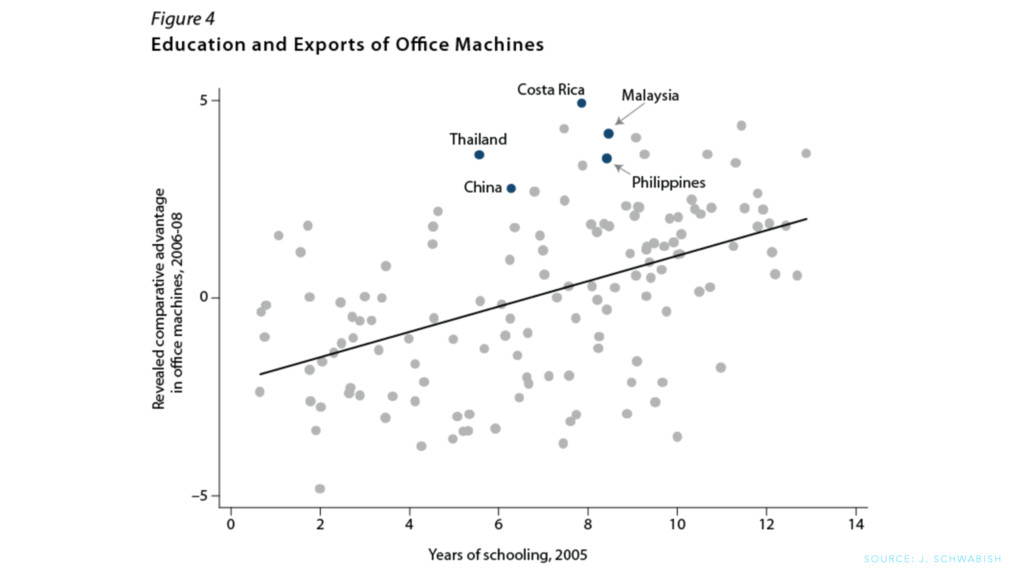
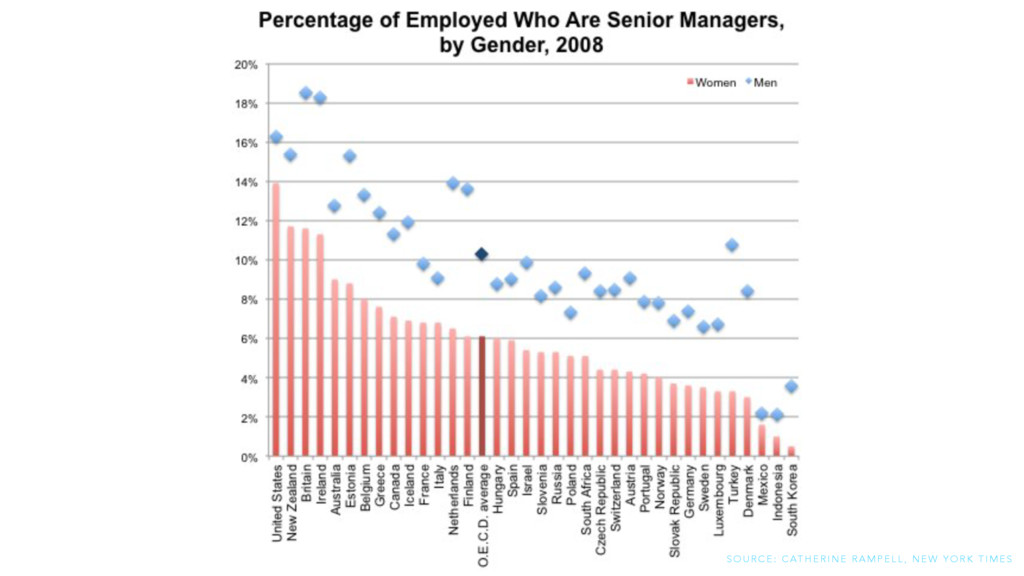
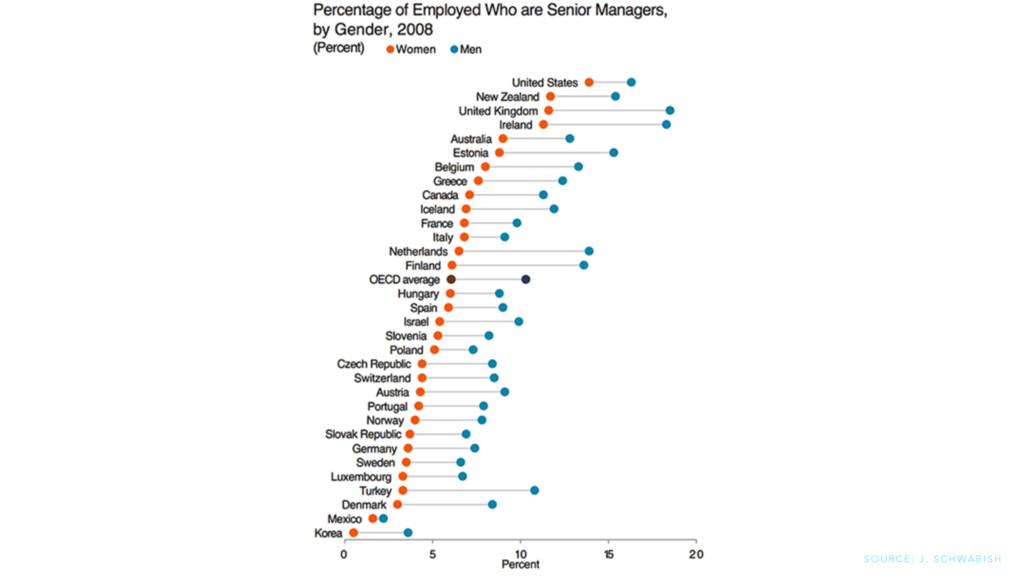
S K S Q U E S T I O N , S E E S D ATA , G E T S A N S W E R A U D I E N C E S E E S D ATA , A S K Q U E S T I O N S , E X P L O R E S D ATA , G E T S A N S W E R
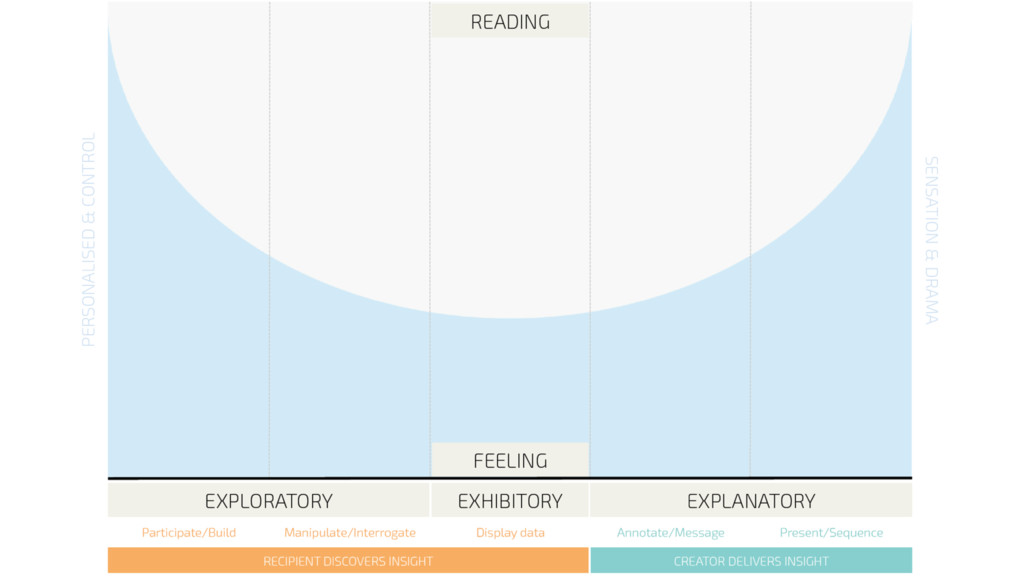
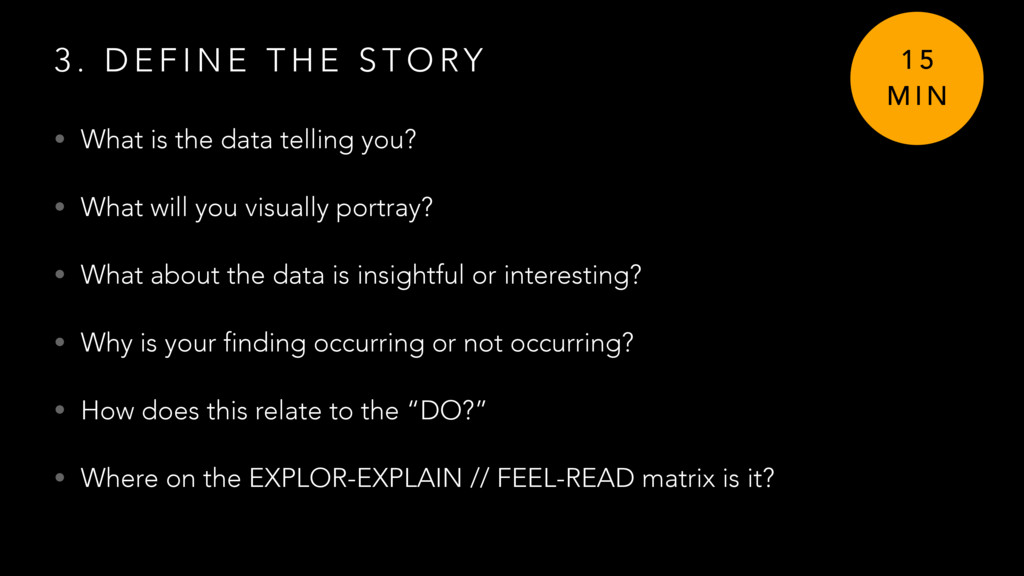
E S T O RY • What is the data telling you? • What will you visually portray? • What about the data is insightful or interesting? • Why is your finding occurring or not occurring? • How does this relate to the “DO?” • Where on the EXPLOR-EXPLAIN // FEEL-READ matrix is it? 1 5 M I N
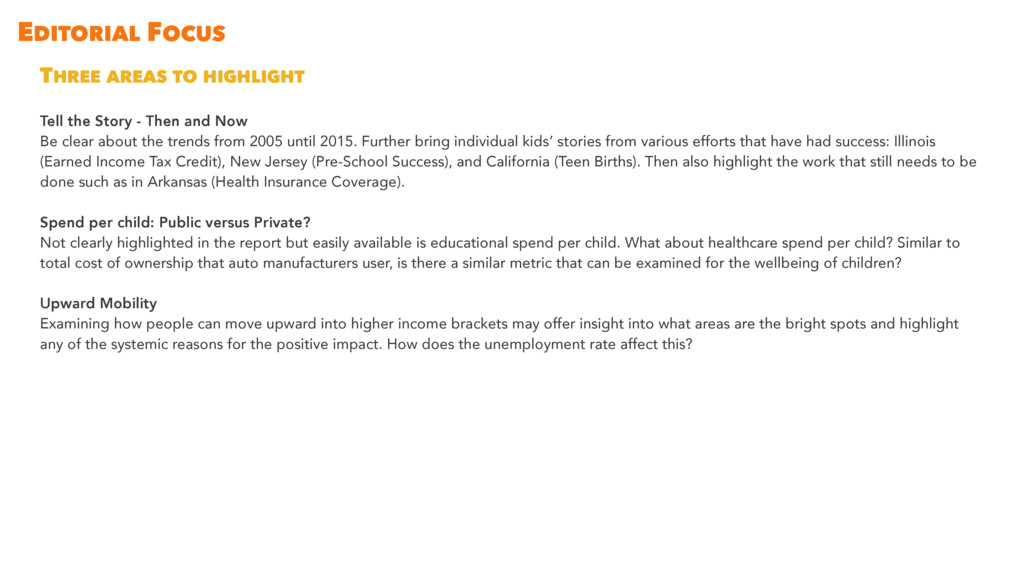
Then and Now Be clear about the trends from 2005 until 2015. Further bring individual kids’ stories from various efforts that have had success: Illinois (Earned Income Tax Credit), New Jersey (Pre-School Success), and California (Teen Births). Then also highlight the work that still needs to be done such as in Arkansas (Health Insurance Coverage). Spend per child: Public versus Private? Not clearly highlighted in the report but easily available is educational spend per child. What about healthcare spend per child? Similar to total cost of ownership that auto manufacturers user, is there a similar metric that can be examined for the wellbeing of children? Upward Mobility Examining how people can move upward into higher income brackets may offer insight into what areas are the bright spots and highlight any of the systemic reasons for the positive impact. How does the unemployment rate affect this?
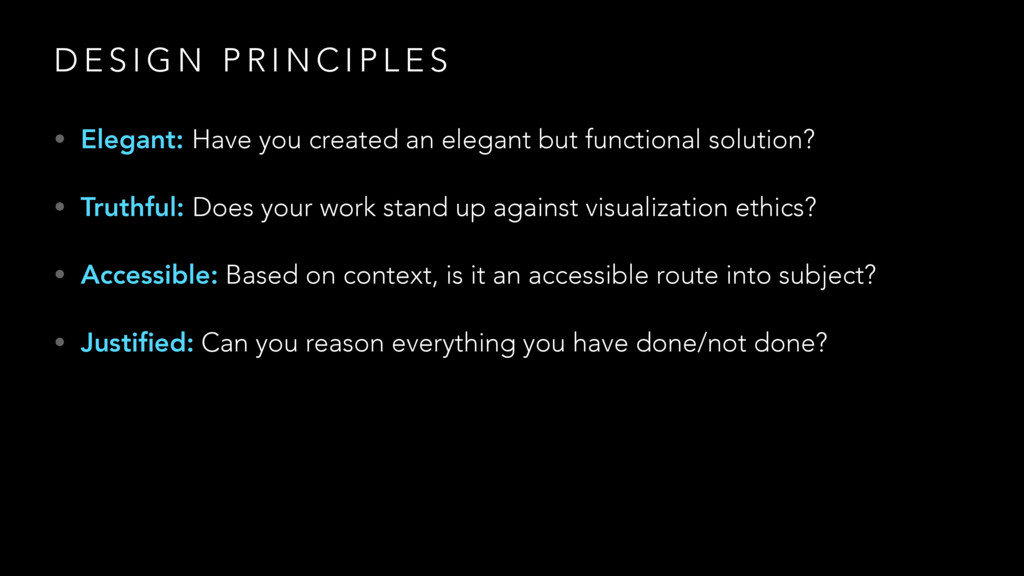
C I P L E S • Elegant: Have you created an elegant but functional solution? • Truthful: Does your work stand up against visualization ethics? • Accessible: Based on context, is it an accessible route into subject? • Justified: Can you reason everything you have done/not done?
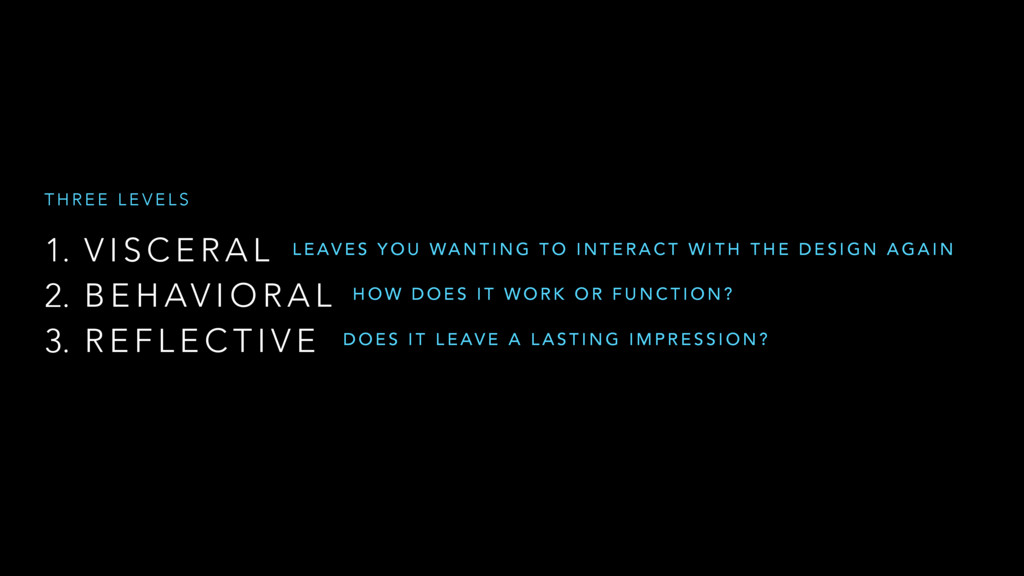
B E H AV I O R A L 3. R E F L E C T I V E T H R E E L E V E L S D O E S I T L E AV E A L A S T I N G I M P R E S S I O N ? H O W D O E S I T W O R K O R F U N C T I O N ? L E AV E S Y O U WA N T I N G T O I N T E R A C T W I T H T H E D E S I G N A G A I N
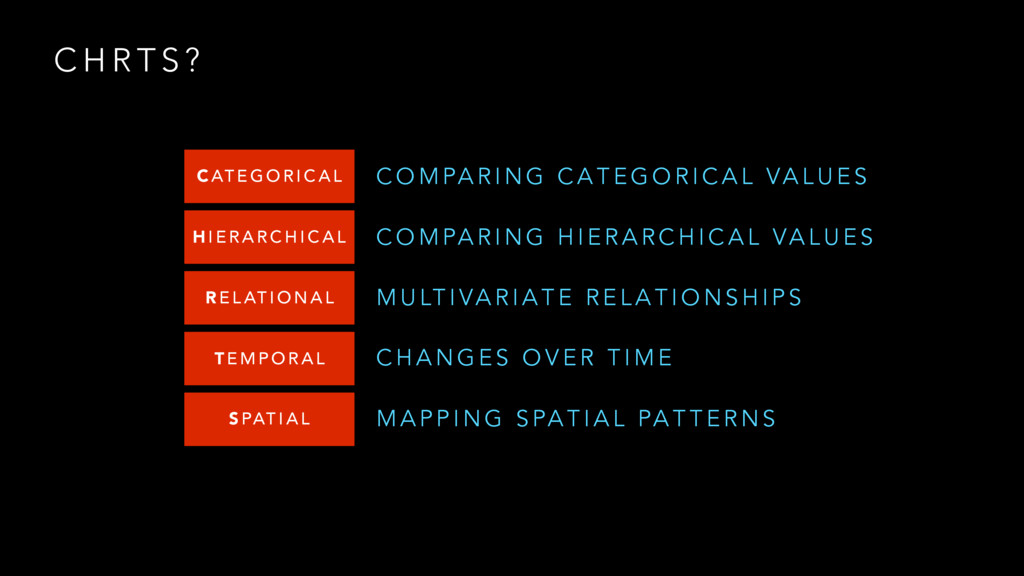
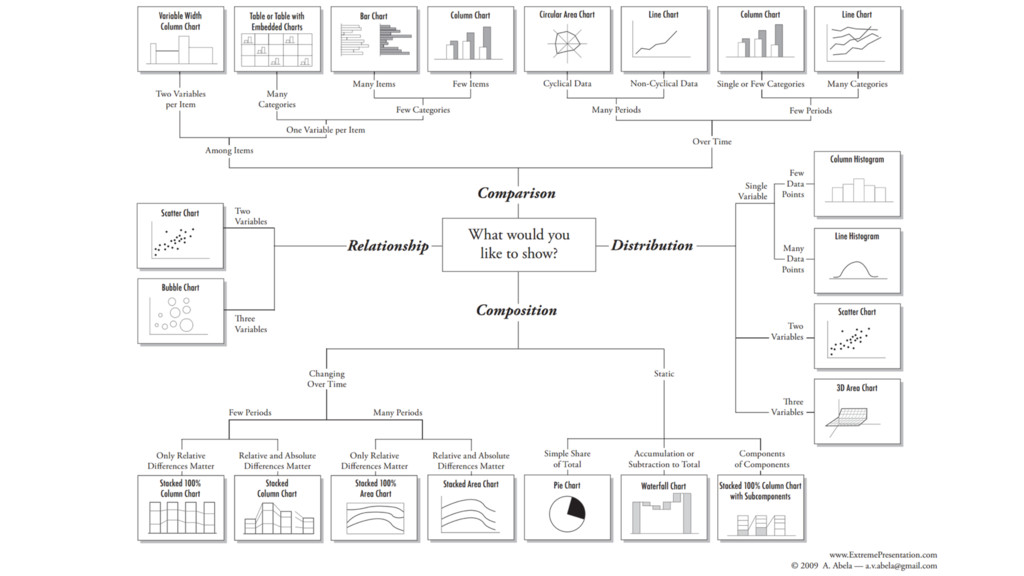
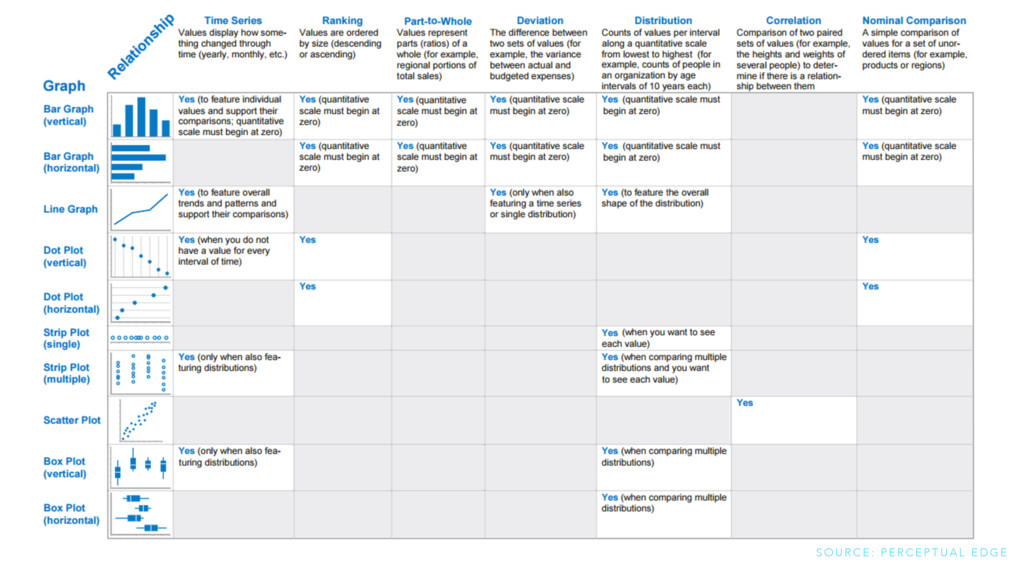
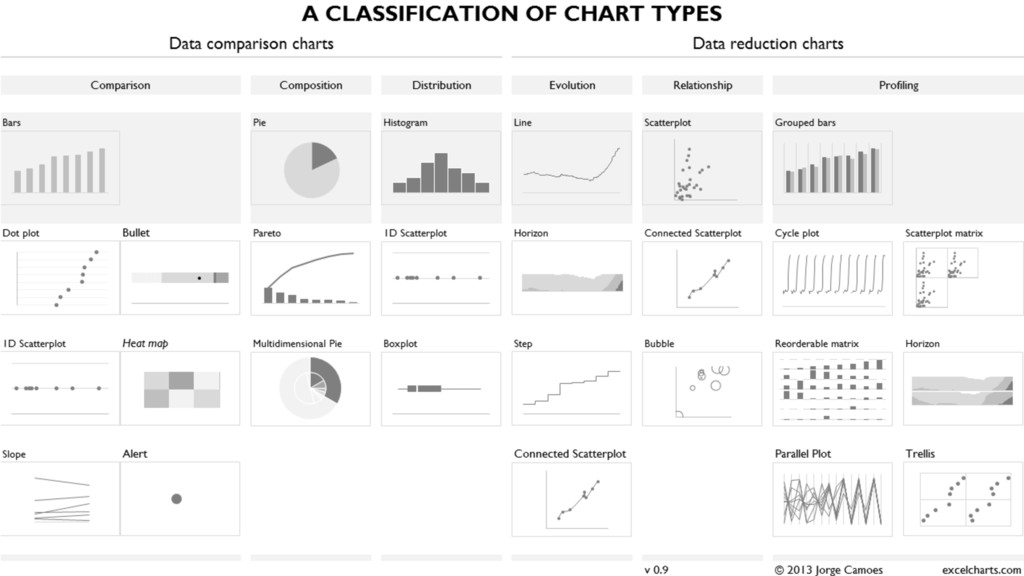
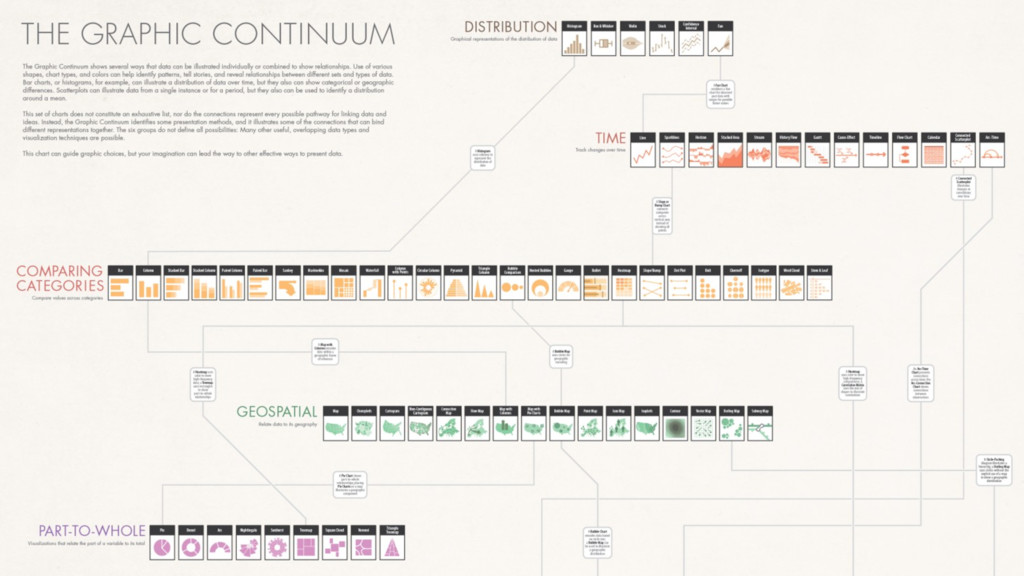
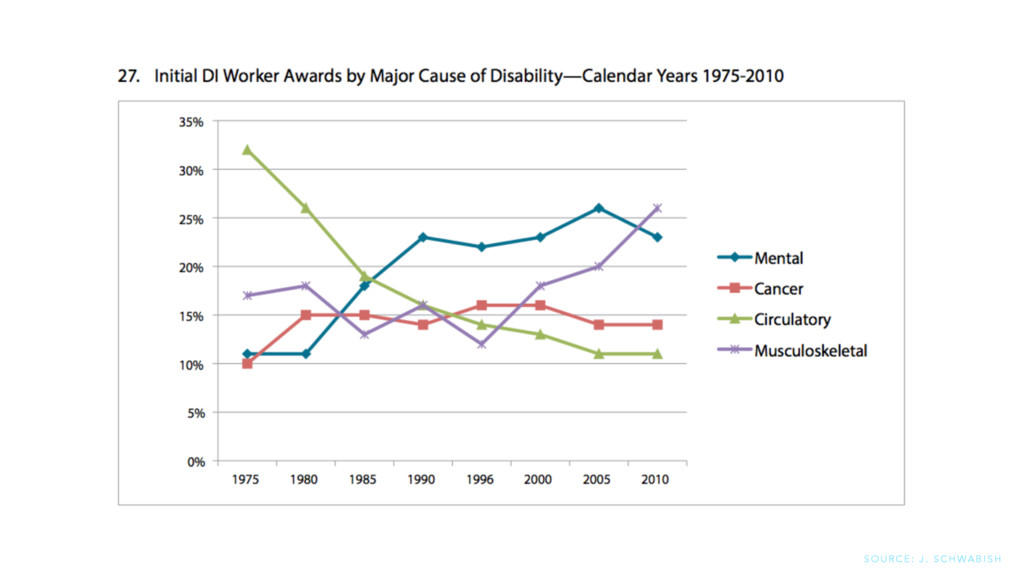
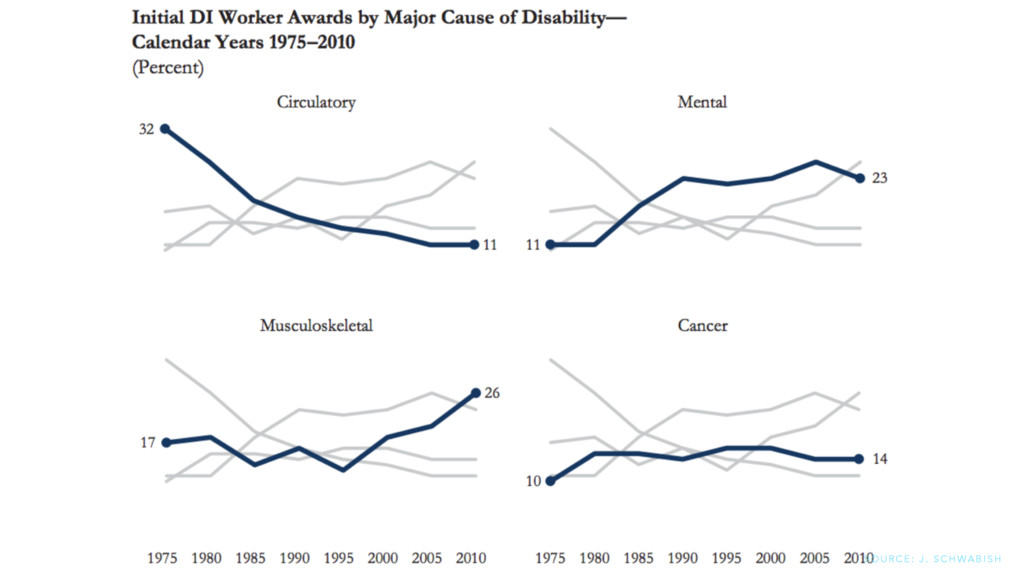
O R I C A L H I E R A R C H I C A L R E L AT I O N A L C O M PA R I N G C A T E G O R I C A L VA L U E S C O M PA R I N G H I E R A R C H I C A L VA L U E S M U LT I VA R I A T E R E L A T I O N S H I P S T E M P O R A L C H A N G E S O V E R T I M E S PAT I A L M A P P I N G S PA T I A L PA T T E R N S
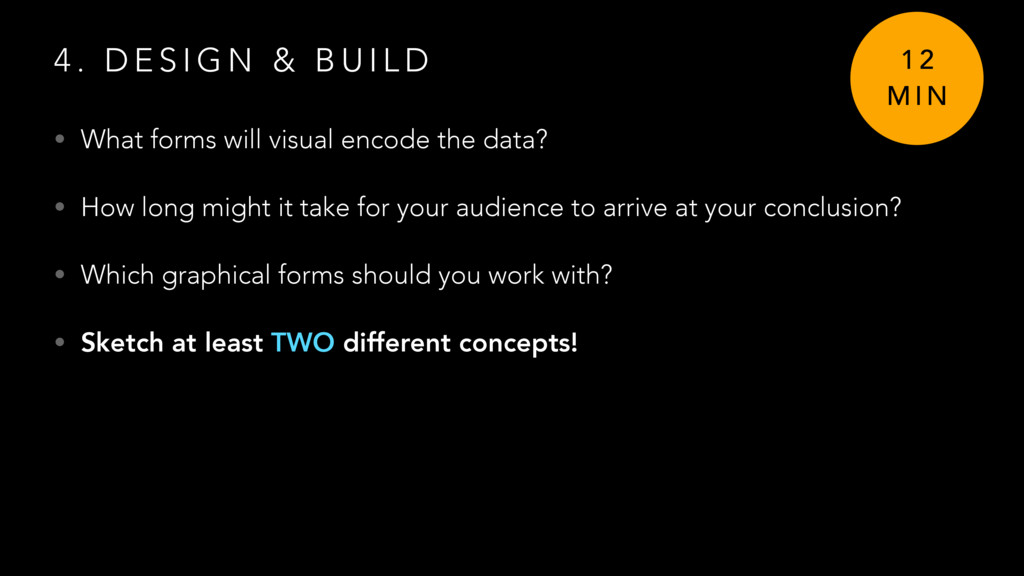
U I L D • What forms will visual encode the data? • How long might it take for your audience to arrive at your conclusion? • Which graphical forms should you work with? • Sketch at least TWO different concepts! 1 2 M I N
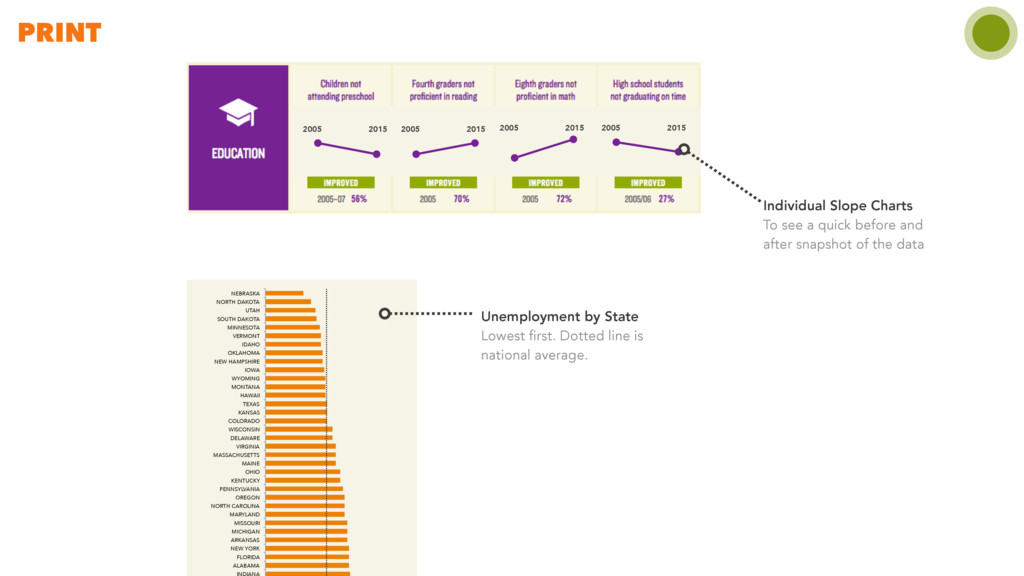
before and after snapshot of the data 2005 2015 2005 2015 2005 2015 INDIANA ALABAMA FLORIDA NEW YORK ARKANSAS MICHIGAN MISSOURI MARYLAND NORTH CAROLINA OREGON PENNSYLVANIA KENTUCKY OHIO MAINE MASSACHUSETTS VIRGINIA DELAWARE WISCONSIN COLORADO KANSAS TEXAS HAWAII MONTANA WYOMING IOWA NEW HAMPSHIRE OKLAHOMA IDAHO VERMONT MINNESOTA SOUTH DAKOTA UTAH NORTH DAKOTA NEBRASKA Unemployment by State Lowest first. Dotted line is national average.
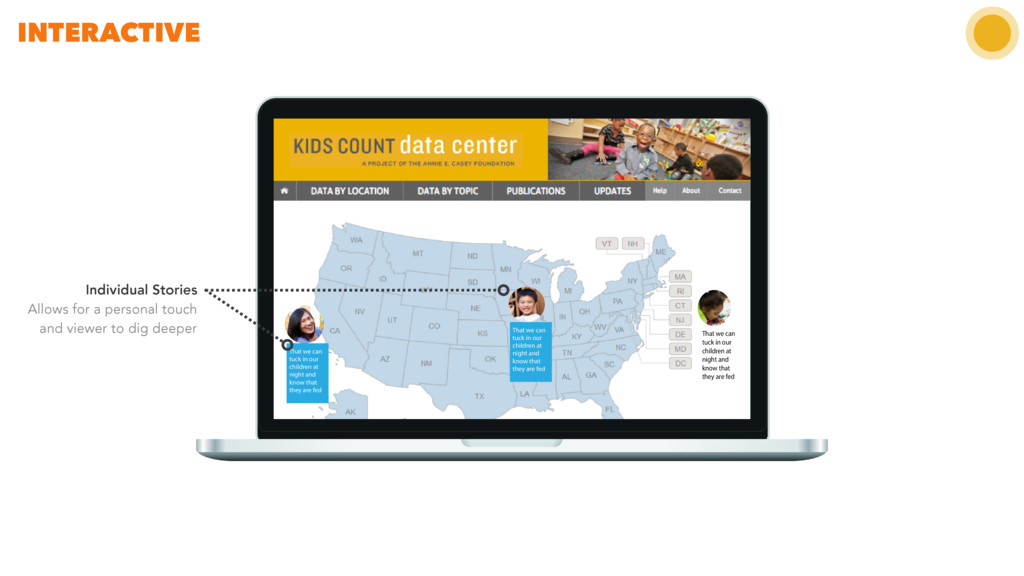
and know that they are fed That we can tuck in our children at night and know that they are fed That we can tuck in our children at night and know that they are fed Individual Stories Allows for a personal touch and viewer to dig deeper
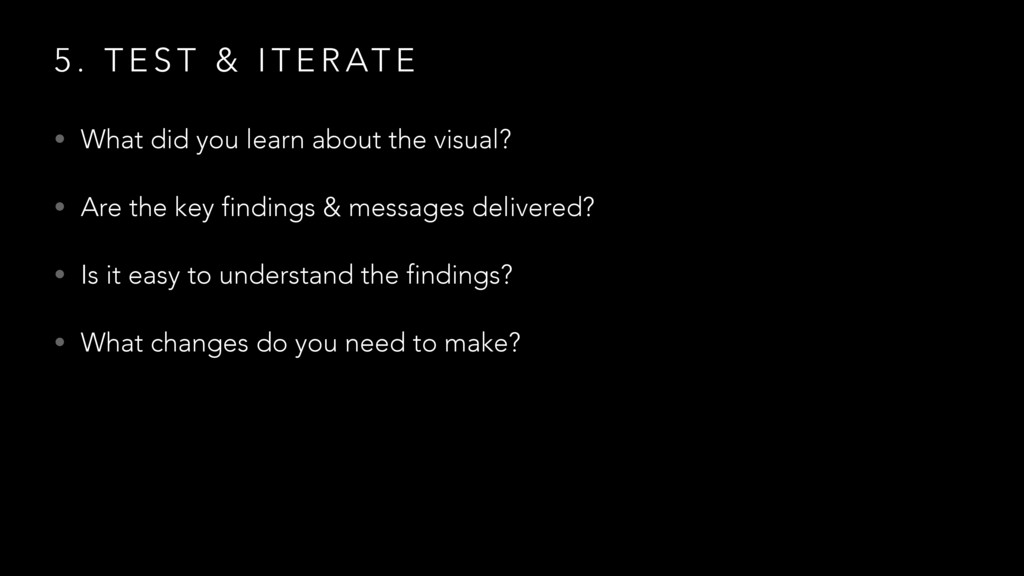
R AT E • What did you learn about the visual? • Are the key findings & messages delivered? • Is it easy to understand the findings? • What changes do you need to make?