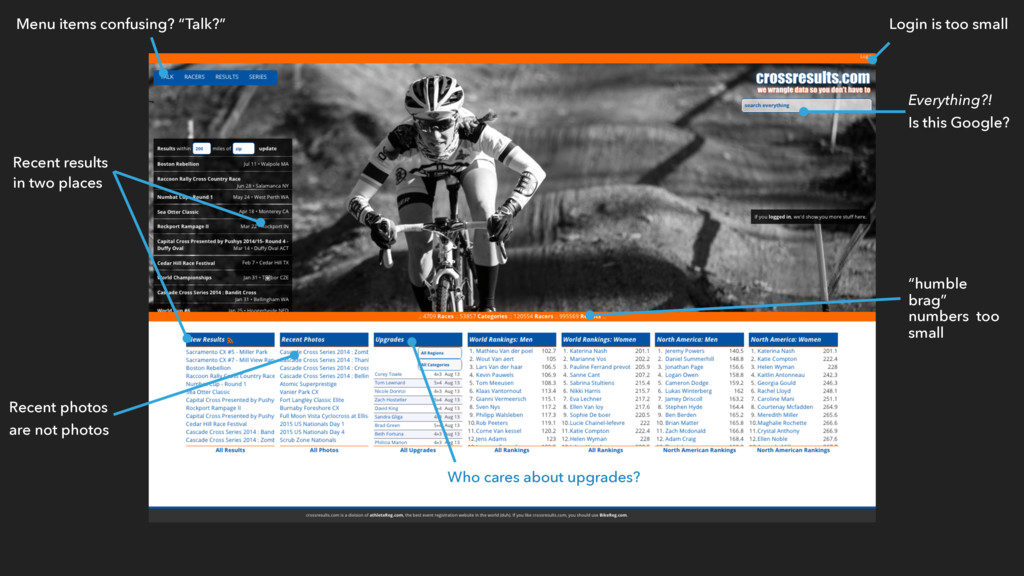
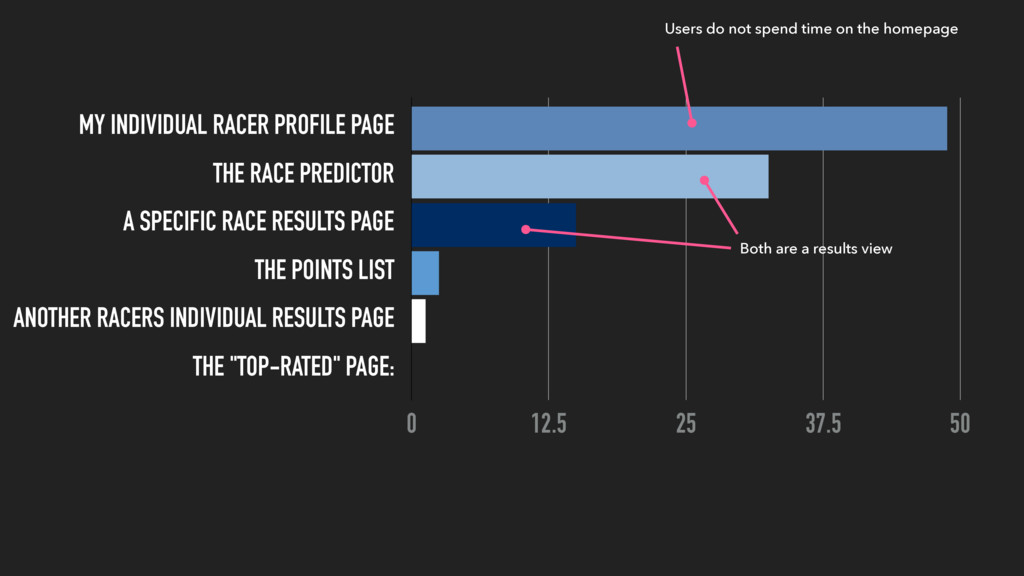
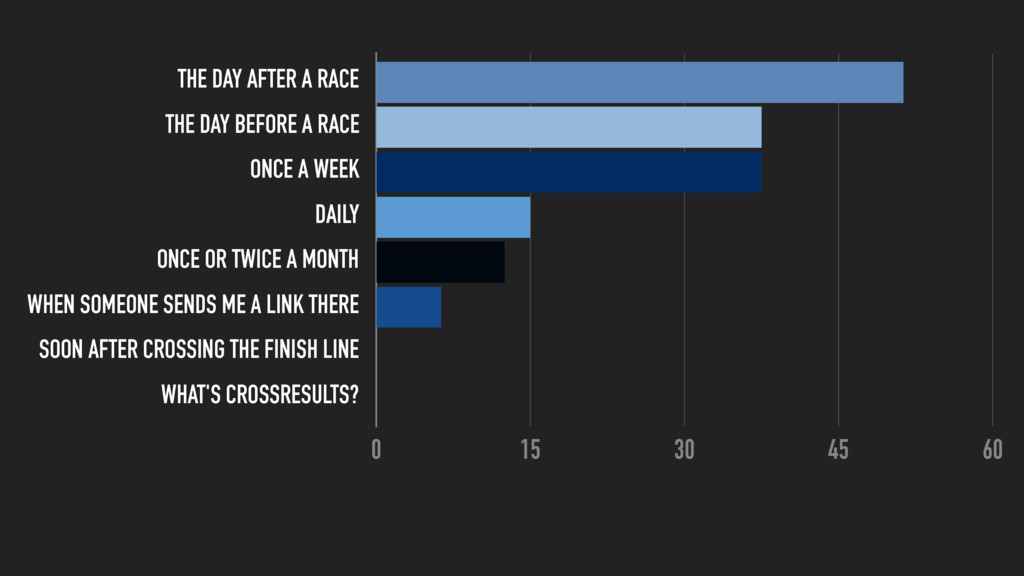
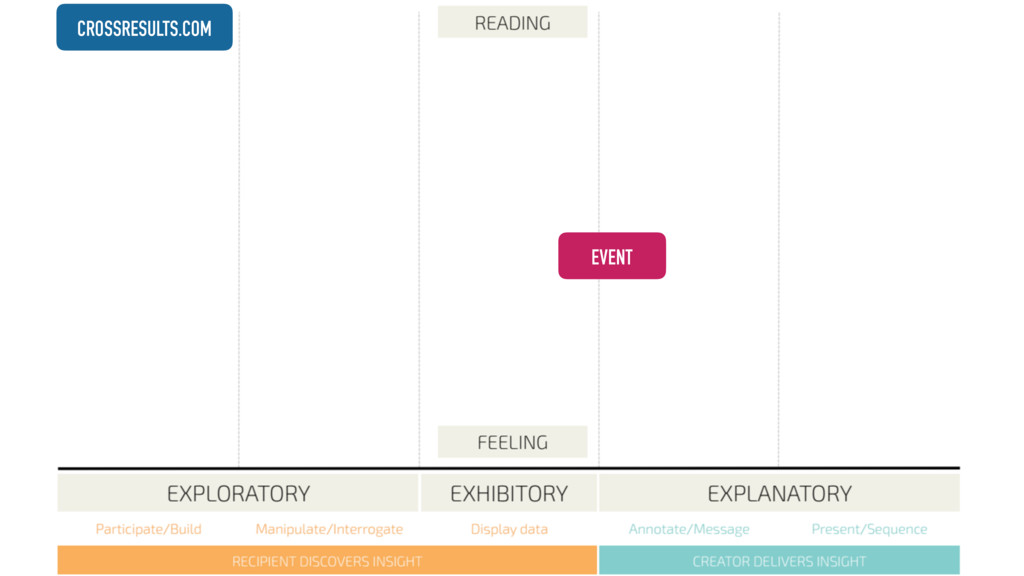
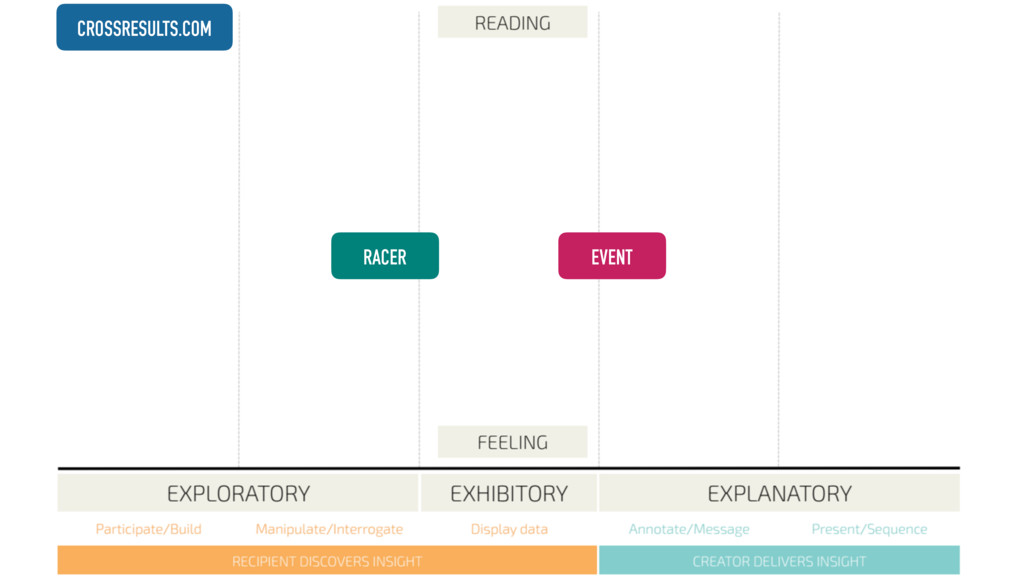
RACE RESULTS PAGE THE POINTS LIST ANOTHER RACERS INDIVIDUAL RESULTS PAGE THE "TOP-RATED" PAGE: 0 12.5 25 37.5 50 Users do not spend time on the homepage Both are a results view
RACE RESULTS PAGE THE POINTS LIST ANOTHER RACERS INDIVIDUAL RESULTS PAGE THE "TOP-RATED" PAGE: 0 12.5 25 37.5 50 Users do not spend time on the homepage Both are a results view
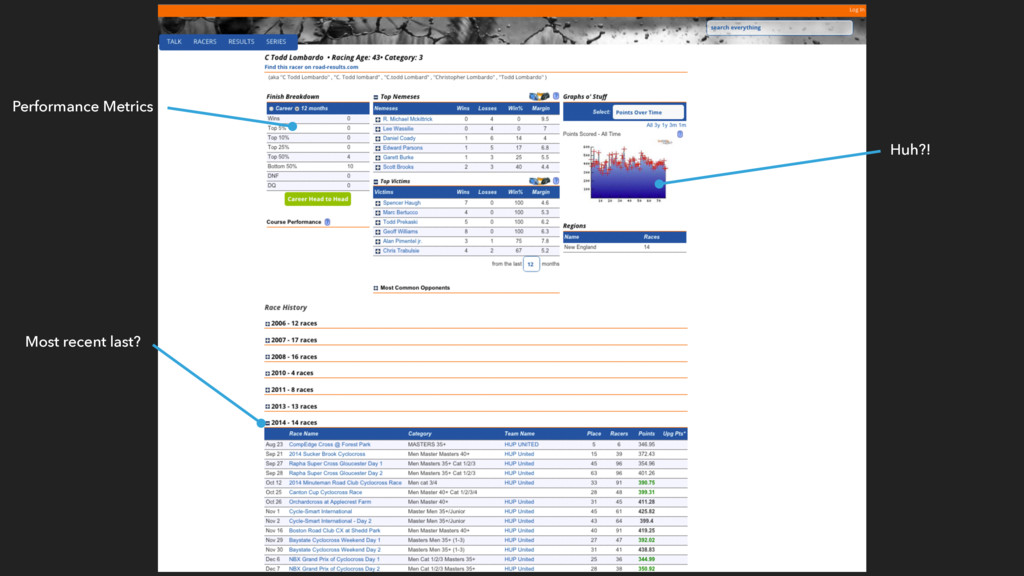
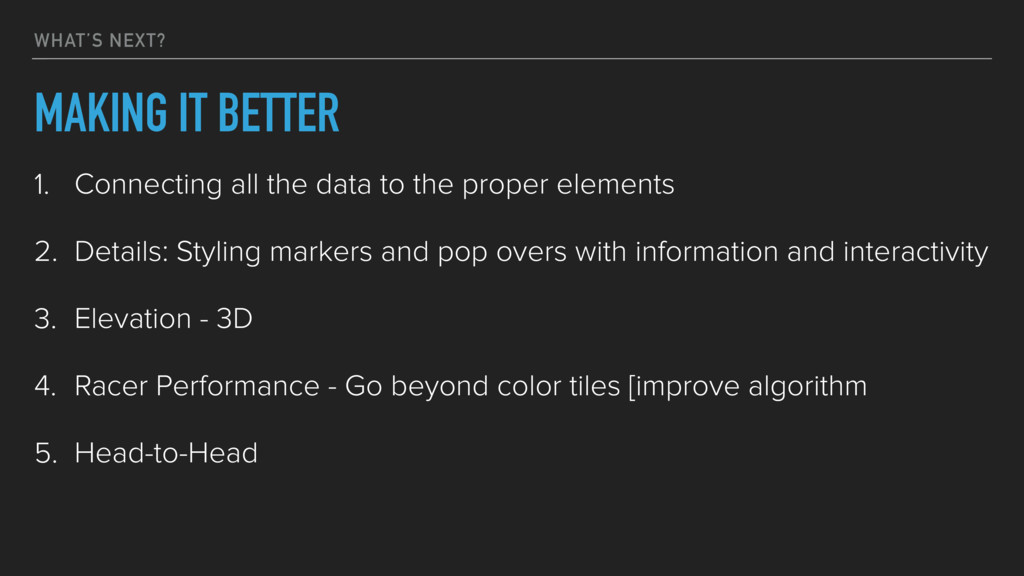
to the proper elements 2. Details: Styling markers and pop overs with information and interactivity 3. Elevation - 3D 4. Racer Performance - Go beyond color tiles [improve algorithm 5. Head-to-Head
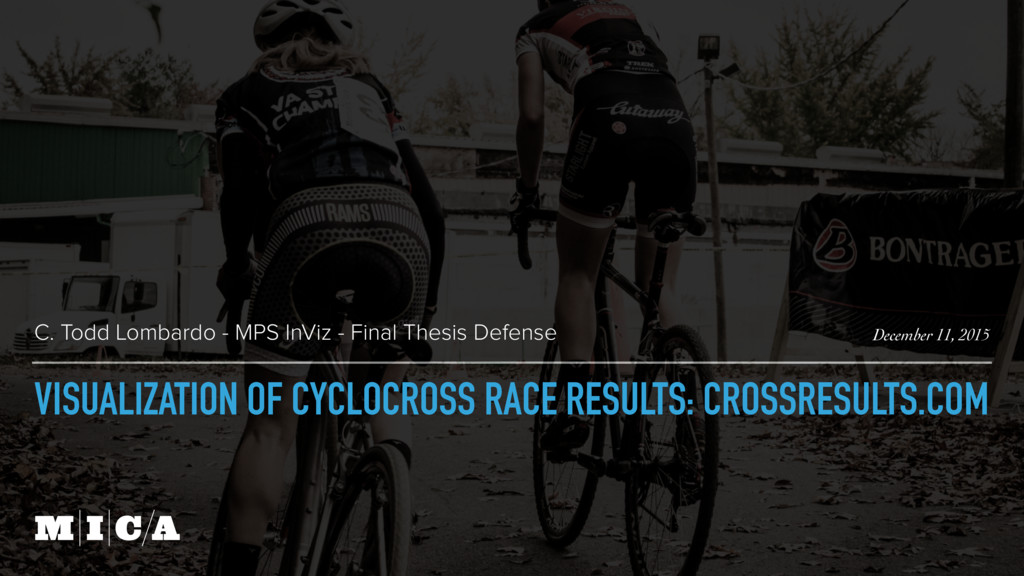
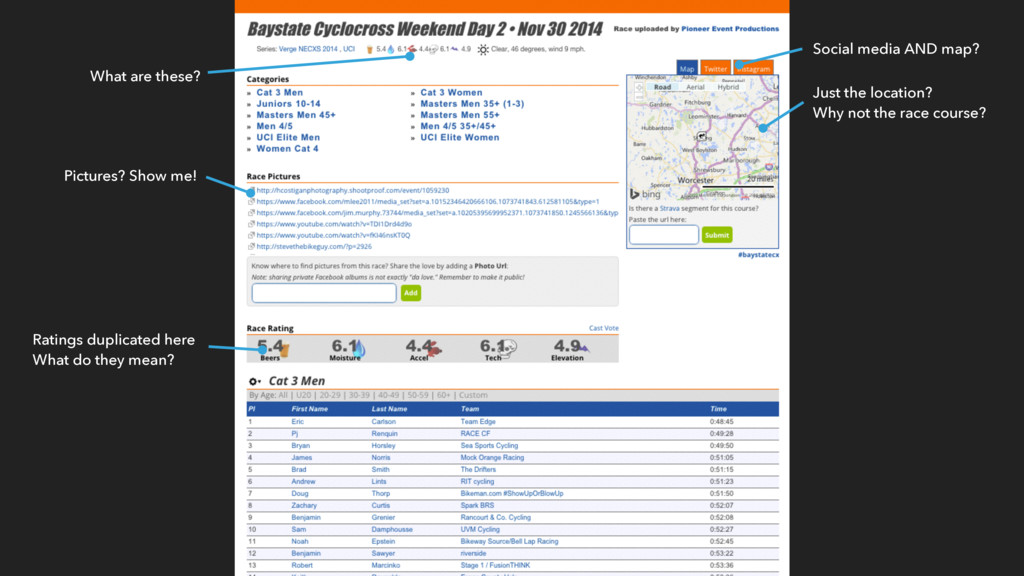
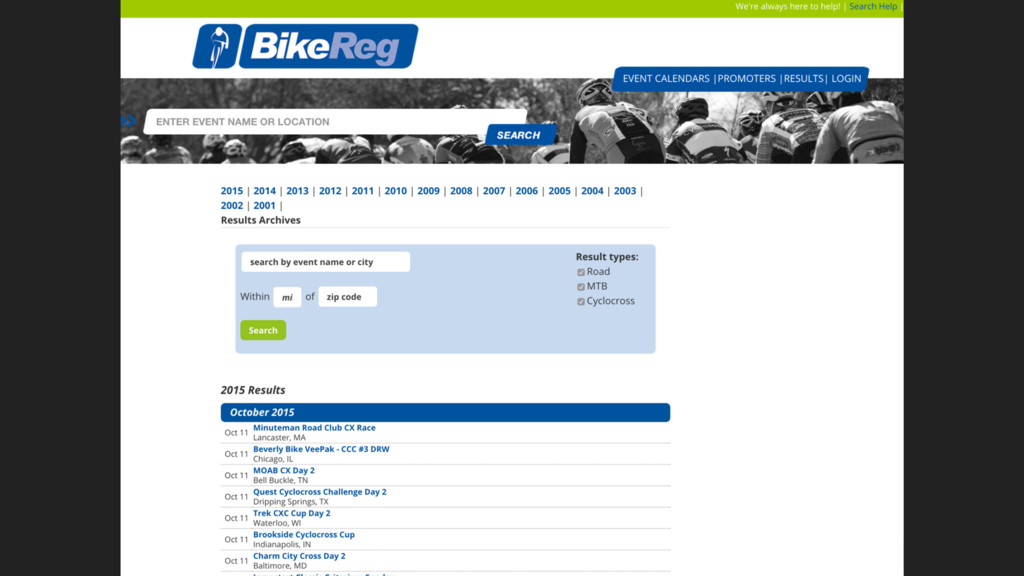
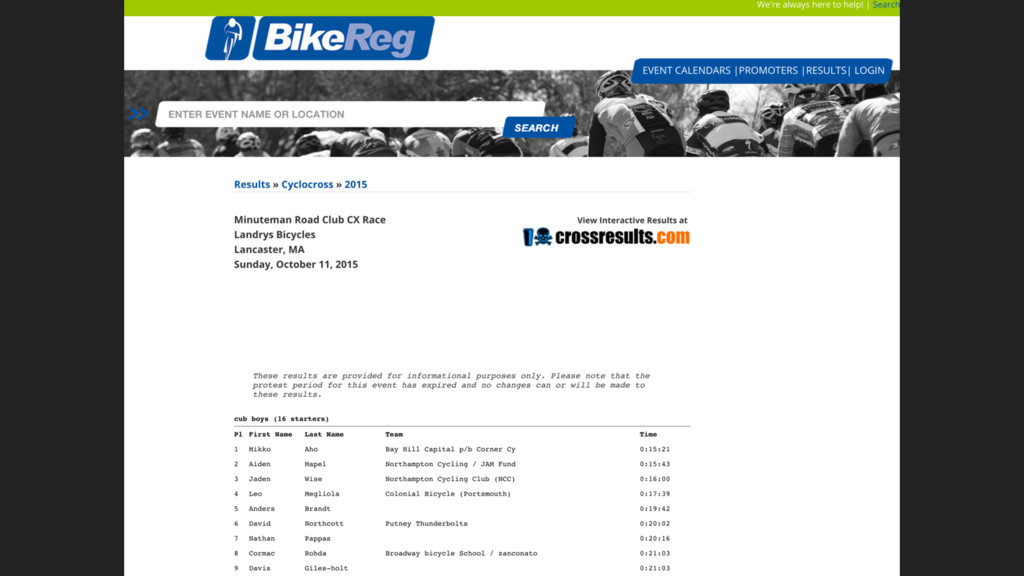
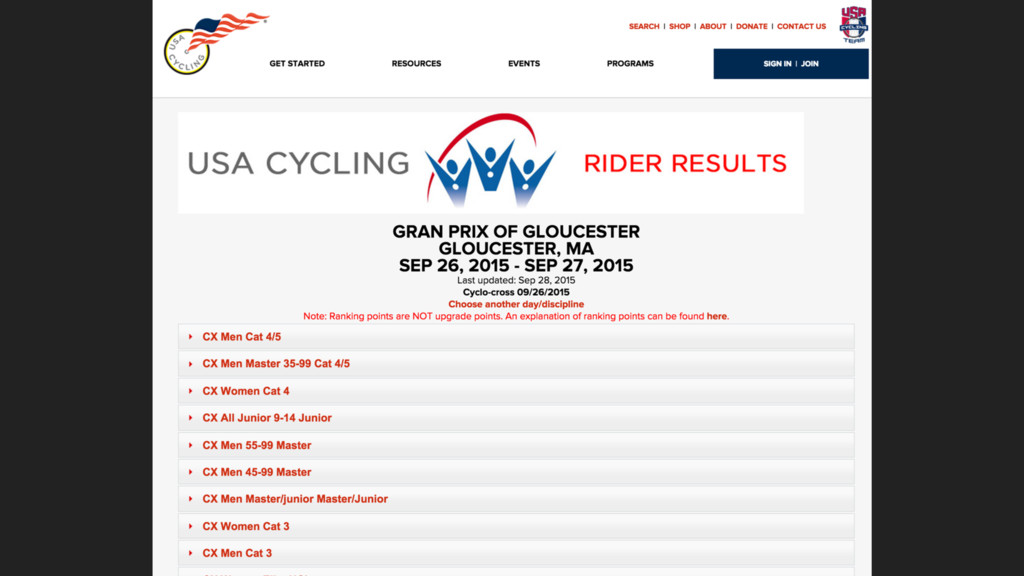
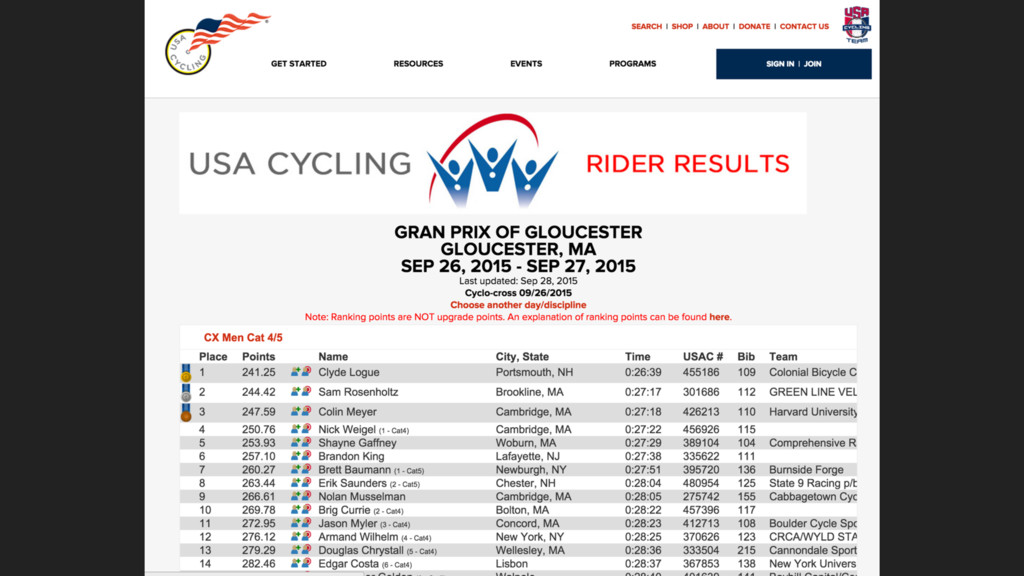
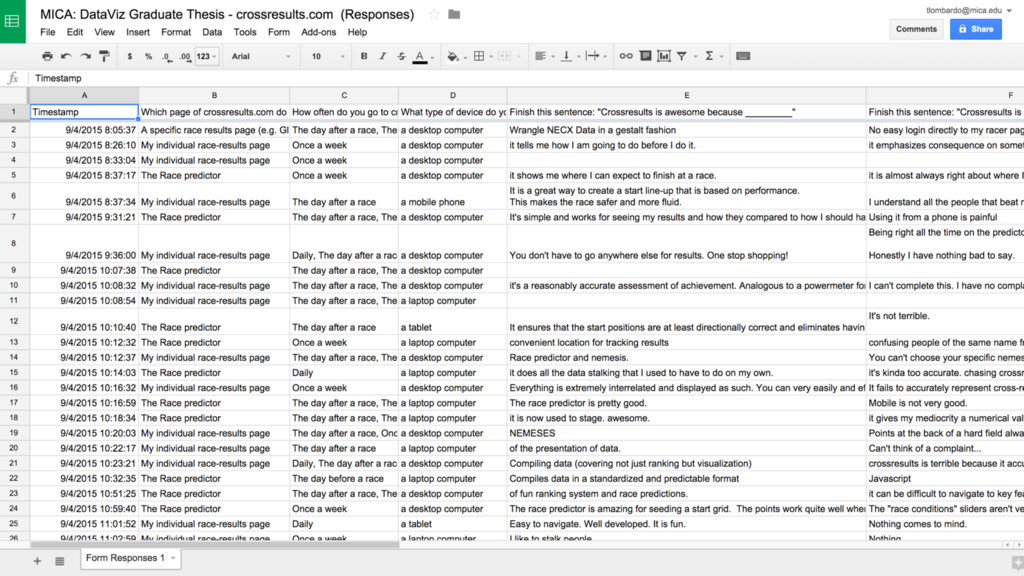
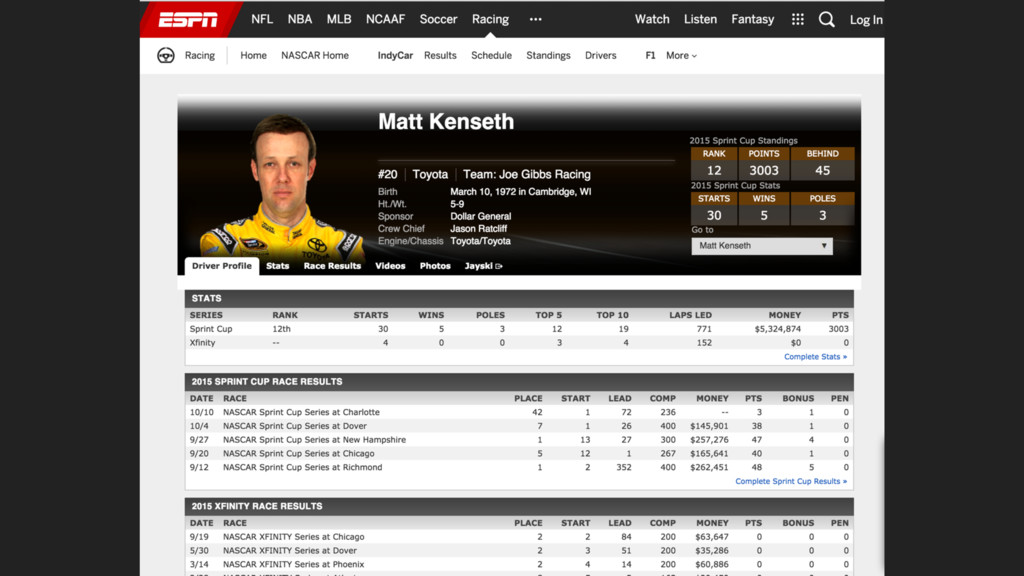
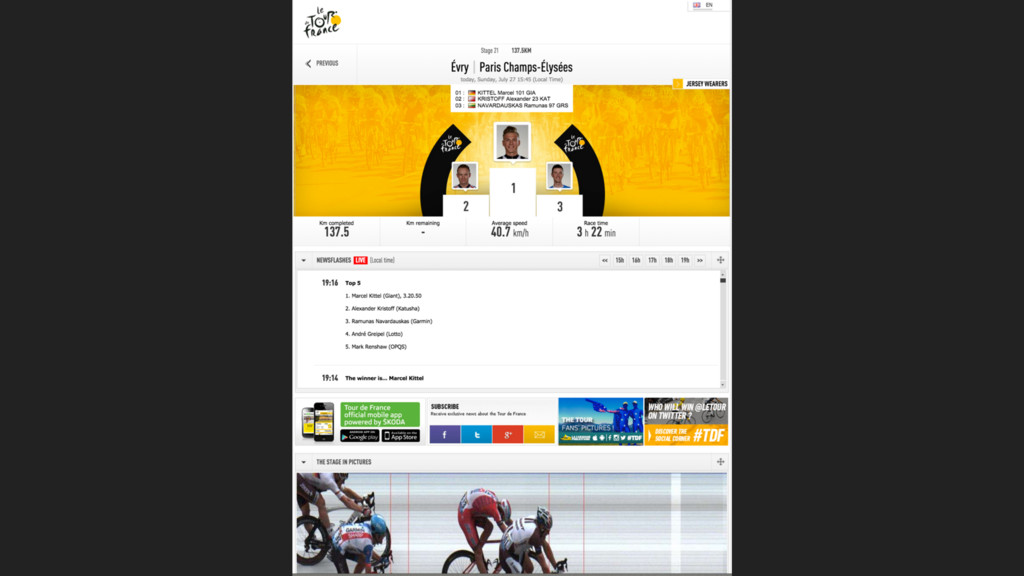
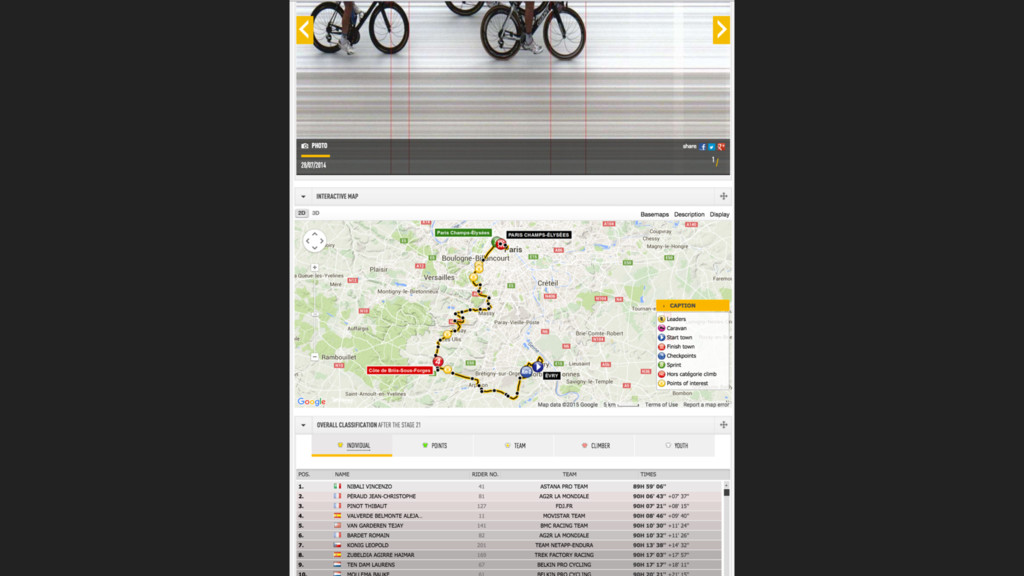
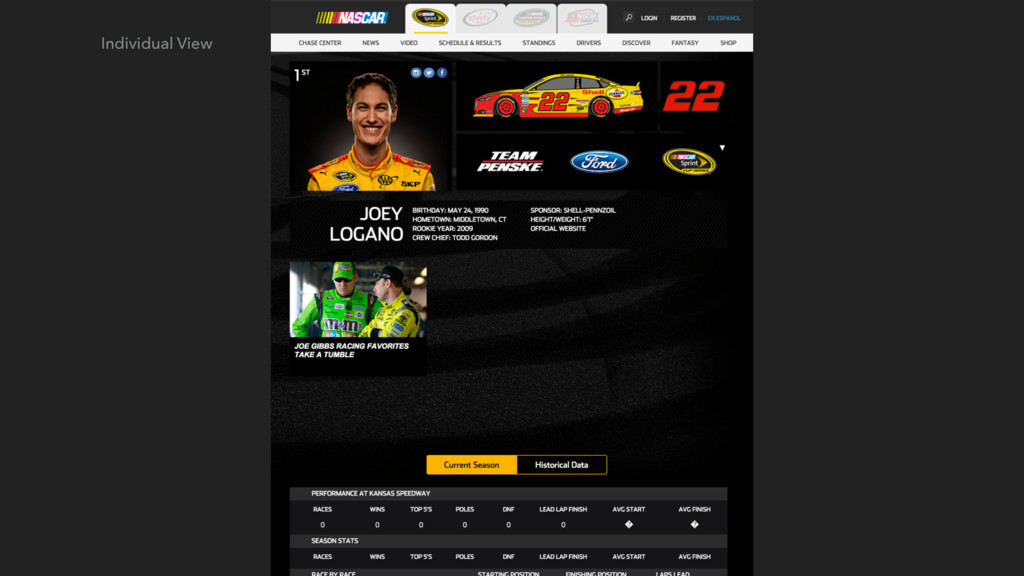
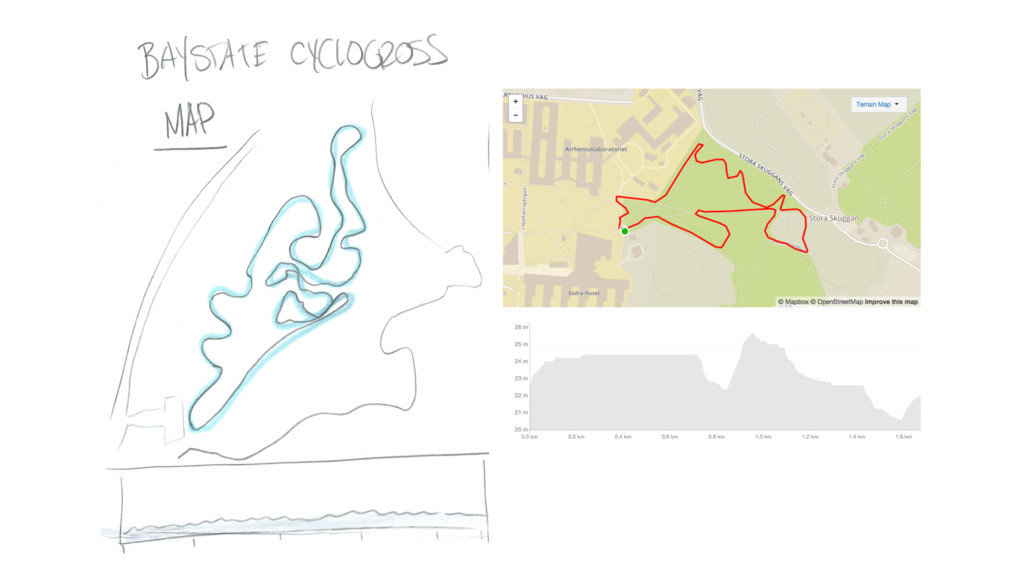
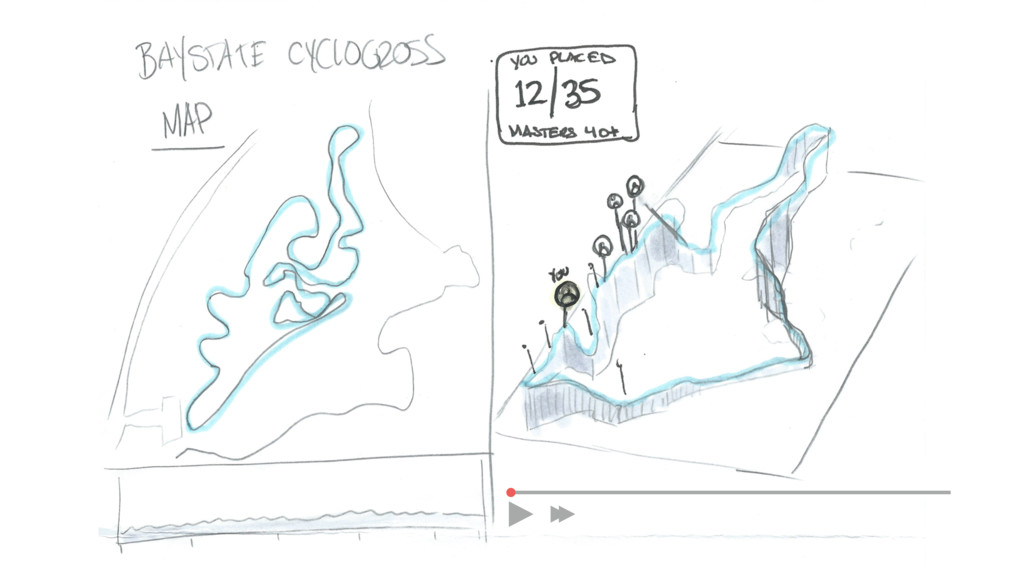
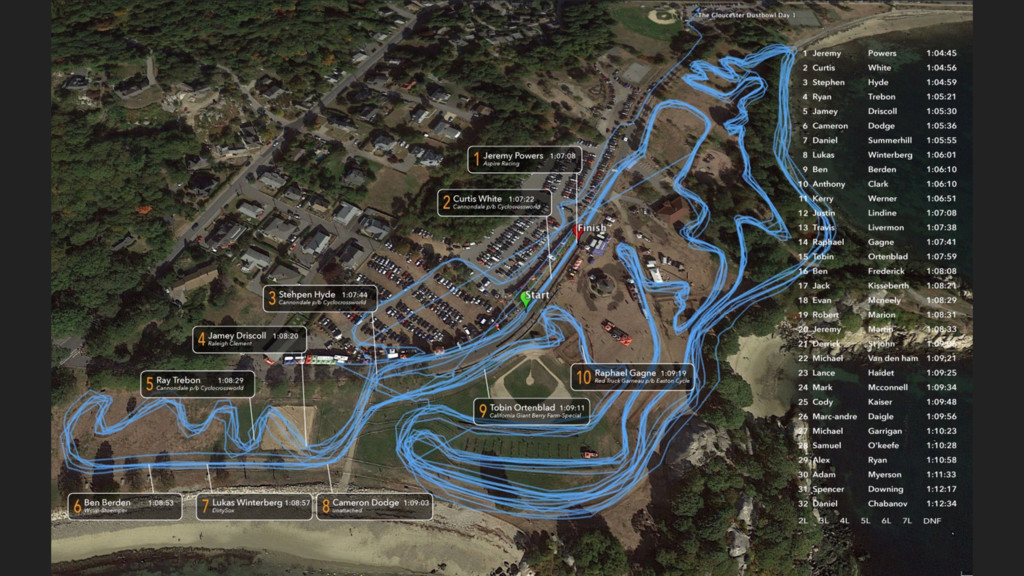
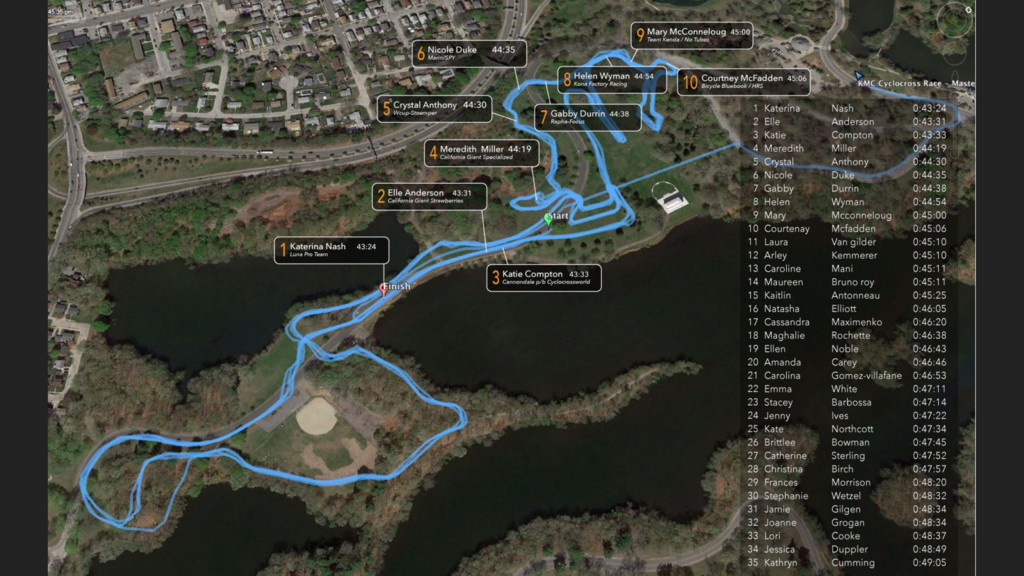
results are a common approach for timed competitions of any kind. There is little contextual information given in a simple table and a reader would have to skim up or down the results page to determine the information they seek. If the reader were a participant in the race, there may be other information useful and relevant to them as they view the results. What is Cyclocross? Cyclocross is one of the fastest growing two-wheeled sports in the USA. The races area a circuit that traverse a mix of terrains: grass, pavement, dirt, and sand while presenting obstacles for riders to overcome. Some people call it a “Steeplechase on a bike.” The races often string out over the duration of the race so the racers at the back may still “feel” like they are racing their nearest competitors. Since race courses and race weather conditions can have a sever impact on the outcome, this data could be integrated with the final visual. Results are often posted on race day as the race and a popular community website: crossresults.com which aggregates the results for any racer to see their own history as well as compare themselves to others. There are far more recreational amateur level, even though competitive, racers than there are professionals at the elite level. While there may be one elite mens and women’s race categories there are often 12 additional categories of races for a wider range of ages and ability levels to participate. Enrichment and prediction Tabular race results provide little context nor do they give a sense of how a racer, fared among their peers over time. Aggregation of cyclocross race data over time can yield a data set which could predict how well racers may do in future races. This information may be interesting for those who are competitive at heart.
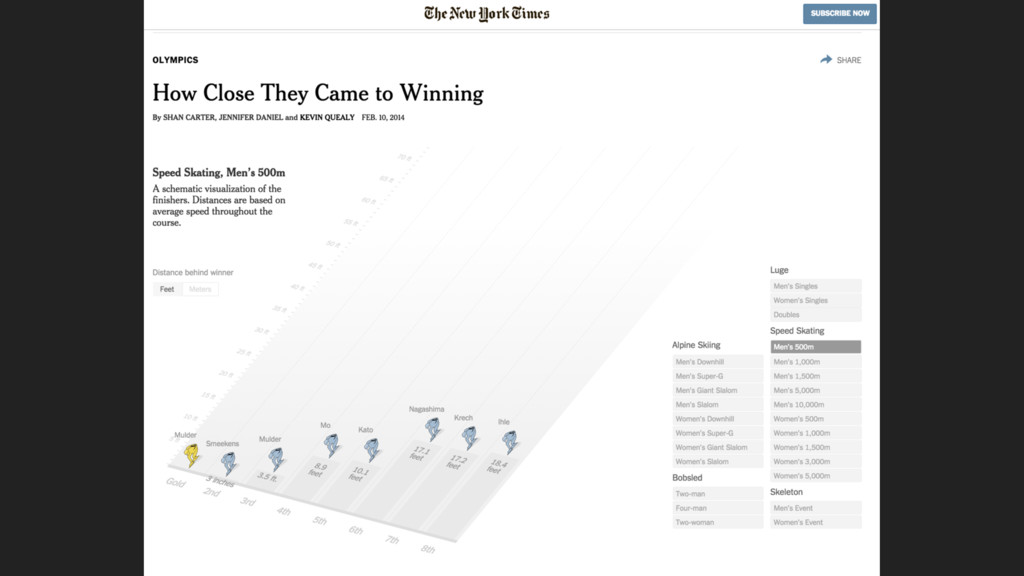
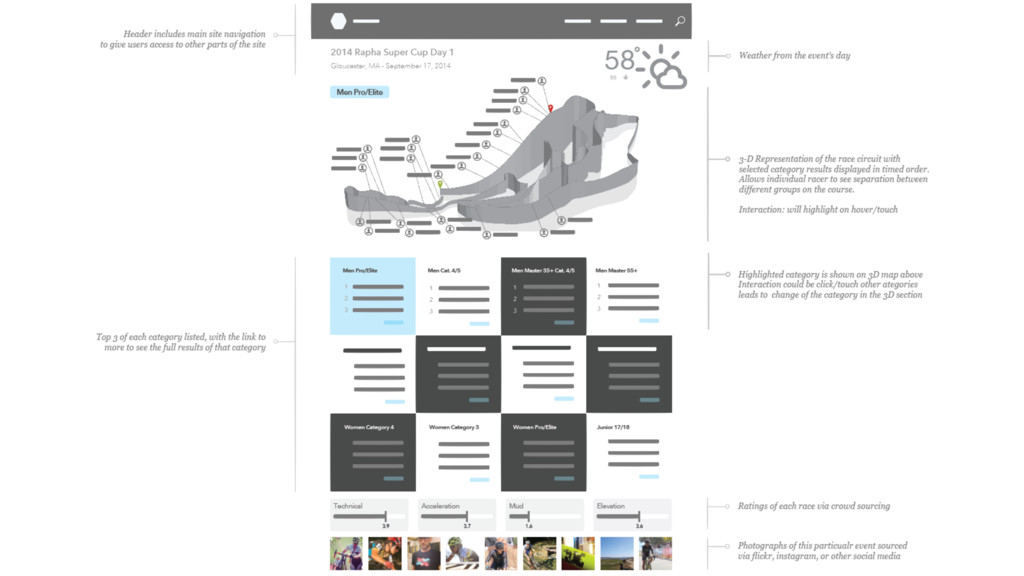
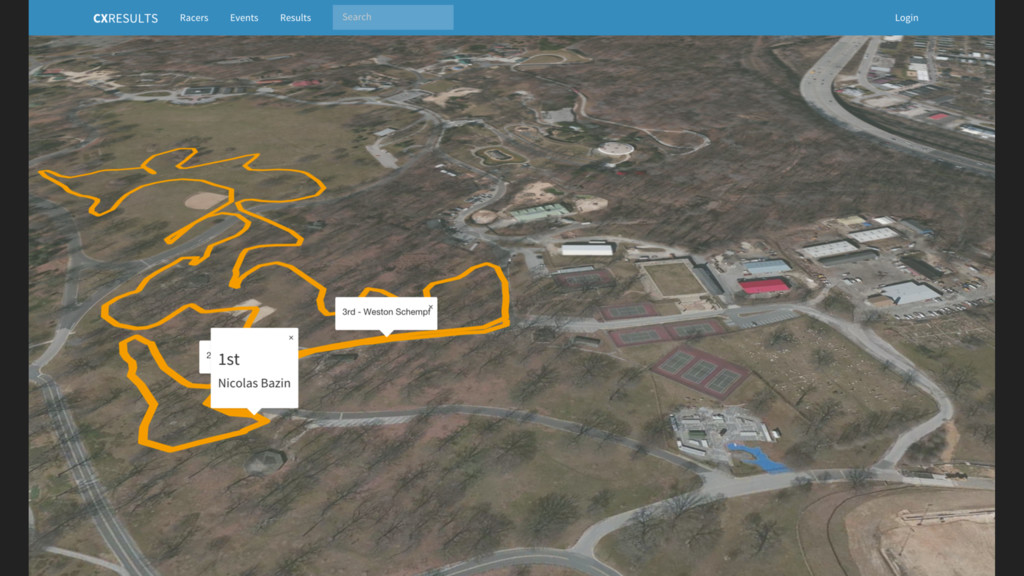
to the visualization. Since each cyclocross race course is unique and the course features play a significant factor in the results, a visualization of the race course could hi light the elevation changes as well as the technicality of the course. For example: are there many turns? Is the course flat? View in 3D A GPS segment of each race course would be plotted in a 3- dimensional view and the finishing order would start from the finish line and move backwards based on the finishing times. This would allow each rare to see where they were when the winner crossed the finish line. Some racers are also lapped since the races is a circuit lap. Interactive Interactivity would allow for switching of a race from one category to another. further exploration into an individual racer’s history and also a comparison of that racer to other competitors. The visual context provides richness. The visual nature of this solution gives racers a view of how the race course terrain may factor into their performance. The lining of results on a representation of the actual course provides a snapshot of the race when the winner crossed the finish-line. Racers who are not near the winner may not see where they are specifically on a course when the winner finished. This additional information can give a racer context into how far back they were on the course, not just how far back in terms of finishing time. ORGANIZATIONAL VALUE
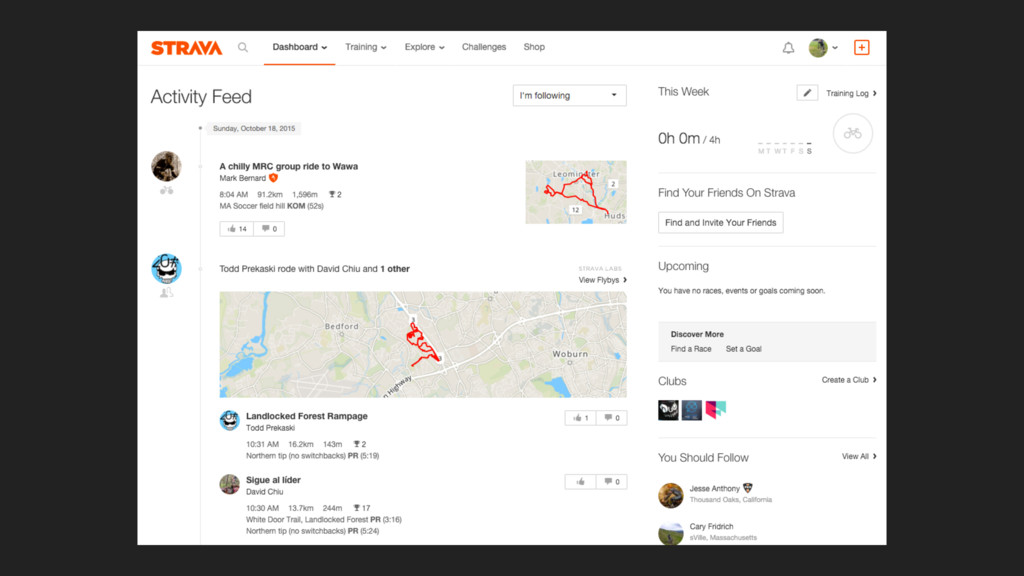
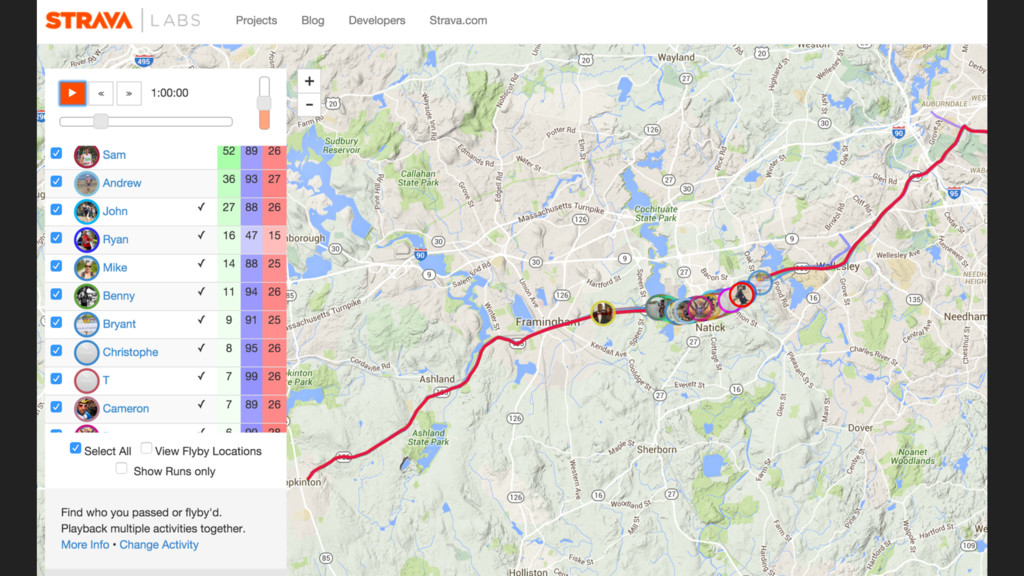
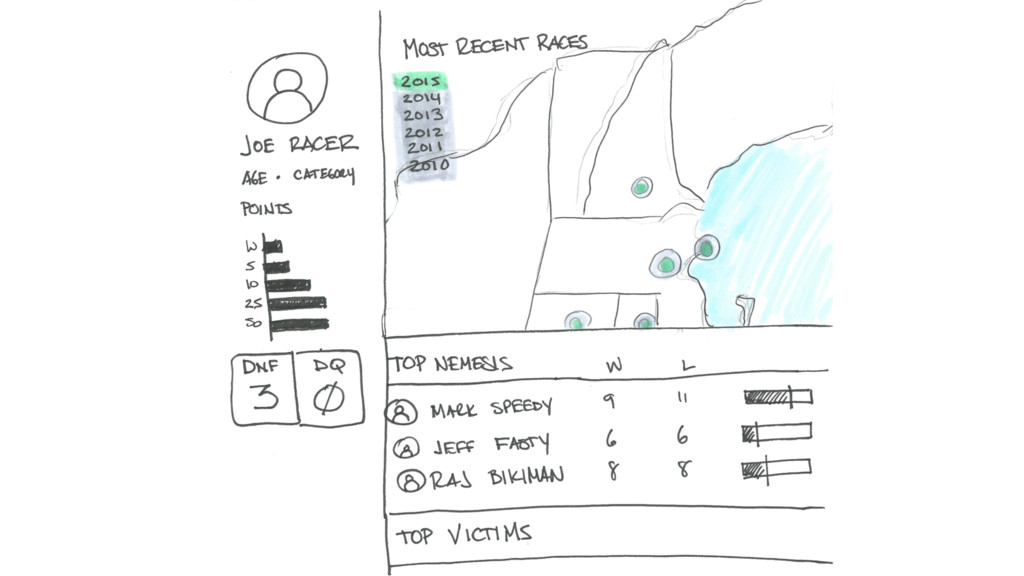
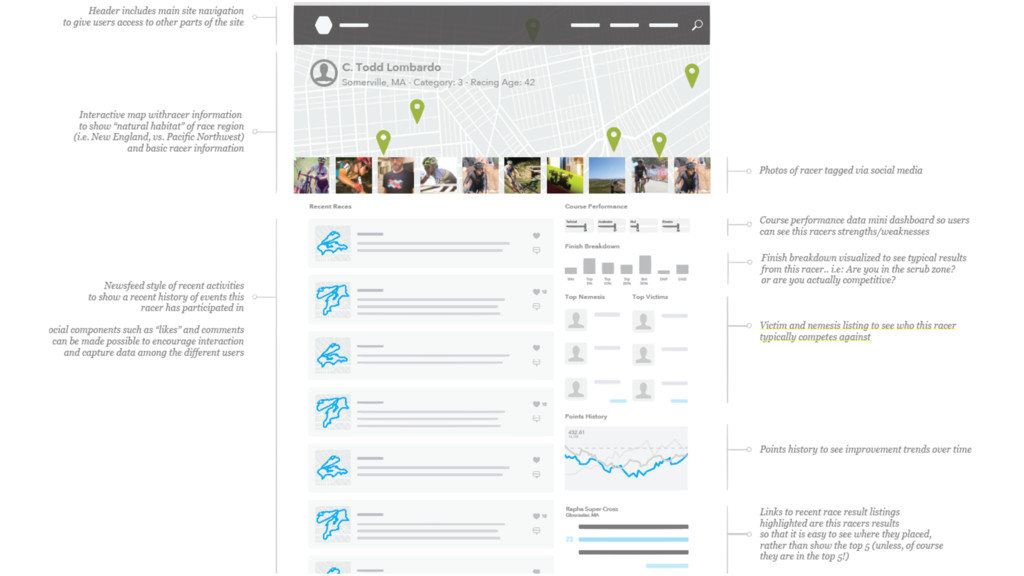
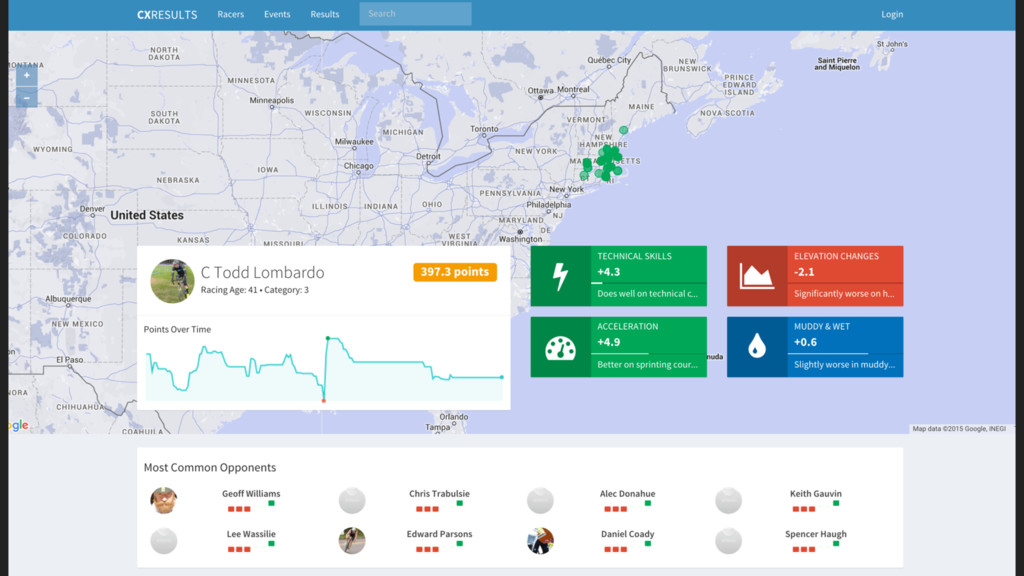
be presented: 1) A redesigned event result listing page that will include a 3D/2D representation of the race course. (current thinking is 3D, however technical limitations may prevent this). Since each race will need to be manually converted from GPX to a 3D rendering, there will be a limit to the amount of races that will be included. For this visualization, 2 to 3 races will be examined, and the potential to automate this process will be considered out of scope. 2) A redesigned racer profile page, that takes a more visual approach to an individual’s race history. Unlike the 3D course view, this is less likely to be limited and should work for any racer in the crossresults.com database. The view will contain results in a feed- like reverse chronological order, including Sparkline charts showing close competitors and a map showing the racer’s geographic race history. 3) A visualized Head-to-Head page where racers can compare their performances to others racers. This should also work for any set of racers in the crossresults.com database. There may be limitation to the number of racers that can be compared at one time. A minimum of 2 and a maximum of 5 will be explored for this visualization. Additional views beyond that will be considered out- of-scope for this project as that could be an entire visualization project itself
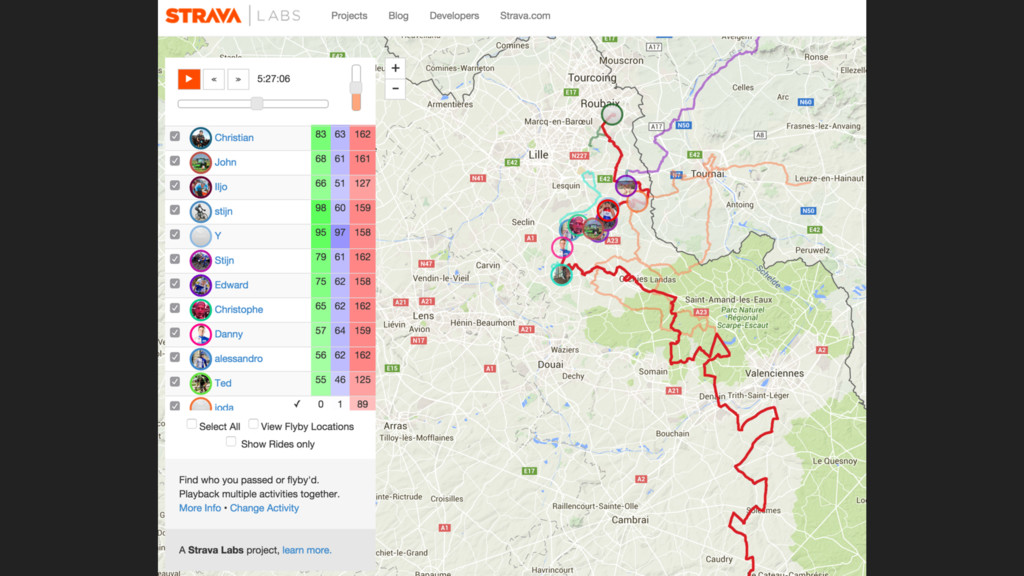
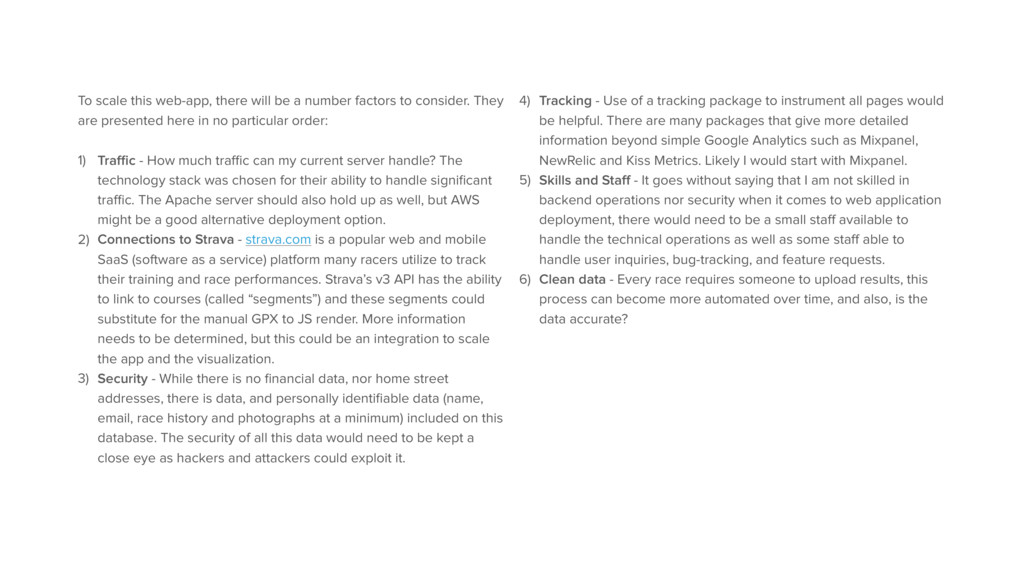
to consider. They are presented here in no particular order: 1) Traffic - How much traffic can my current server handle? The technology stack was chosen for their ability to handle significant traffic. The Apache server should also hold up as well, but AWS might be a good alternative deployment option. 2) Connections to Strava - strava.com is a popular web and mobile SaaS (software as a service) platform many racers utilize to track their training and race performances. Strava’s v3 API has the ability to link to courses (called “segments”) and these segments could substitute for the manual GPX to JS render. More information needs to be determined, but this could be an integration to scale the app and the visualization. 3) Security - While there is no financial data, nor home street addresses, there is data, and personally identifiable data (name, email, race history and photographs at a minimum) included on this database. The security of all this data would need to be kept a close eye as hackers and attackers could exploit it. 4) Tracking - Use of a tracking package to instrument all pages would be helpful. There are many packages that give more detailed information beyond simple Google Analytics such as Mixpanel, NewRelic and Kiss Metrics. Likely I would start with Mixpanel. 5) Skills and Staff - It goes without saying that I am not skilled in backend operations nor security when it comes to web application deployment, there would need to be a small staff available to handle the technical operations as well as some staff able to handle user inquiries, bug-tracking, and feature requests. 6) Clean data - Every race requires someone to upload results, this process can become more automated over time, and also, is the data accurate?
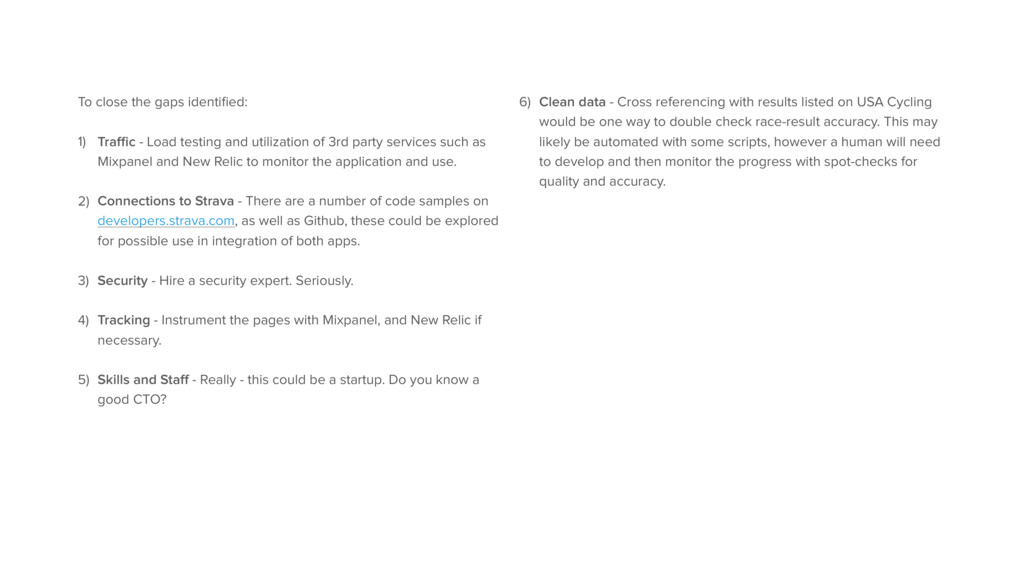
and utilization of 3rd party services such as Mixpanel and New Relic to monitor the application and use. 2) Connections to Strava - There are a number of code samples on developers.strava.com, as well as Github, these could be explored for possible use in integration of both apps. 3) Security - Hire a security expert. Seriously. 4) Tracking - Instrument the pages with Mixpanel, and New Relic if necessary. 5) Skills and Staff - Really - this could be a startup. Do you know a good CTO? 6) Clean data - Cross referencing with results listed on USA Cycling would be one way to double check race-result accuracy. This may likely be automated with some scripts, however a human will need to develop and then monitor the progress with spot-checks for quality and accuracy.
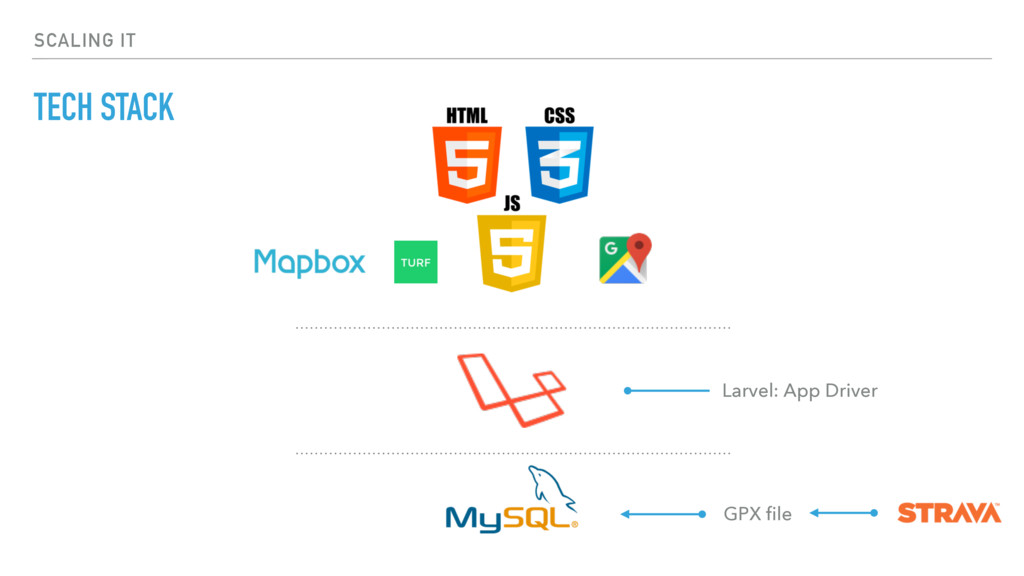
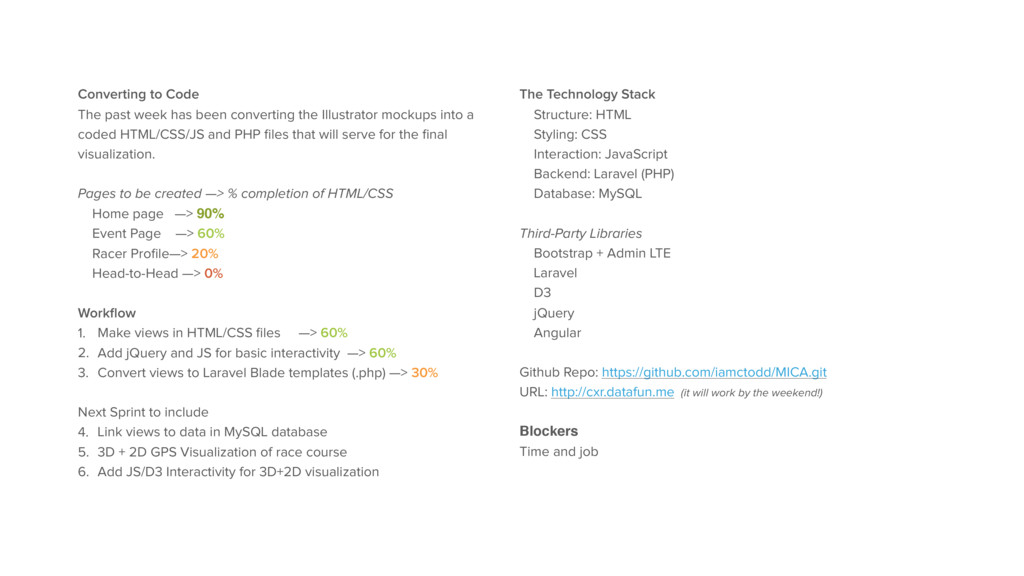
Illustrator mockups into a coded HTML/CSS/JS and PHP files that will serve for the final visualization. Pages to be created —> % completion of HTML/CSS Home page —> 90% Event Page —> 60% Racer Profile—> 20% Head-to-Head —> 0% Workflow 1. Make views in HTML/CSS files —> 60% 2. Add jQuery and JS for basic interactivity —> 60% 3. Convert views to Laravel Blade templates (.php) —> 30% Next Sprint to include 4. Link views to data in MySQL database 5. 3D + 2D GPS Visualization of race course 6. Add JS/D3 Interactivity for 3D+2D visualization The Technology Stack Structure: HTML Styling: CSS Interaction: JavaScript Backend: Laravel (PHP) Database: MySQL Third-Party Libraries Bootstrap + Admin LTE Laravel D3 jQuery Angular Github Repo: https://github.com/iamctodd/MICA.git URL: http://cxr.datafun.me (it will work by the weekend!) Blockers Time and job
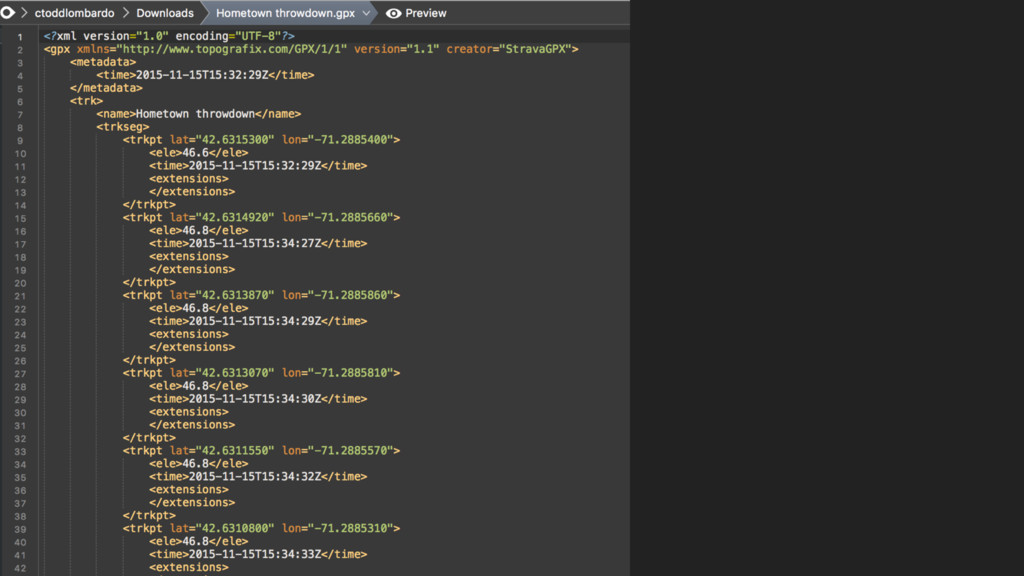
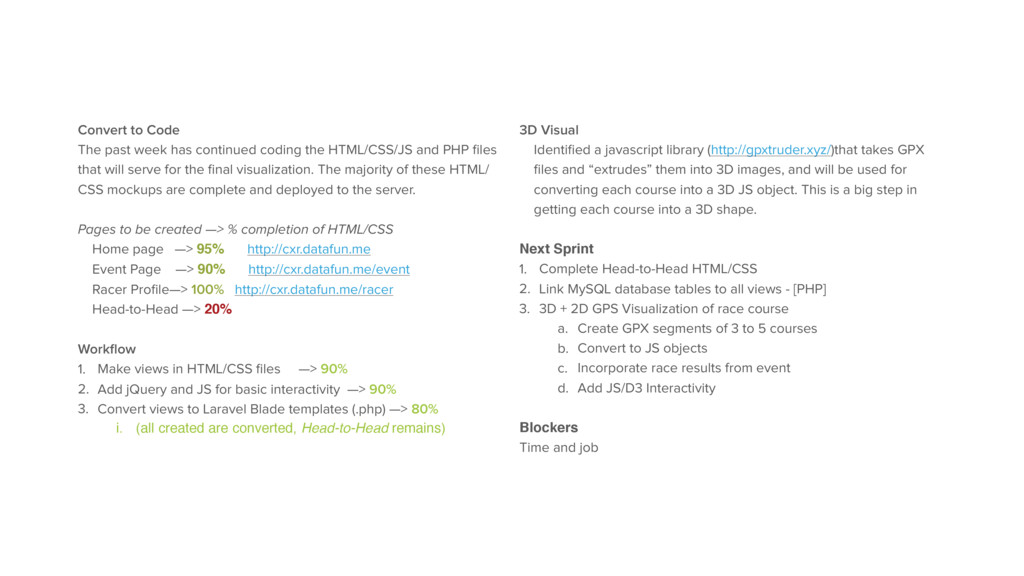
HTML/CSS/JS and PHP files that will serve for the final visualization. The majority of these HTML/ CSS mockups are complete and deployed to the server. Pages to be created —> % completion of HTML/CSS Home page —> 95% http://cxr.datafun.me Event Page —> 90% http://cxr.datafun.me/event Racer Profile—> 100% http://cxr.datafun.me/racer Head-to-Head —> 20% Workflow 1. Make views in HTML/CSS files —> 90% 2. Add jQuery and JS for basic interactivity —> 90% 3. Convert views to Laravel Blade templates (.php) —> 80% i. (all created are converted, Head-to-Head remains) 3D Visual Identified a javascript library (http://gpxtruder.xyz/)that takes GPX files and “extrudes” them into 3D images, and will be used for converting each course into a 3D JS object. This is a big step in getting each course into a 3D shape. Next Sprint 1. Complete Head-to-Head HTML/CSS 2. Link MySQL database tables to all views - [PHP] 3. 3D + 2D GPS Visualization of race course a. Create GPX segments of 3 to 5 courses b. Convert to JS objects c. Incorporate race results from event d. Add JS/D3 Interactivity Blockers Time and job
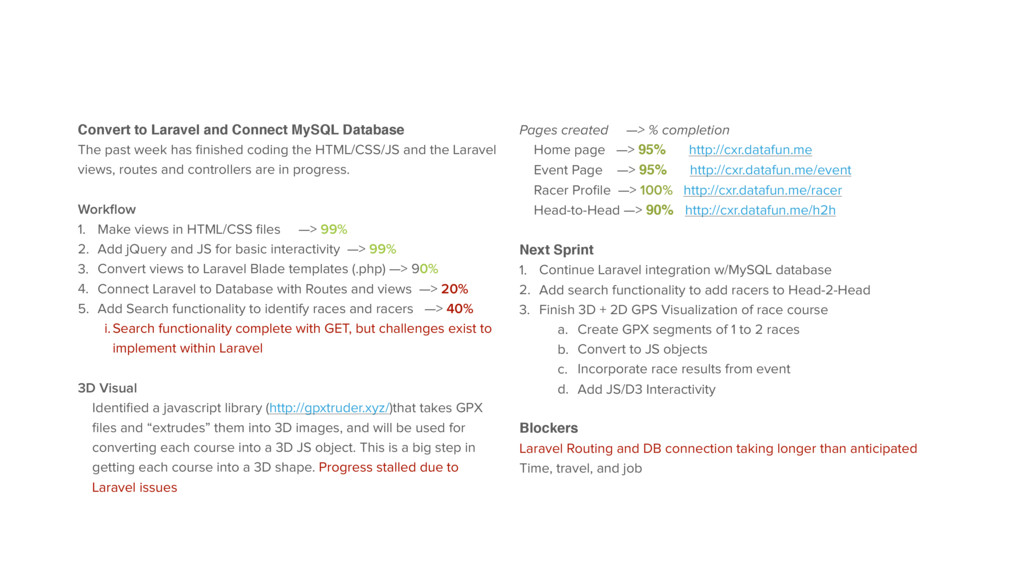
has finished coding the HTML/CSS/JS and the Laravel views, routes and controllers are in progress. Workflow 1. Make views in HTML/CSS files —> 99% 2. Add jQuery and JS for basic interactivity —> 99% 3. Convert views to Laravel Blade templates (.php) —> 90% 4. Connect Laravel to Database with Routes and views —> 20% 5. Add Search functionality to identify races and racers —> 40% i.Search functionality complete with GET, but challenges exist to implement within Laravel 3D Visual Identified a javascript library (http://gpxtruder.xyz/)that takes GPX files and “extrudes” them into 3D images, and will be used for converting each course into a 3D JS object. This is a big step in getting each course into a 3D shape. Progress stalled due to Laravel issues Pages created —> % completion Home page —> 95% http://cxr.datafun.me Event Page —> 95% http://cxr.datafun.me/event Racer Profile —> 100% http://cxr.datafun.me/racer Head-to-Head —> 90% http://cxr.datafun.me/h2h Next Sprint 1. Continue Laravel integration w/MySQL database 2. Add search functionality to add racers to Head-2-Head 3. Finish 3D + 2D GPS Visualization of race course a. Create GPX segments of 1 to 2 races b. Convert to JS objects c. Incorporate race results from event d. Add JS/D3 Interactivity Blockers Laravel Routing and DB connection taking longer than anticipated Time, travel, and job
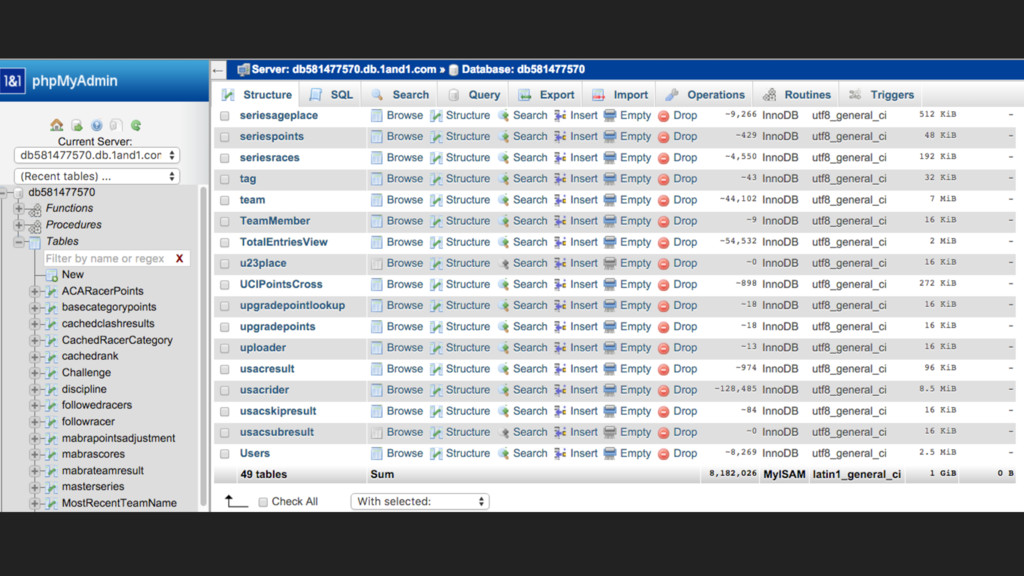
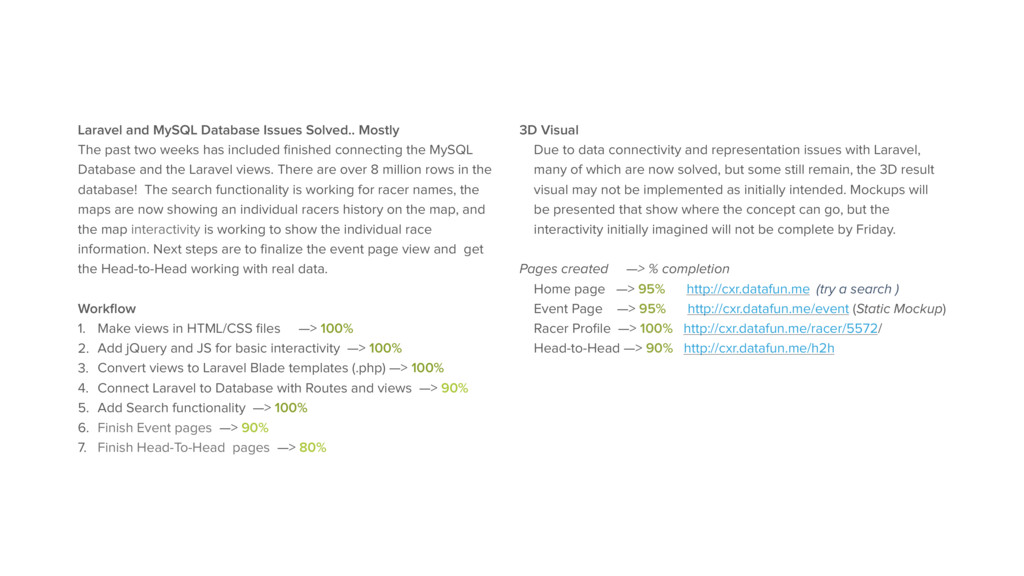
weeks has included finished connecting the MySQL Database and the Laravel views. There are over 8 million rows in the database! The search functionality is working for racer names, the maps are now showing an individual racers history on the map, and the map interactivity is working to show the individual race information. Next steps are to finalize the event page view and get the Head-to-Head working with real data. Workflow 1. Make views in HTML/CSS files —> 100% 2. Add jQuery and JS for basic interactivity —> 100% 3. Convert views to Laravel Blade templates (.php) —> 100% 4. Connect Laravel to Database with Routes and views —> 90% 5. Add Search functionality —> 100% 6. Finish Event pages —> 90% 7. Finish Head-To-Head pages —> 80% 3D Visual Due to data connectivity and representation issues with Laravel, many of which are now solved, but some still remain, the 3D result visual may not be implemented as initially intended. Mockups will be presented that show where the concept can go, but the interactivity initially imagined will not be complete by Friday. Pages created —> % completion Home page —> 95% http://cxr.datafun.me (try a search ) Event Page —> 95% http://cxr.datafun.me/event (Static Mockup) Racer Profile —> 100% http://cxr.datafun.me/racer/5572/ Head-to-Head —> 90% http://cxr.datafun.me/h2h