Upgrade to Pro — share decks privately, control downloads, hide ads and more …

Workflows that run everywhere and where to run them

Workflows that run everywhere and where to run them

Runtime metrics analysis for workflow deployment

Common Workflow Language Workshop Tokyo 2018 @ DeNA Life Science, Shibuya, Tokyo, Japan

Tazro Inutano Ohta

December 06, 2018
Tweet

More Decks by Tazro Inutano Ohta

Other Decks in Research

Transcript

  1. Workflows that run everywhere and where to run them Runtime

    metrics analysis for workflow deployment Tazro Ohta, Database Center for Life Science (DBCLS)
  2. Workflows are now portable Tools are packaged in containers Workflows

    are written in Common Workflow Language Good bye to g i t c l o n e m a k e s t a c k o v e r f l o w
  3. EVERYWHERE means options Where should I run my workflow? Laptop/Desktop

    Shared computing cluster Cloud platforms General instance Compute optimized Memory optimized Storage optimized
  4. Know your workflows To run them at the best performance,

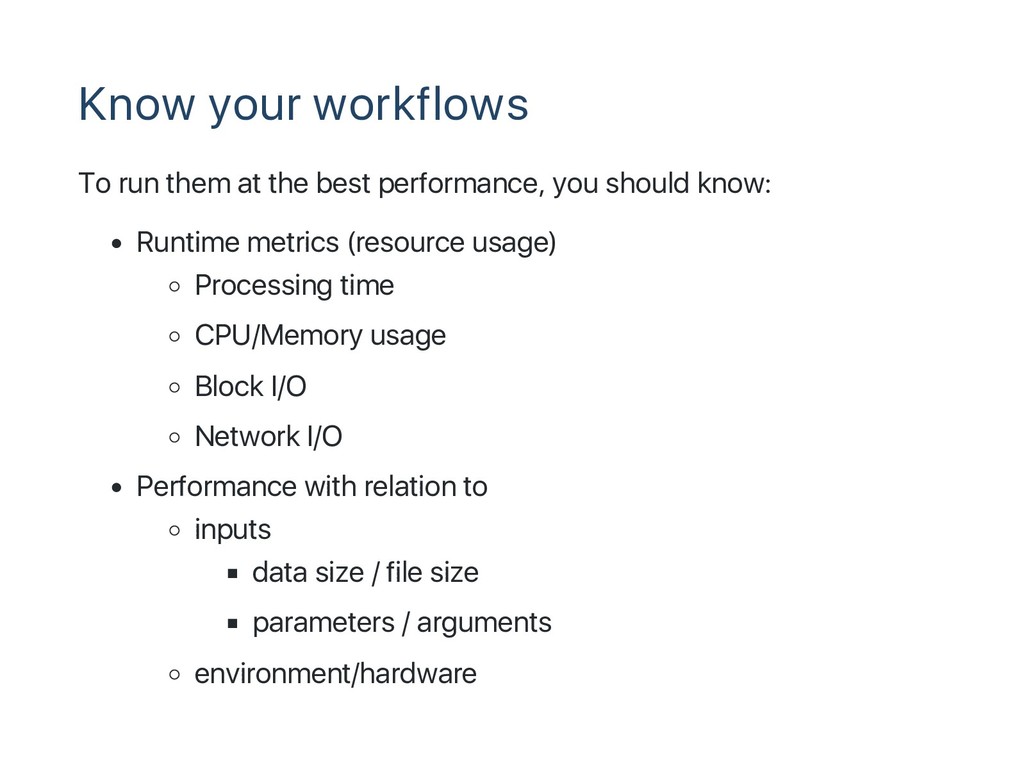
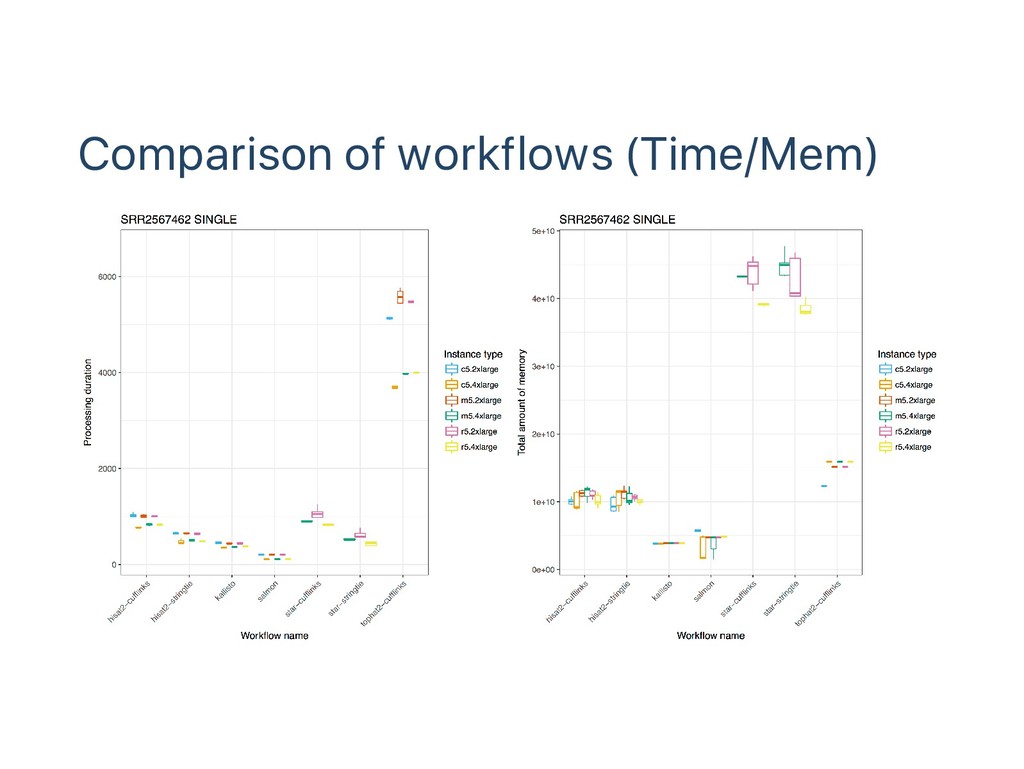
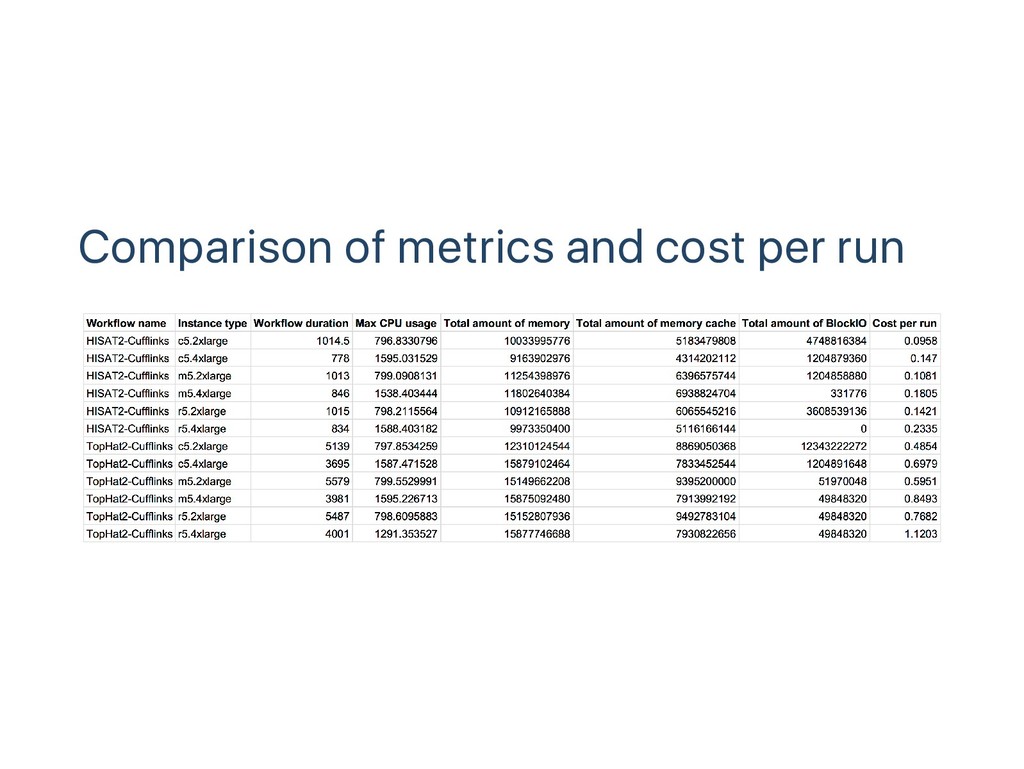
    you should know: Runtime metrics (resource usage) Processing time CPU/Memory usage Block I/O Network I/O Performance with relation to inputs data size / file size parameters / arguments environment/hardware
  5. CWL‑metrics: Runtime metrics analysis A system to capture runtime metrics

    via Docker API Analyze metrics with workflow metadata such as Inputs github.com/inutano/cwl‑metrics or google 'cwl‑metrics'
  6. How to use 1. Wrap your tools in Docker containers

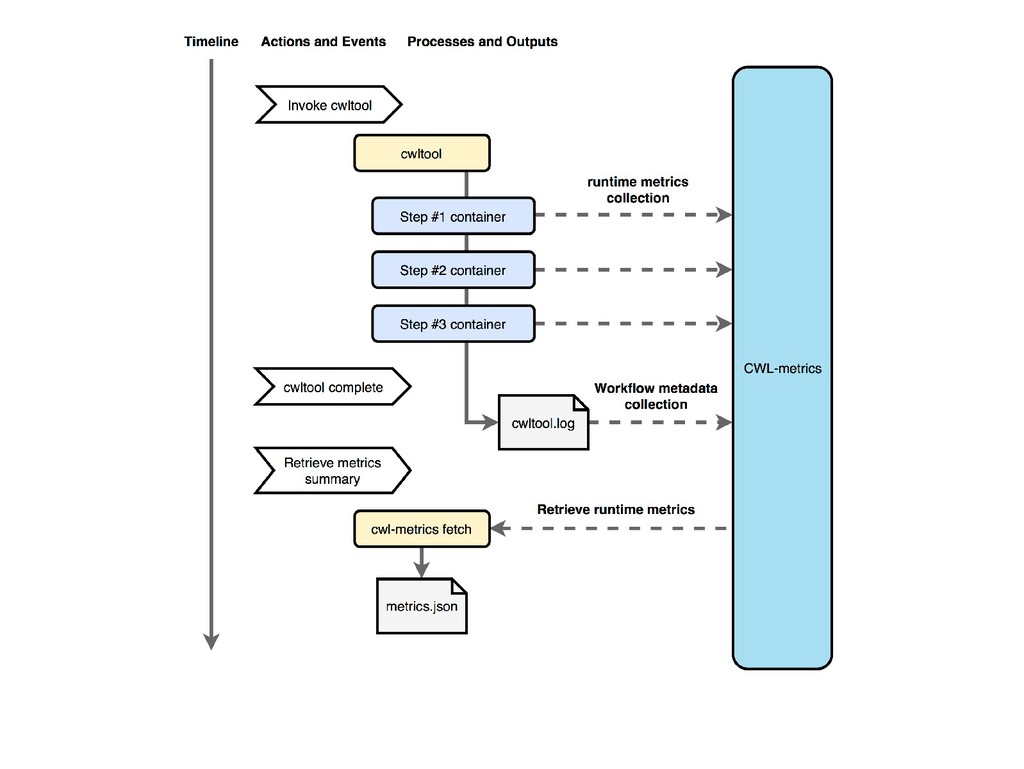
    2. Write CWL of your tools/workflow 3. Install CWL‑metrics and Run c u r l - L " h t t p s : / / t i n y u r l . c o m / c w l - m e t r i c s " | b a s h will install CWL‑metrics and run daemon process 4. Exec c w l t o o l to run your workflow with specified options 5. c w l - m e t r i c s f e t c h to get summarized runtime metrics
  7. The data it captures Full list at influxdata/telegraf docker daemon

    info: assigned cpus, mems, #containers, etc. docker container info: pid, exitcode, started/ended at, etc. mem: max usage, total usage, cache, etc. cpu: total usage, percent usage, user/kernel, etc. network: receive/transmit bytes, packets, errors, etc. block I/O: read, write, total, etc.
  8. Analysis of runtime metrics c w l - m e

    t r i c s f e t c h client for elasticsearch outputs summarized JSON or TSV data Use Kibana to visualize raw data Use elasticsearch API directly from command line
  9. RNA‑Seq workflow comparison doi.org/10.1101/456756 or Search 'cwl‑metrics' on bioRxiv Materials

    7 workflows at pitagora‑galaxy/cwl 9 samples of different #reads and length from SRA 6 different AWS instances m5/c5/r5 2xlarge and 4xlarge
  10. Future plan Resource prediction using stored data Improve implementation less

    dependencies work with other containers Integrate with Provenance put metrics information in provenance object