Upgrade to Pro — share decks privately, control downloads, hide ads and more …

Monitoring ECS and Dynamic Infrastructure

Monitoring ECS and Dynamic Infrastructure

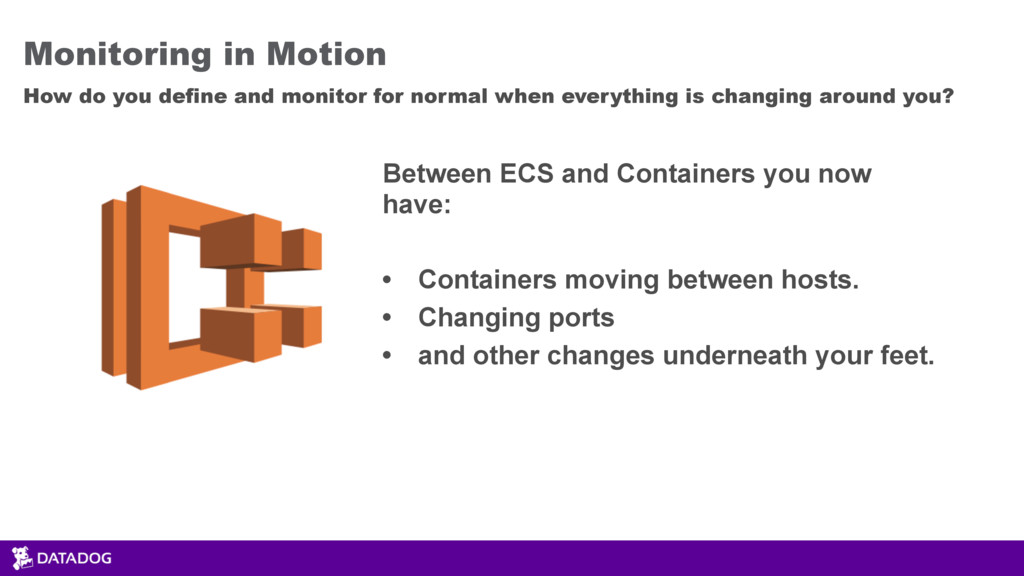
Containers and other forms of dynamic infrastructure can prove challenging to monitor.  How do you define normal, when your infrastructure is intentionally in motion and change from minute to minute? Join us as we discuss proven strategies for monitoring your containerized infrastructure on AWS and ECS.

Ilan Rabinovitch

April 19, 2016
Tweet

More Decks by Ilan Rabinovitch

Other Decks in Technology

Transcript

  1. © 2016, Amazon Web Services, Inc. or its Affiliates. All

    rights reserved. Ilan Rabinovitch Monitoring in Motion Monitoring Containers and ECS
  2. $ finger ilan@datadog [datadoghq.com] Name: Ilan Rabinovitch Role: Director, Technical

    Community 
 Interests: * Open Source * Large scale web operations * Monitoring and Metrics * Planning FL/OSS and DevOps Events (SCALE, TXLF, DevOpsDays, and more…)
  3. • SaaS based infrastructure monitoring • Focus on modern infrastructure

    • Cloud, Containers, Micro Services • Processing nearly a trillion data points per day • Intelligent Alerting Datadog Overview
  4. $ cat ~/.plan 1. Introduction: Why Containerize? 2. How: Collecting

    Docker and ECS Metrics 3. Finding the Signal: How do we know what to monitor? 4. Practice: Fitting it all together on ECS
  5. ECS - Elastic Container Services • Automatically manages and schedules

    your containers as ‘tasks’
 • Ensures tasks are always running based on your parameters • Integration with load balancing and routing via ELB.
  6. Monitoring in Motion How do you define and monitor for

    normal when everything is changing around you? Between ECS and Containers you now have: • Containers moving between hosts. • Changing ports • and other changes underneath your feet.
  7. Adding up the numbers… Docker Status API: 223+ Metrics per

    container ECS CloudWatch Metrics: 4 per cluster + 2 per service
  8. Adding up the numbers… Docker Status API: 223+ Metrics per

    container ECS CloudWatch Metrics: 4 per cluster + 2 per service OS Metrics: 100~ per instance
  9. Docker Status API: 223+ Metrics per container ECS CloudWatch Metrics:

    4 per cluster + 2 per service OS Metrics: 100~ per instance App Metrics: 50~ Adding up the numbers…
  10. Adding up the numbers… OS Metrics: 100~ per instance Docker

    Status API: 223+ Metrics per container ECS CloudWatch Metrics: 4 per cluster + 2 per service App Metrics: 50~ Metrics Overload!
  11. Moving from statements to tag based queries “Monitor all containers

    running image web in region us-west-2 across all availability zones that use more than 1.5x the average memory on c3.xlarge”
  12. Examples: NGINX - Metrics Work Metrics:
 Requests Per Second •

    Dropped Connections • Request Time • Error Rates Resource Metrics: • Disk I/O • Memory • CPU • Queue Length
  13. Resource Metrics Utilization: • CPU (user + system) • memory

    • i/o • network traffic Saturation • throttling • swap Error • Network Errors 
 (receive vs transmit)
  14. Getting at the Metrics CPU METRICS MEMORY METRICS I/O METRICS

    NETWORK METRICS pseudo-files Yes Yes Some Yes, in 1.6.1+ stats command Basic Basic No Basic API Yes Yes Some Yes
  15. Pseudo-files • Provide visibility into container metrics via the file

    system. • Generally under: 
 /cgroup/<resource>/docker/$CONTAINER_ID/ 
 or
 /sys/fs/cgroup/<resource>/docker/$CONTAINER_ID/

  16. Pseudo-files: CPU Metrics $ cat /sys/fs/cgroup/cpuacct/docker/$CONTAINER_ID/cpuacct.stat > user 2451 #

    time spent running processes since boot > system 966 # time spent executing system calls since boot $ cat /sys/fs/cgroup/cpu/docker/$CONTAINER_ID/cpu.stat > nr_periods 565 # Number of enforcement intervals that have elapsed > nr_throttled 559 # Number of times the group has been throttled > throttled_time 12119585961 # Total time that members of the group were throttled (12.12 seconds) Pseudo-files: CPU Throttling
  17. Docker API • Detailed streaming metrics as JSON HTTP socket


    $ curl -v --unix-socket /var/run/docker.sock http://localhost/containers/ 28d7a95f468e/stats

  18. STATS Command # Usage: docker stats CONTAINER [CONTAINER...] $ docker

    stats $CONTAINER_ID CONTAINER CPU % MEM USAGE/LIMIT MEM % NET I/O BLOCK I/O ecb37227ac84 0.12% 71.53 MiB/490 MiB 14.60% 900.2 MB/275.5 MB 266.8 MB/872.7 MB
  19. Agents and Daemons • Ideally we’d want to schedule an

    agent or daemon on each node via ECS Tasks.
 • Current Work Arounds: 1. Bake it into your image. 2. Install on each host at provision time. 3. Automate with User Scripts and Launch Configs
  20. Grant Privileges via IAM $ aws iam create-role \
 --role-name

    ecs-monitoring \
 --assume-role-policy-document file://trust.policy $ aws iam put-role-policy --role-name ecs-monitoring
 --policy-name ecs-monitoring-policy
 --policy-document file://ecs.policy $ aws iam create-instance-profile 
 --instance-profile-name ECSNode $ aws iam add-role-to-instance-profile \ --instance-profile-name ECSNode \
 --role-name ecs-monitoring
  21. Auto-Scale! $ aws autoscaling create-launch-configuration 
 --launch-configuration MyECSCluster --key-name my-key

    
 --image-id AMI_ID --instance-type INSTANCE_TYPE 
 --user-data file://launch-script.txt --iam-instance-profile IAM_ROLE
  22. Open Questions • Where is my container running? • What

    is the capacity of my cluster? • What port is my app running on? • What’s the total throughput of my app? • What’s its response time per tag? (app, version, region) • What’s the distribution of 5xx error per container?
  23. Service Discovery Docker API ECS & CloudWatch Monitoring Agent Container

    A O A O Containers List & Metadata Additional Metadata (Tags, etc) Config Backend Integration Configurations Host Level Metrics
  24. Custom Metrics • Instrument custom applications
 • You know your

    key transactions best.
 • Use async protocols like Etys’ STATSD