Datadog built automation and monitoring tooling at Ooyala and Edmunds.com • Love Community Events SCALE and Texas Linux Fest DevOpsDay LA DevOpsDay Silicon Valley Ilan Rabinovitch Datadog
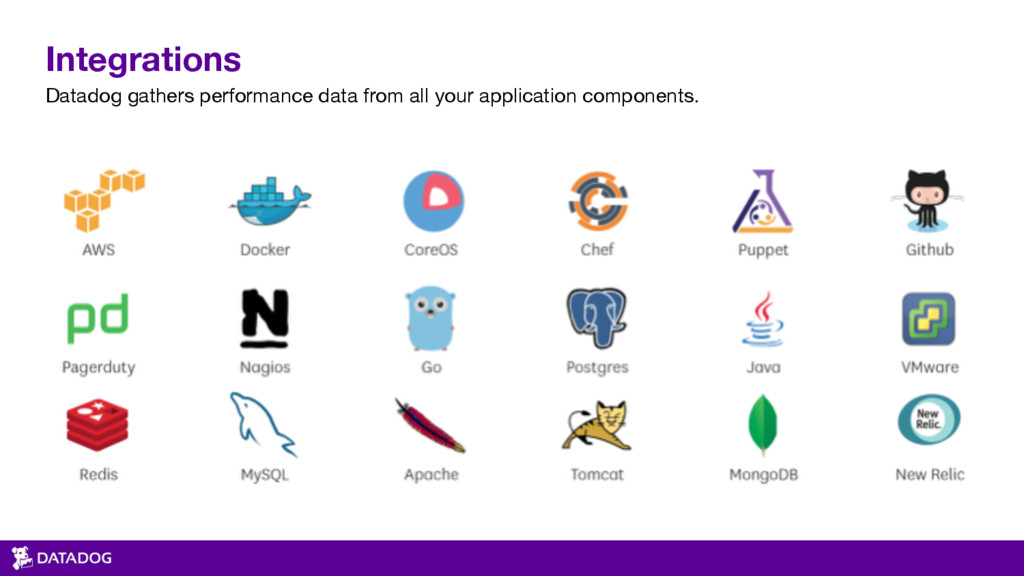
your application and infrastructure components. • Monitoring for modern applications 1. Dynamic Infrastructure 2. Containers (Docker, ECS, Mesos, k8s, and more…) 3. Microservices • Time series storage of metrics and events • Trending, alerting and anomaly detection. • We’re hiring! (Remote, NY, Boston, Paris)
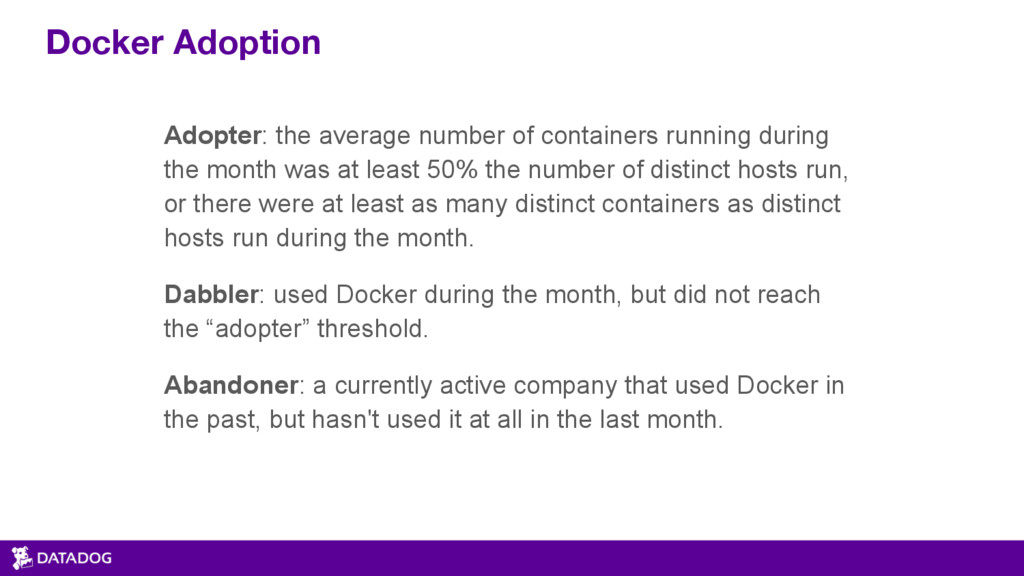
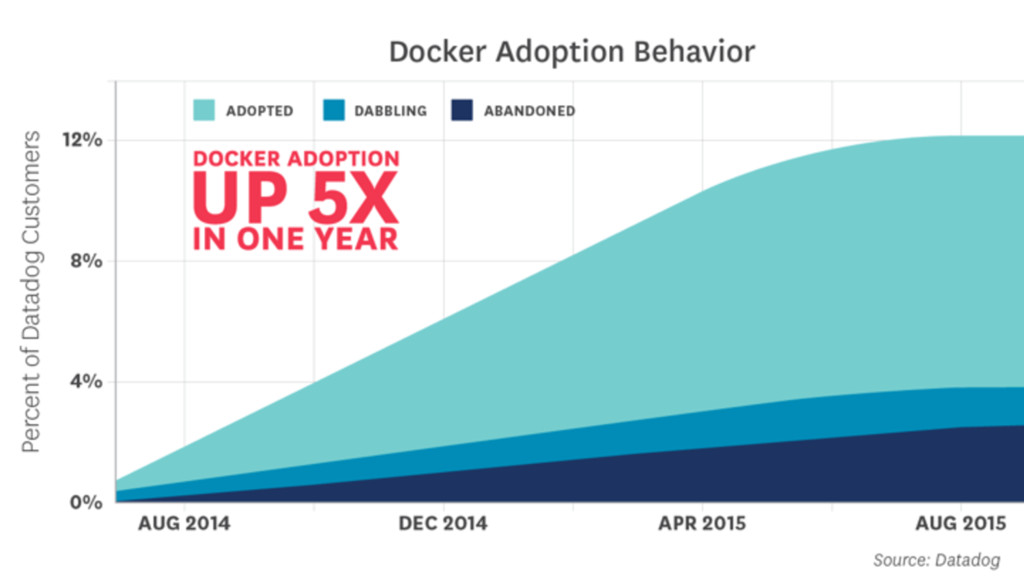
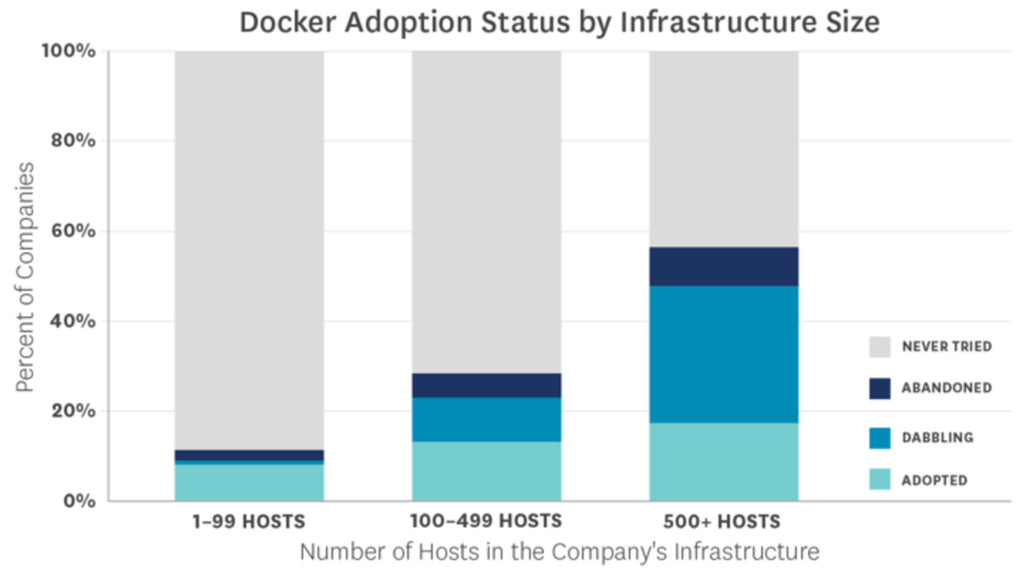
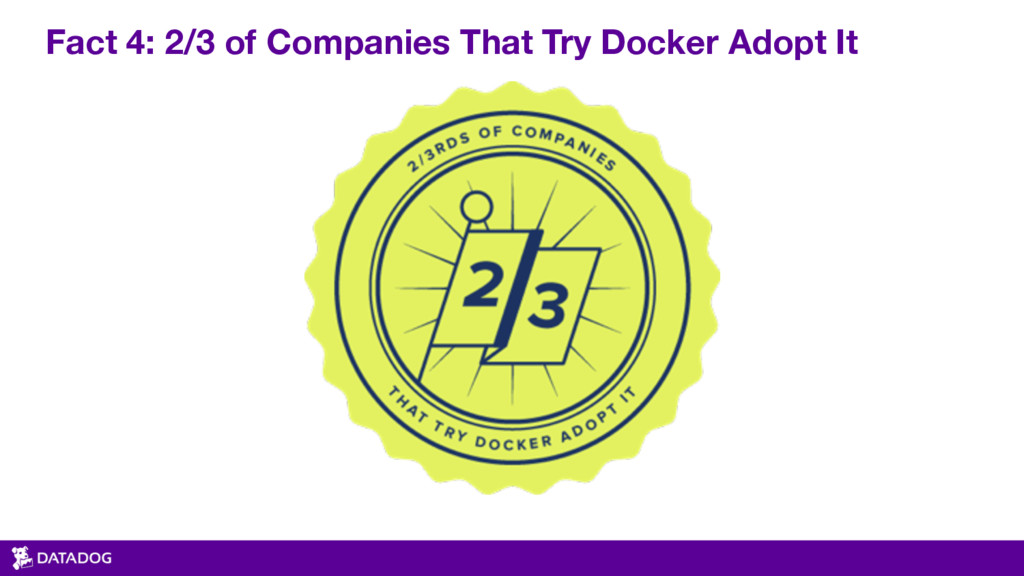
was at least 50% the number of distinct hosts run, or there were at least as many distinct containers as distinct hosts run during the month. Dabbler: used Docker during the month, but did not reach the “adopter” threshold. Abandoner: a currently active company that used Docker in the past, but hasn't used it at all in the last month. Docker Adoption
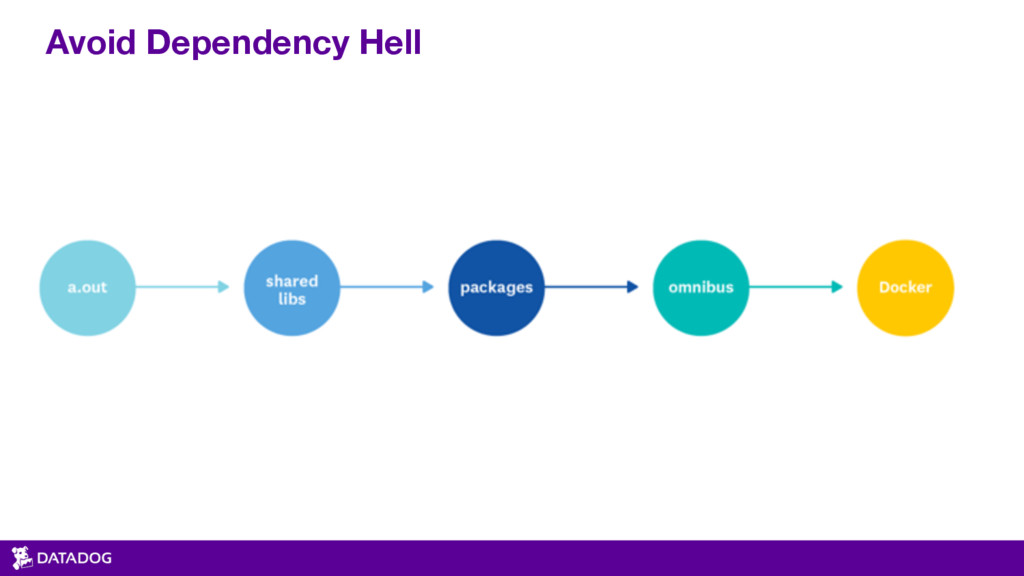
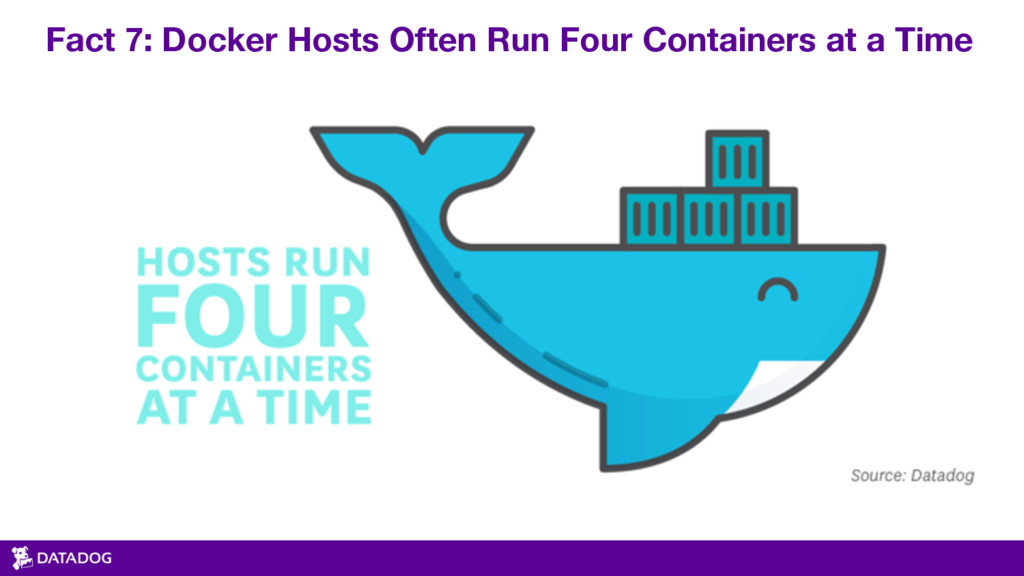
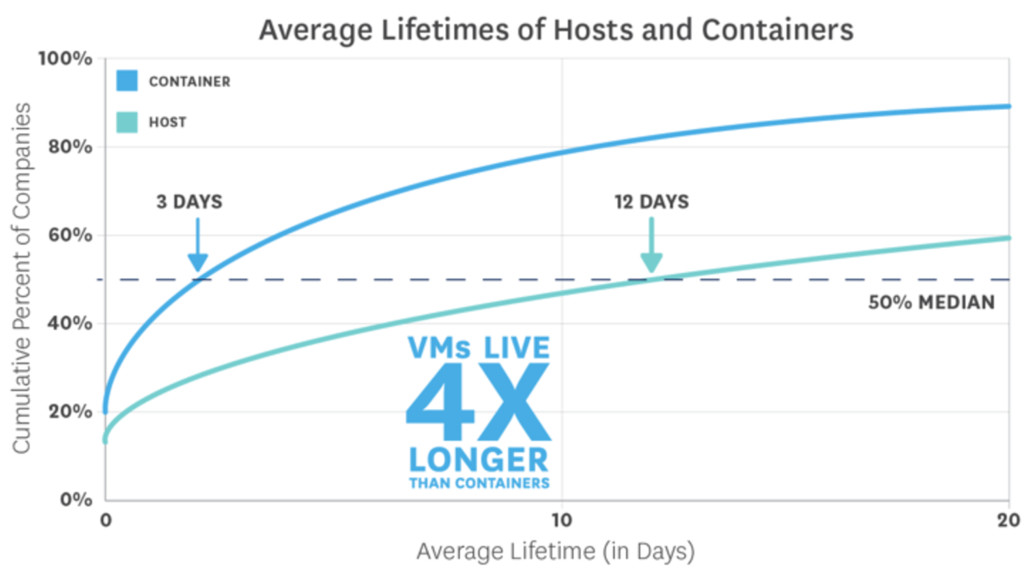
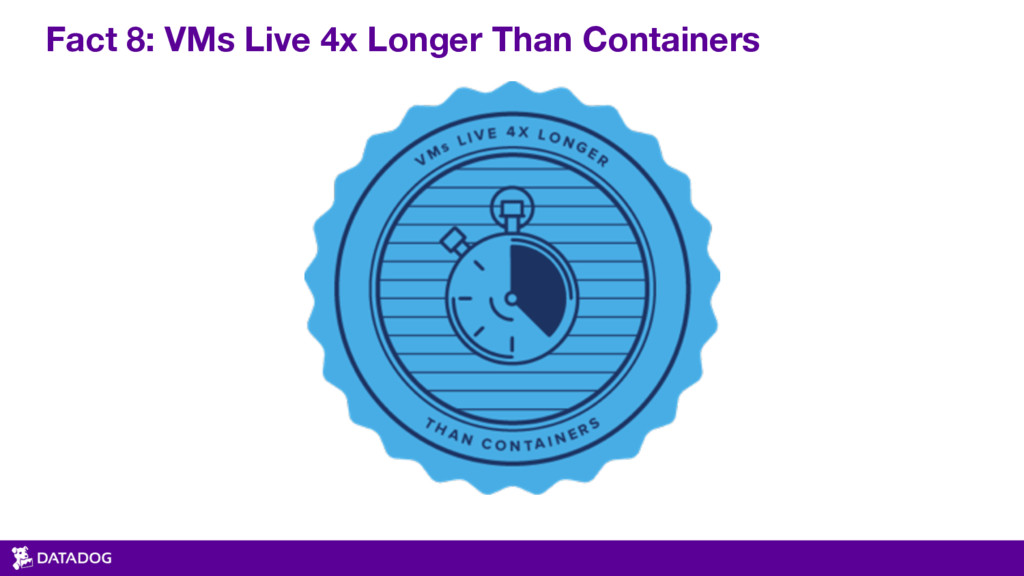
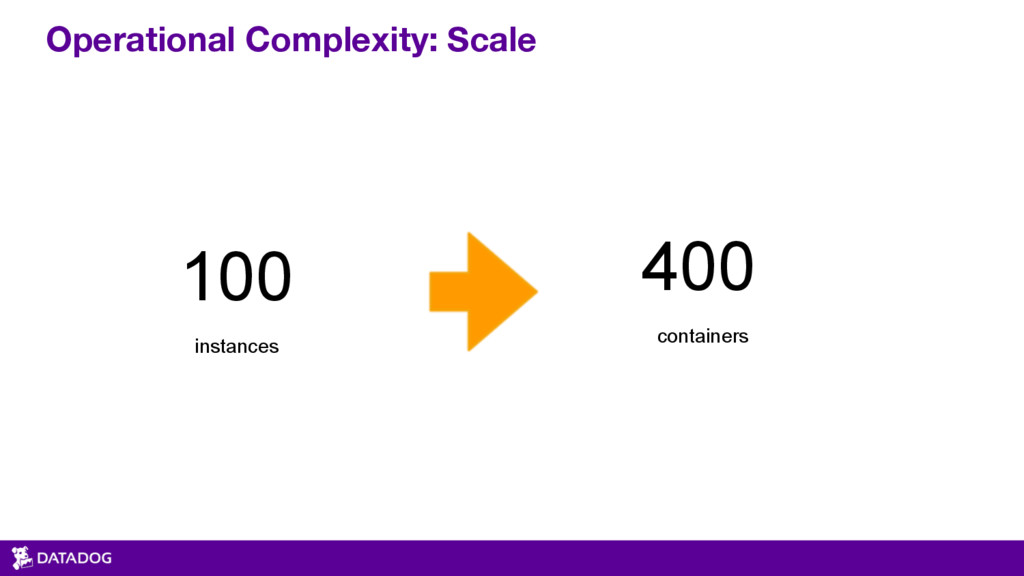
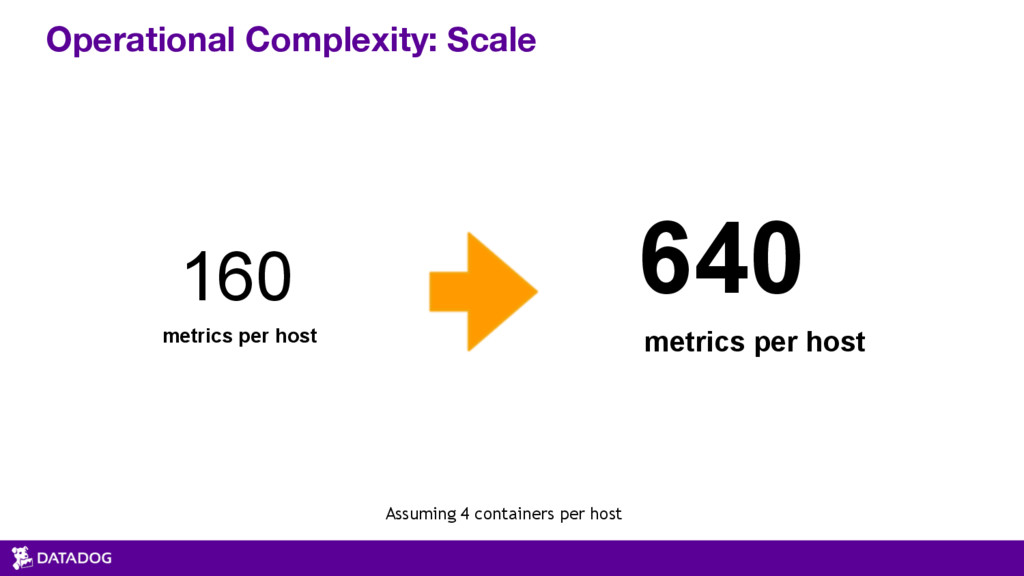
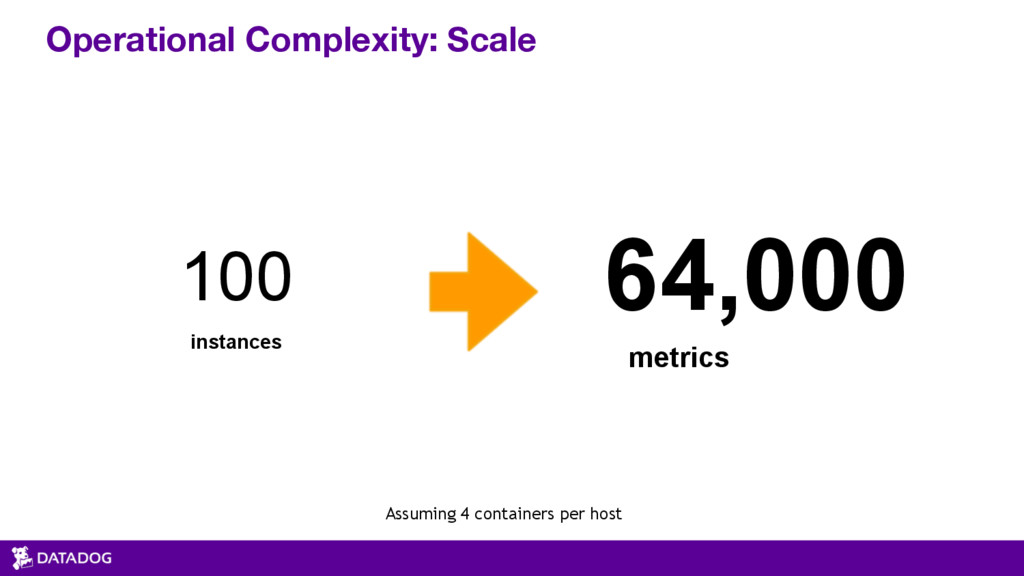
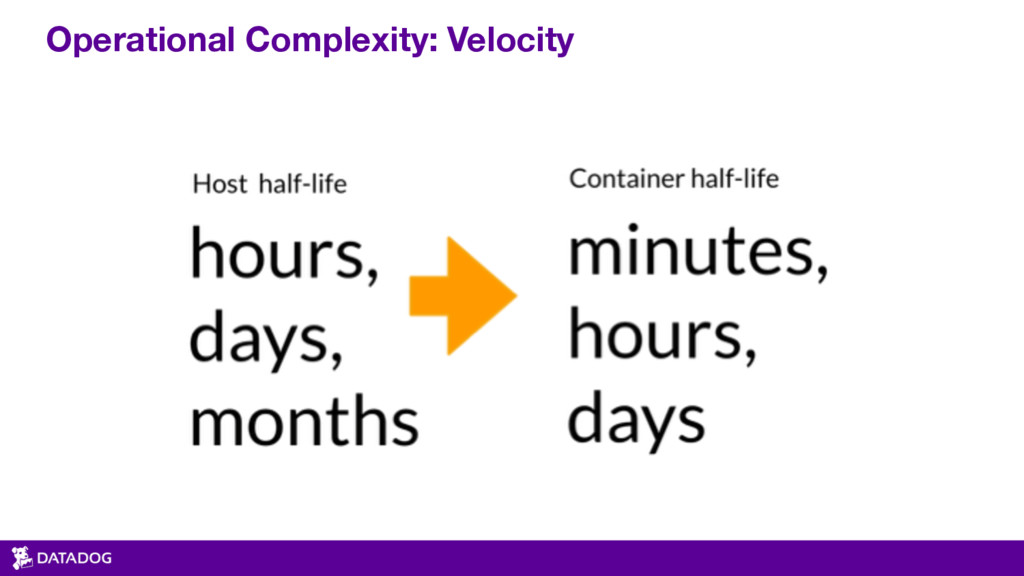
• Instances live about 4x the length of their containers • N-times as many “hosts” to manage • Affects • provisioning: prep’ing & building containers • configuration: passing config to containers • orchestration: deciding where/when containers run • monitoring: making sure containers run properly
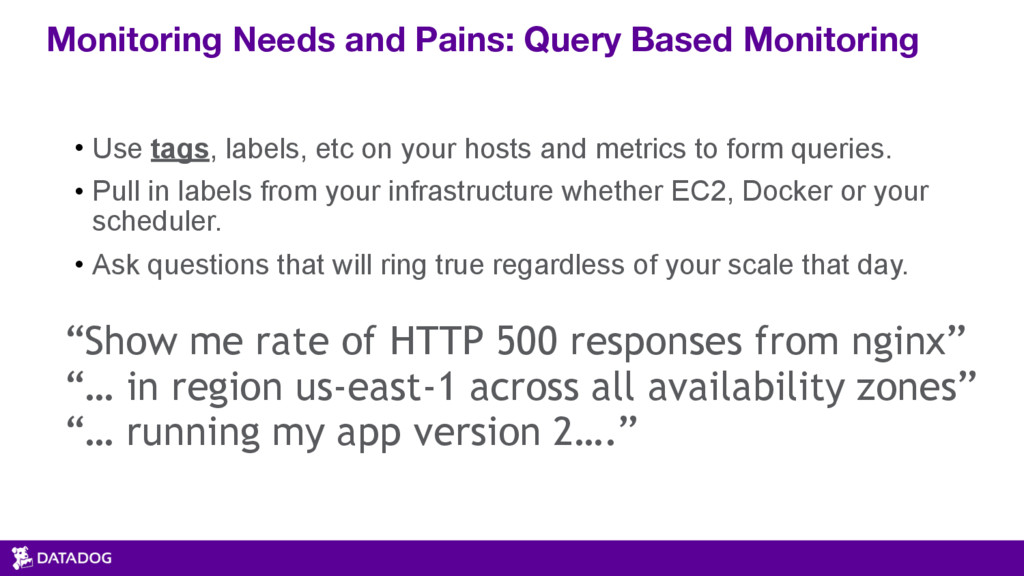
of HTTP 500 responses from nginx” “… in region us-east-1 across all availability zones” “… running my app version 2….” • Use tags, labels, etc on your hosts and metrics to form queries. • Pull in labels from your infrastructure whether EC2, Docker or your scheduler. • Ask questions that will ring true regardless of your scale that day.
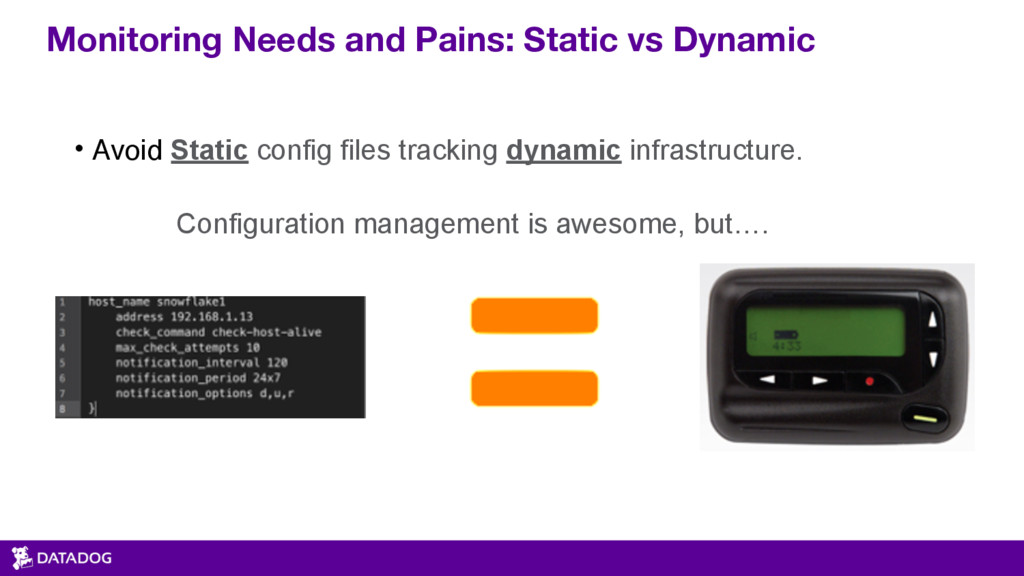
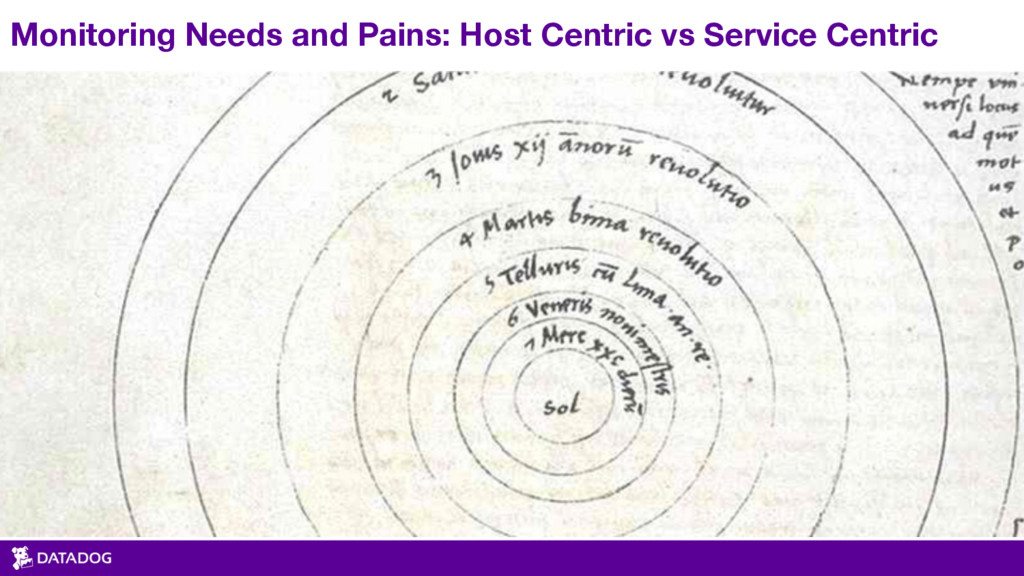
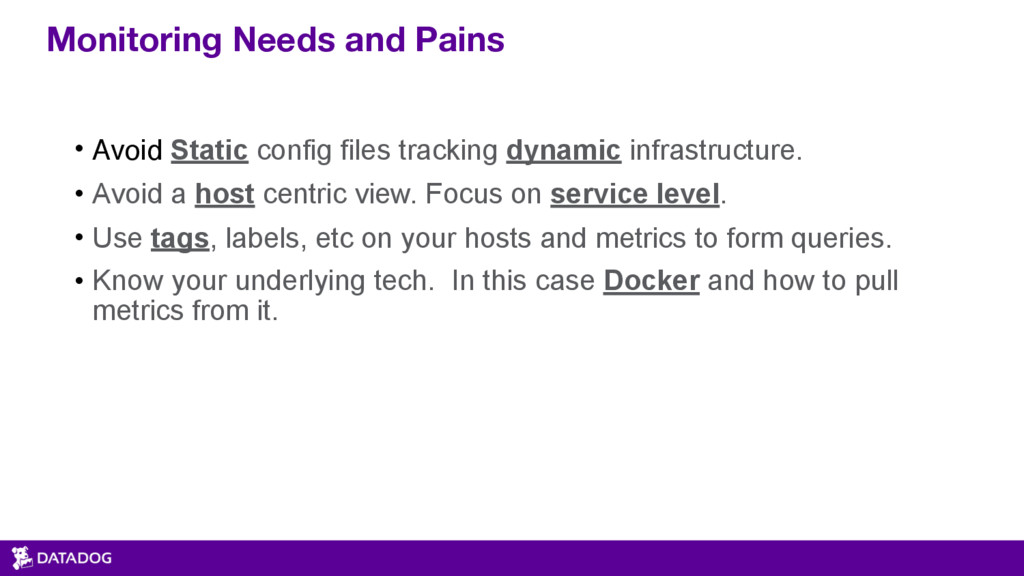
dynamic infrastructure. • Avoid a host centric view. Focus on service level. • Use tags, labels, etc on your hosts and metrics to form queries. • Know your underlying tech. In this case Docker and how to pull metrics from it.
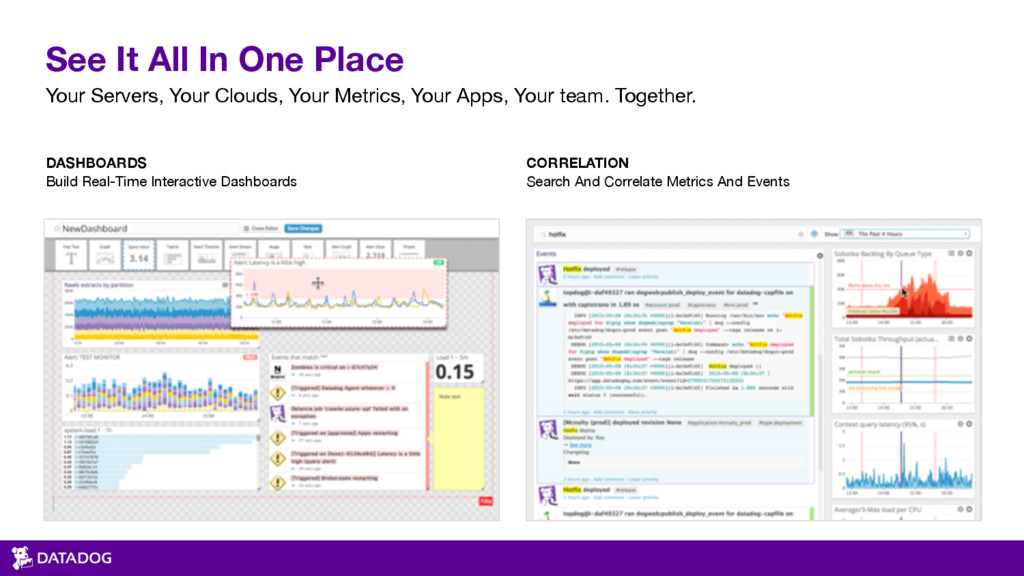
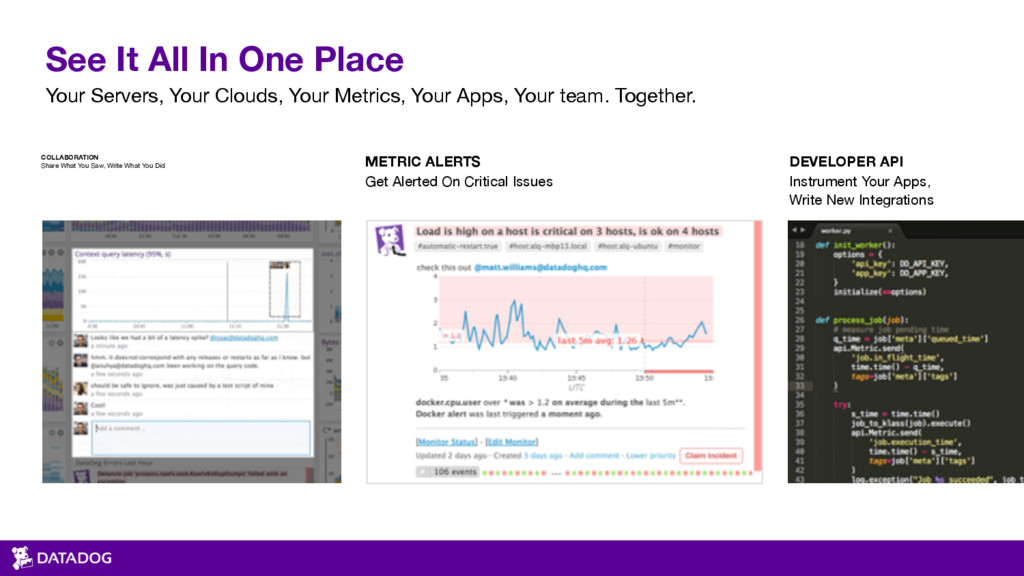
ALERTS Get Alerted On Critical Issues DEVELOPER API Instrument Your Apps, Write New Integrations See It All In One Place Your Servers, Your Clouds, Your Metrics, Your Apps, Your team. Together.