Upgrade to Pro — share decks privately, control downloads, hide ads and more …

OSCON 2016 - Monitoring in Motion

OSCON 2016 - Monitoring in Motion

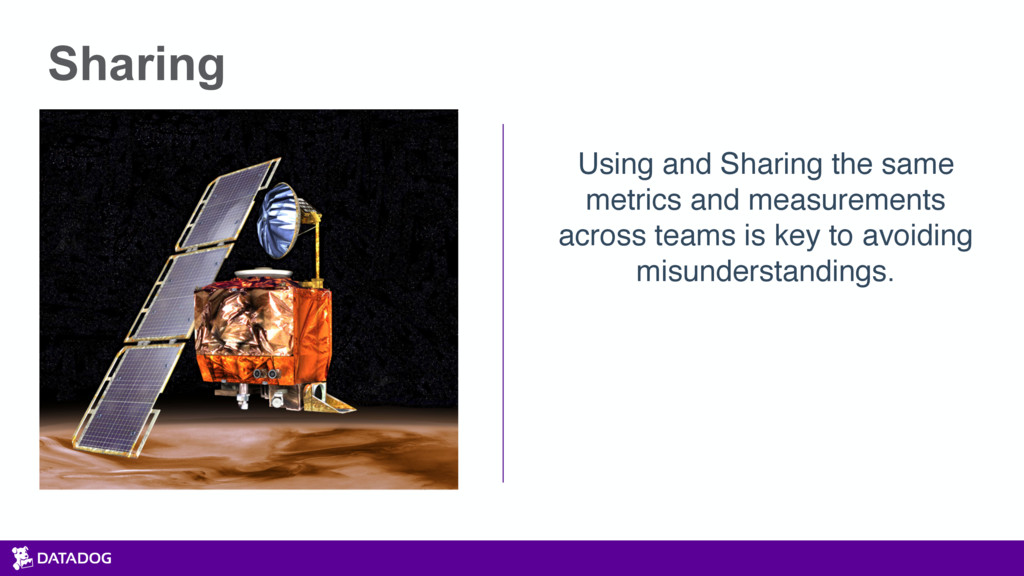
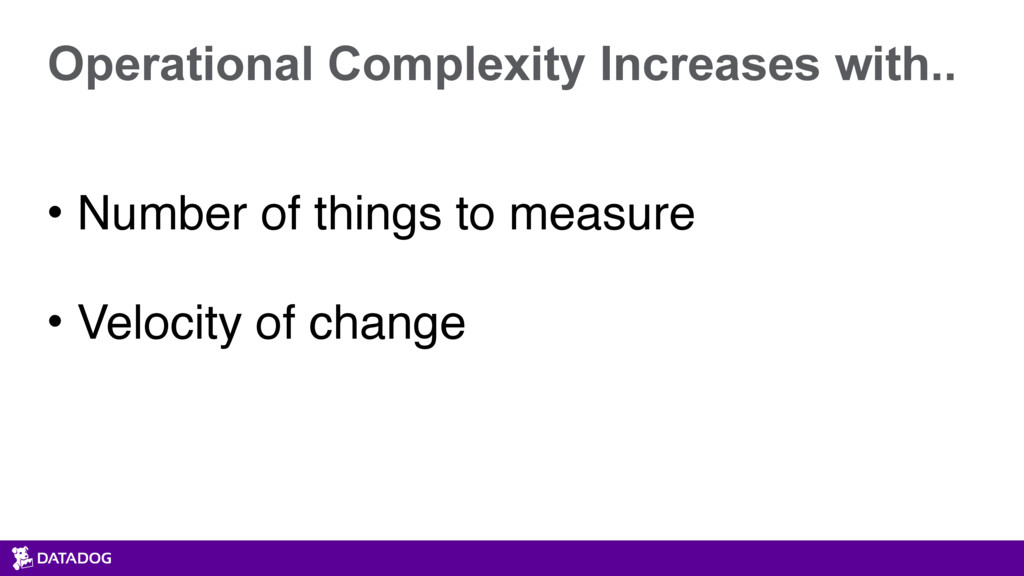
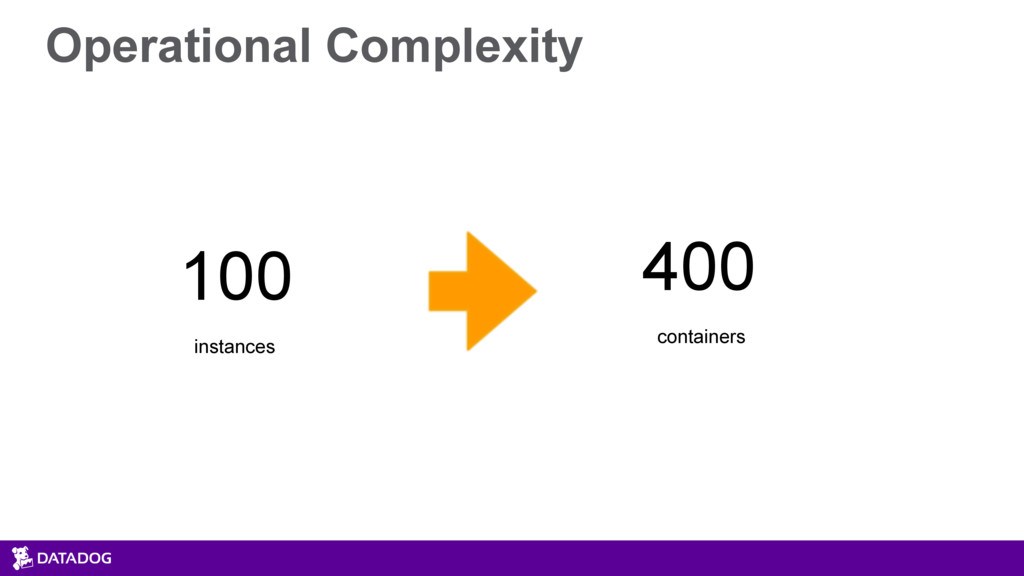
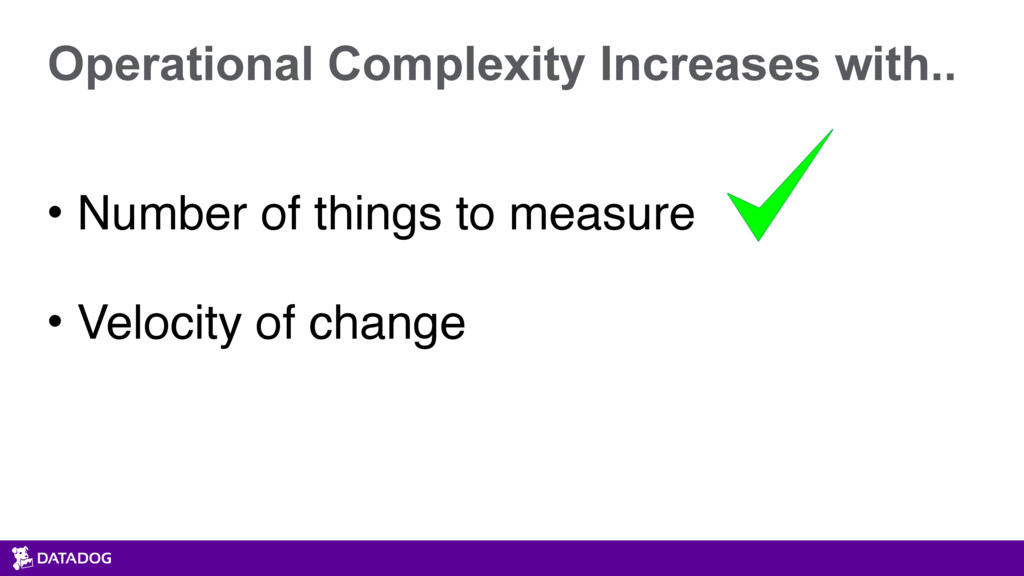
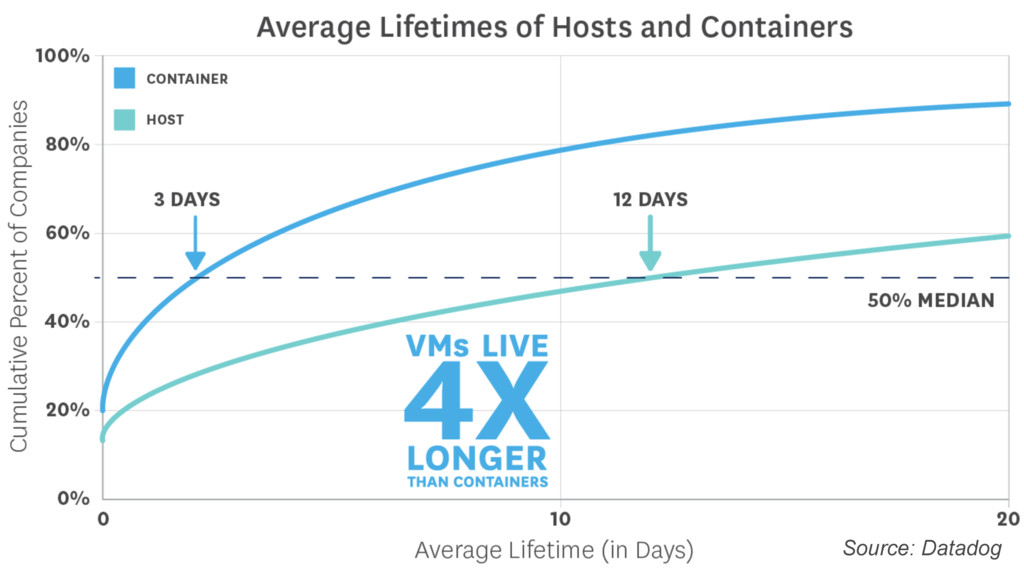
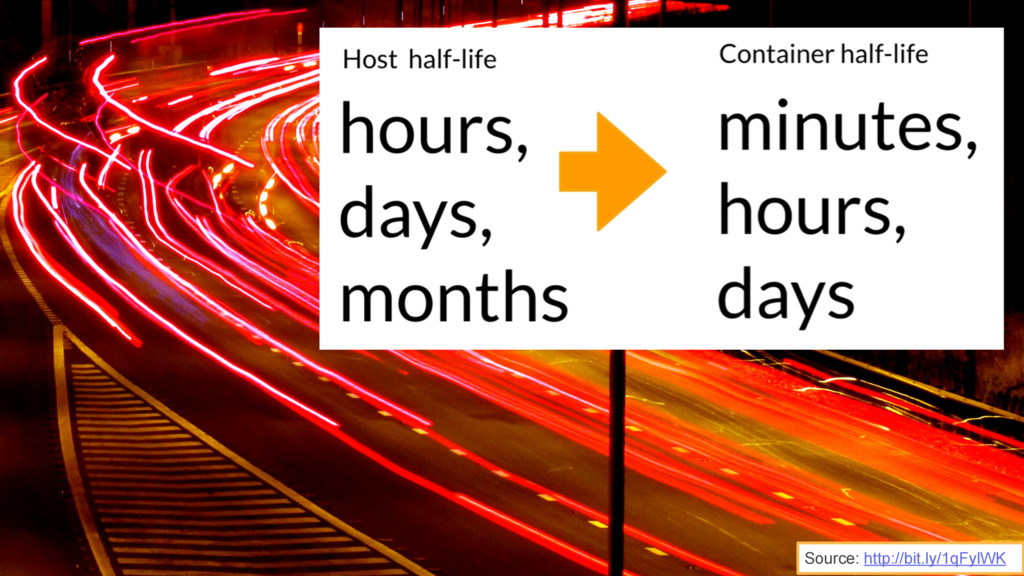
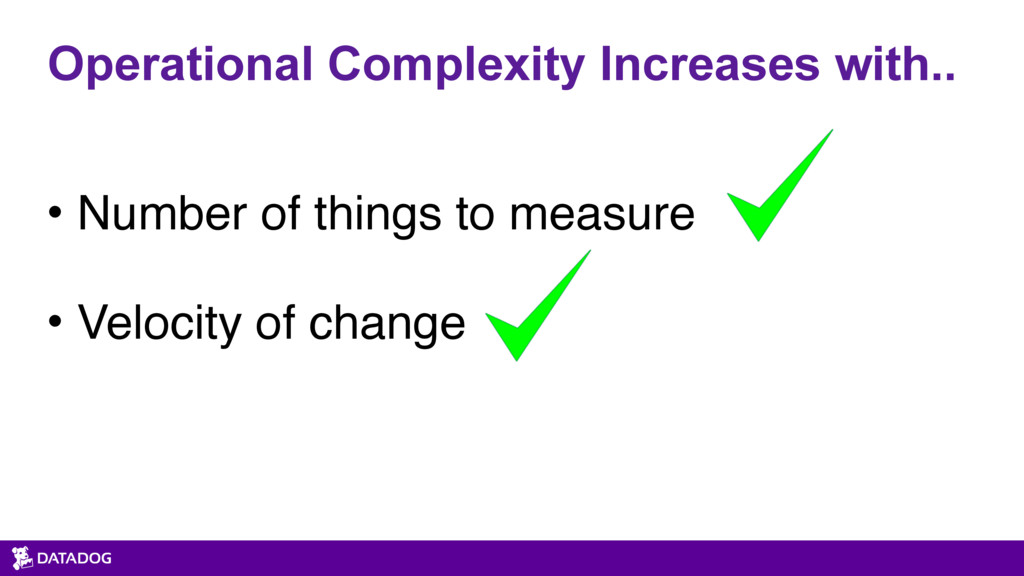
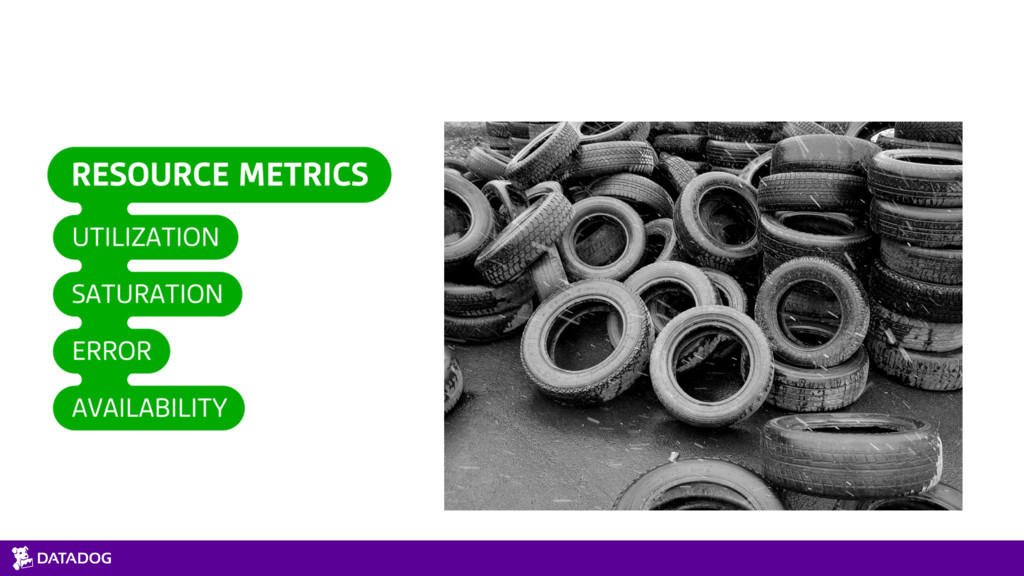
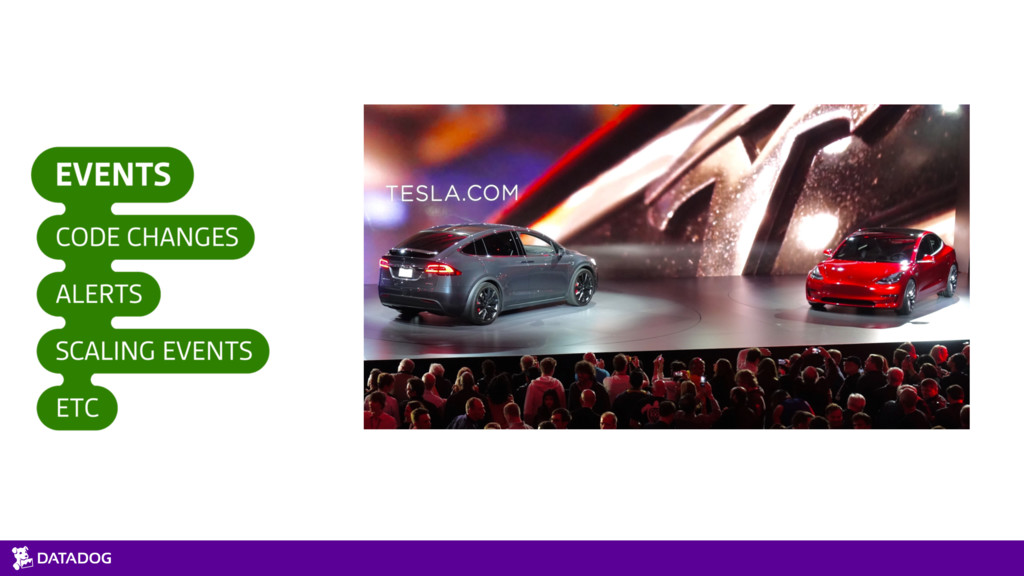
We rely on our monitoring to tell us when our services, applications, or infrastructure diverge from “normal.” Containers have created a new world of dynamic infrastructure where normal is changing constantly, making it quite difficult to define. How do you check if a service is up when your scheduler or clustering tools are changing the hosts and ports it runs on? Ilan Rabinovitch will review techniques for successful monitoring workflows and explains how to instrument your code in your containers and track the performance and availability of your applications as they move around. The techniques discussed will apply regardless of the monitoring platform you choose.

Ilan Rabinovitch

May 17, 2016
Tweet

More Decks by Ilan Rabinovitch

Other Decks in Technology

Transcript

  1. Monitoring In Motion Challenges in monitoring kubernetes, containers, and dynamic

    infrastructure. OSCON Open Container Day May 17, 2016 Ilan Rabinovitch Director, Technical Community
 Datadog
  2. $ finger ilan@datadog [datadoghq.com] Name: Ilan Rabinovitch Role: Director, Technical

    Community 
 Interests: * Monitoring and Metrics * Large scale web operations * FL/OSS Community Events
  3. • SaaS based infrastructure and app monitoring • Open Source

    Agent • Time series data (metrics and events) • Processing nearly a trillion data points per day • Intelligent Alerting • We’re hiring! (www.datadoghq.com/careers/) Datadog Overview
  4. $ cat ~/.plan 1. Intro: The Importance of Monitoring 2.

    The Challenge: Monitoring Dynamic Infrastructure 3. Finding the Signal: How do we know what to monitor? 4. Implementation: Applying it to Containerized Workloads
  5. Culture “organizations which design systems ... are constrained to produce

    designs which are copies of the communication structures of these organizations” - Melvin E. Conway
  6. Sharing Looping Back on Culture Describe the problem as your

    “enemy” not each other Learn Together
  7. Sharing Using and Sharing the same metrics and measurements across

    teams is key to avoiding misunderstandings.
  8. How much we measure? 1 instance • 10 metrics from

    cloud providers 1 operating system (e.g., Linux) • 100 metrics 50~ metrics per application
  9. How much we measure? 1 instance • 10 metrics from

    cloud providers 1 operating system (e.g., Linux) • 100 metrics 50~ metrics per application
 N containers • 150*N metrics
  10. How much we measure? 1 instance • 10 metrics from

    cloud providers 1 operating system (e.g., Linux) • 100 metrics 50~ metrics per application
 N containers • 150*N metrics Metrics Overload!
  11. Open Questions • Where is my container running? • What

    is the capacity of my cluster? • What port is my app running on? • What’s the total throughput of my app? • What’s its response time per tag? (app, version, region) • What’s the distribution of 5xx error per container?
  12. Examples: NGINX - Metrics Work Metrics: 
 • Requests Per

    Second • Request Time • Error Rates (4xx or 5xx) • Success (2xx) Resource Metrics:
 • Disk I/O • Memory • CPU • Queue Length
  13. Query Based Monitoring “What’s the average throughput of application:nginx per

    version ?” “Alert me when one of my pod from replication controller:foo is not behaving like the others?” “Show me rate of HTTP 500 responses from nginx” “… across all data centers” “… running my app version 2….”
  14. Resource Metrics Utilization: • CPU (user + system) • memory

    • i/o • network traffic Saturation • throttling • swap Error • Network Errors 
 (receive vs transmit)
  15. Container Events • Starting / Stopping Containers • Scaling Events

    for Underlying Instances • Deploying a new container build
  16. Getting at the Metrics CPU METRICS MEMORY METRICS I/O METRICS

    NETWORK METRICS pseudo-files Yes Yes Some Yes, in 1.6.1+ stats command Basic Basic No Basic API Yes Yes Some Yes
  17. Pseudo-files • Provide visibility into container metrics via the file

    system. • Generally under: 
 /cgroup/<resource>/docker/$CONTAINER_ID/ 
 or
 /sys/fs/cgroup/<resource>/docker/$CONTAINER_ID/

  18. Pseudo-files: CPU Metrics $ cat /sys/fs/cgroup/cpuacct/docker/$CONTAINER_ID/cpuacct.stat > user 2451 #

    time spent running processes since boot > system 966 # time spent executing system calls since boot $ cat /sys/fs/cgroup/cpu/docker/$CONTAINER_ID/cpu.stat > nr_periods 565 # Number of enforcement intervals that have elapsed > nr_throttled 559 # Number of times the group has been throttled > throttled_time 12119585961 # Total time that members of the group were throttled (12.12 seconds) Pseudo-files: CPU Throttling
  19. Docker API • Detailed streaming metrics as JSON HTTP socket


    $ curl -v --unix-socket /var/run/docker.sock http://localhost/containers/ 28d7a95f468e/stats

  20. STATS Command # Usage: docker stats CONTAINER [CONTAINER...] $ docker

    stats $CONTAINER_ID CONTAINER CPU % MEM USAGE/LIMIT MEM % NET I/O BLOCK I/O ecb37227ac84 0.12% 71.53 MiB/490 MiB 14.60% 900.2 MB/275.5 MB 266.8 MB/872.7 MB
  21. Open Questions • What is the capacity of my cluster?

    • What’s the total throughput of my app? • What’s its response time per tag? (app, version, region) • What’s the distribution of 5xx error per container? • Where is my container running? what port?
  22. Service Discovery Docker API Orchestrator Monitoring Agent Container A O

    A O Containers List & Metadata Additional Metadata (Tags, etc) Config Backend Integration Configurations Host Level Metrics
  23. Custom Metrics • Instrument custom applications
 • You know your

    key transactions best.
 • Use async protocols like Etys’ STATSD or 
 DogstatsD
  24. Datadog at OSCON Today 11:30am Sweet deployment flows with Docker,

    Kubernetes, and OpenShift (Steven Pousty) Thursday 11:05am Detecting outliers and anomalies in real-time at Datadog - Homin Lee (Datadog)
  25. Resources Monitoring 101: Alerting 
 https://www.datadoghq.com/blog/monitoring-101-alerting/ Monitoring 101: Collecting the

    Right Data https://www.datadoghq.com/blog/monitoring-101-collecting-data/ Monitoring 101: Investigating performance issues https://www.datadoghq.com/blog/monitoring-101-investigation/
 The Power of Tagged Metrics https://www.datadoghq.com/blog/the-docker-monitoring-problem/ How to Collect Docker Metrics https://www.datadoghq.com/blog/how-to-collect-docker-metrics/ 8 surprising facts about Docker Adoption https://www.datadoghq.com/docker-adoption/