Upgrade to Pro
— share decks privately, control downloads, hide ads and more …
Speaker Deck
Features
Speaker Deck
PRO
Sign in
Sign up for free
Search
Search
Monitoring in Motion: Challenges of Monitoring ...
Search
Ilan Rabinovitch
February 26, 2016
Technology
120
0
Share
Embed
Copy iframe code
Copy JS code
Copy link
Start on current slide
Monitoring in Motion: Challenges of Monitoring Containers and Kuberntes
Ilan Rabinovitch
February 26, 2016
More Decks by Ilan Rabinovitch
See All by Ilan Rabinovitch
Monitoring in Motion - ContainerCon 2016
irabinovitch
0
110
Data Driven Post Mortems at Datadog - LinuxCon 2016
irabinovitch
1
240
Introduction to Docker Monitoring
irabinovitch
0
180
OSCON 2016 - Monitoring in Motion
irabinovitch
2
200
Monitoring OpenStack at Lithium (OpenStack Summit Austin 2016)
irabinovitch
0
83
LinuxFest Northwest 2016 - Monitoring 101
irabinovitch
0
53
Monitoring ECS and Dynamic Infrastructure
irabinovitch
0
130
Doing DevOps Right with Datadog + Pagerduty
irabinovitch
0
140
Docker Usage Patterns - Docker Meetup Palo Alto - Nov 2015
irabinovitch
0
85
Other Decks in Technology
See All in Technology
CSに"SLO"は要らない、経営層に"99.9%"は伝わらない - SREを全社に"翻訳"する3原則
cscengineer
PRO
1
4.6k
ヘルスケア領域における AI 活用と その安全性担保のための取り組み (Leveraging AI in Healthcare and Our Efforts to Ensure Its Safety) - Google I/O Extended Tokyo 2026, July 11, 2026
zettaittenani
0
330
アカウントが増えてからでは遅い? ~ マルチアカウント統制の勘所 ~
kenichinakamura
0
230
関数型の考えを TypeScript に持ち込んで、テストしやすい純粋関数を増やす / Pure at the Core, Effects at the Edge: Bringing Functional Thinking into TypeScript
kaminashi
1
110
ポストモーテム! DDoSからサイトは守れた。 でもビジネスは守れなかった。
bengo4com
1
2.9k
Keeping applications secure by evolving OAuth 2.0 and OpenID Connect
ahus1
PRO
1
160
AI Driven AI Governance
pict3
0
390
インフラ寄りSREでも 開発に踏み出せる〜境界を越えてユーザー体験に向き合いたい〜
sansantech
PRO
2
3.8k
Empower GenAI with Agile - あなたのアジャイルが生成AIのバフになる仕組み
hageyahhoo
1
180
しくみを学んで使いこなそう GitHub Copilot app
torumakabe
2
240
完全自律ロボットを作りたくて、先に開発を自律させた話(ROS Japan UG #63 LT)
rryz09
0
540
Oracle Exadata Database Service on Cloud@Customer X11M (ExaDB-C@C) サービス概要
oracle4engineer
PRO
2
8.4k
Featured
See All Featured
Evolution of real-time – Irina Nazarova, EuRuKo, 2024
irinanazarova
9
1.4k
Effective software design: The role of men in debugging patriarchy in IT @ Voxxed Days AMS
baasie
0
450
Utilizing Notion as your number one productivity tool
mfonobong
4
380
GitHub's CSS Performance
jonrohan
1033
470k
Tell your own story through comics
letsgokoyo
1
990
Ethics towards AI in product and experience design
skipperchong
2
330
Design of three-dimensional binary manipulators for pick-and-place task avoiding obstacles (IECON2024)
konakalab
0
490
Dealing with People You Can't Stand - Big Design 2015
cassininazir
367
27k
Fireside Chat
paigeccino
42
4k
Building Better People: How to give real-time feedback that sticks.
wjessup
370
20k
"I'm Feeling Lucky" - Building Great Search Experiences for Today's Users (#IAC19)
danielanewman
230
23k
Leadership Guide Workshop - DevTernity 2021
reverentgeek
1
320
Transcript
Monitoring In Motion Challenges in Monitoring Kubernetes & Containers Cloud
Native SF Meetup Feb 25, 2016 Ilan Rabinovitch Director, Community Datadog
About Me • Long time Datadog user. • Prior to
Datadog built automation and monitoring tooling at Ooyala and Edmunds.com • SCALE and TXLF Co-Founder Ilan Rabinovitch Datadog
[email protected]
@irabinovitch
Agenda • Monitoring 101 - Crash Course • Challenges in
Monitoring Dynamic Infrastructure • Demo Time • Questions?
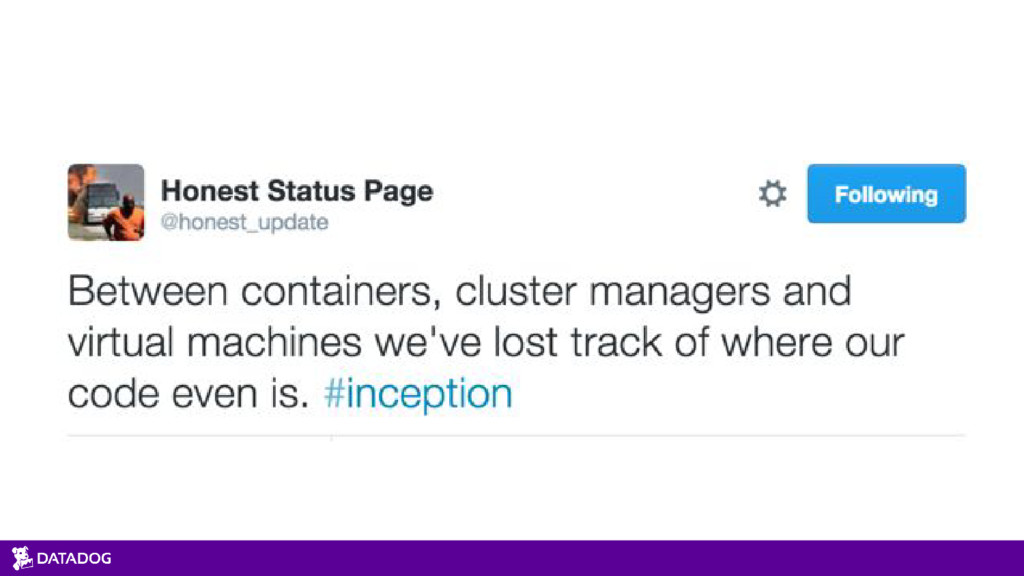
Monitoring Everything
None
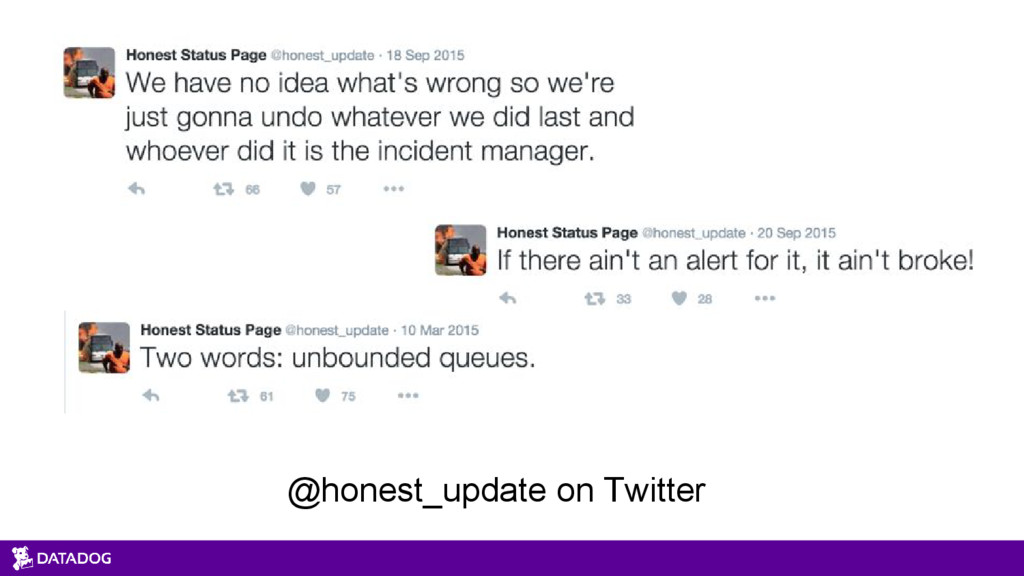
@honest_update on Twitter
Quick Overview of Datadog • Monitoring for modern applications. •
Time series storage of metrics and events. • Trending, alerting and anomaly detection. • Hundreds of integrations out of the box.
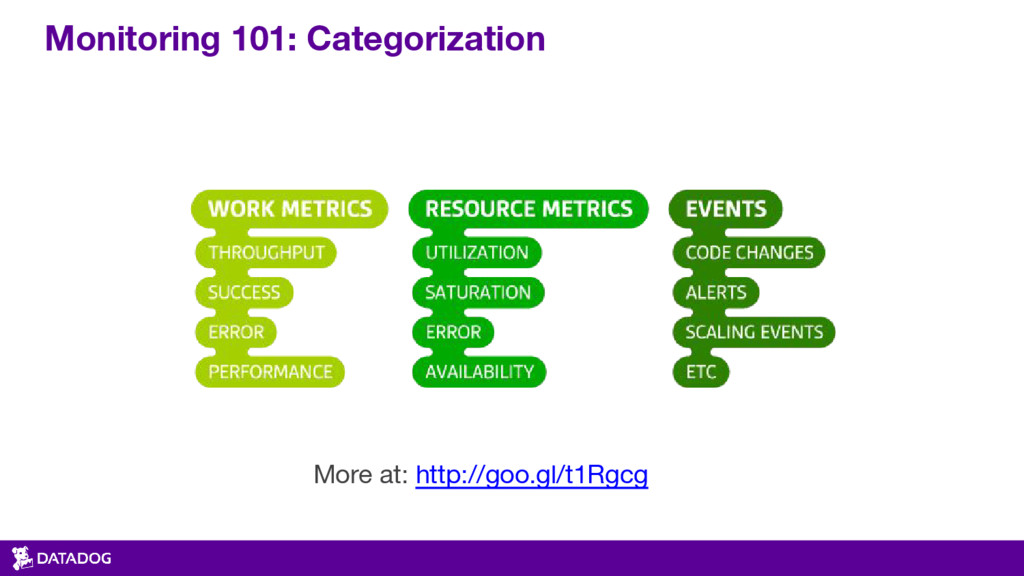
Monitoring 101: Categorization More at: http://goo.gl/t1Rgcg
None
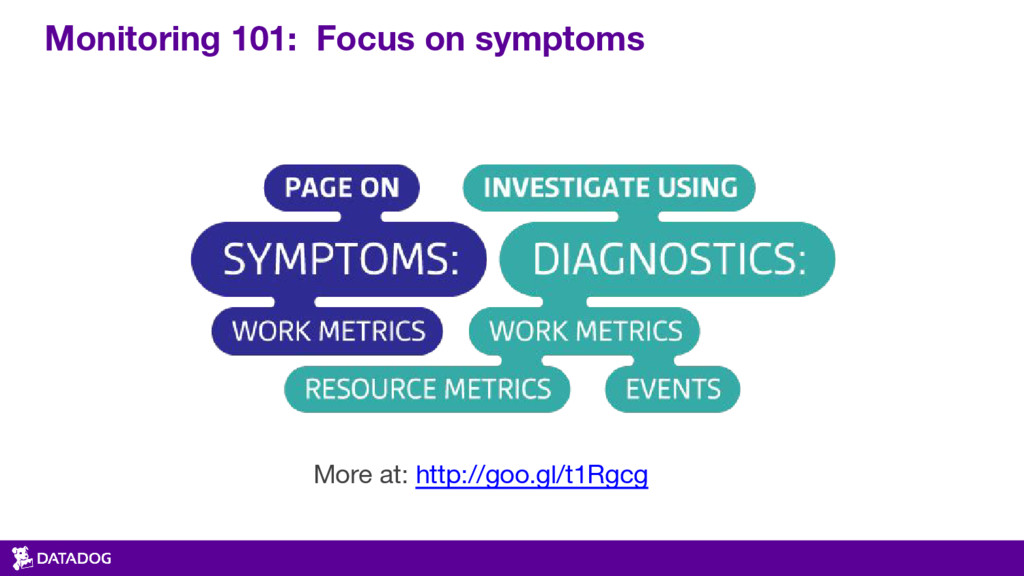
Monitoring 101: Focus on symptoms More at: http://goo.gl/t1Rgcg
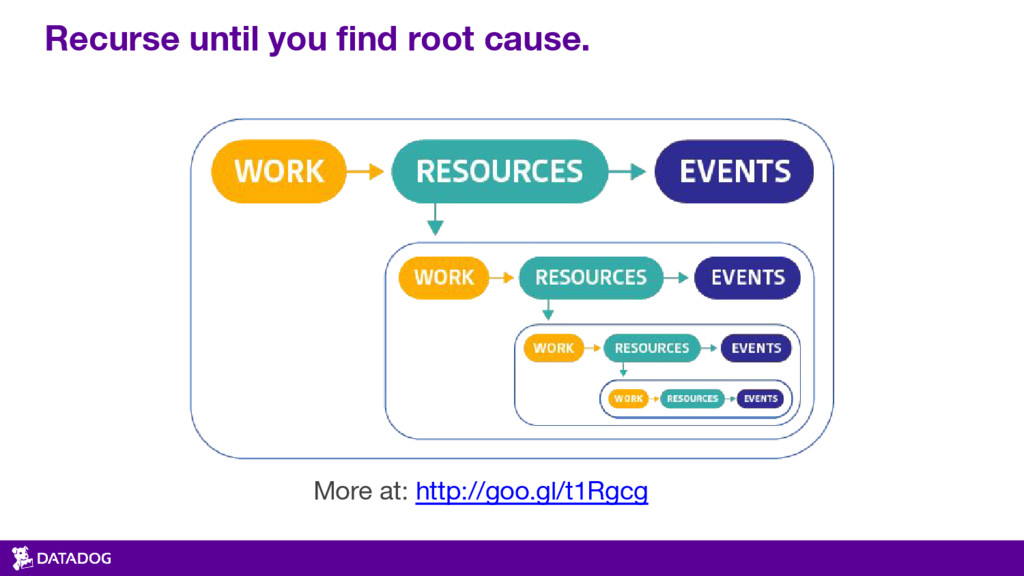
Recurse until you find root cause. More at: http://goo.gl/t1Rgcg
Container Monitoring Challenges
https://www.datadoghq.com/docker-adoption/
None
None
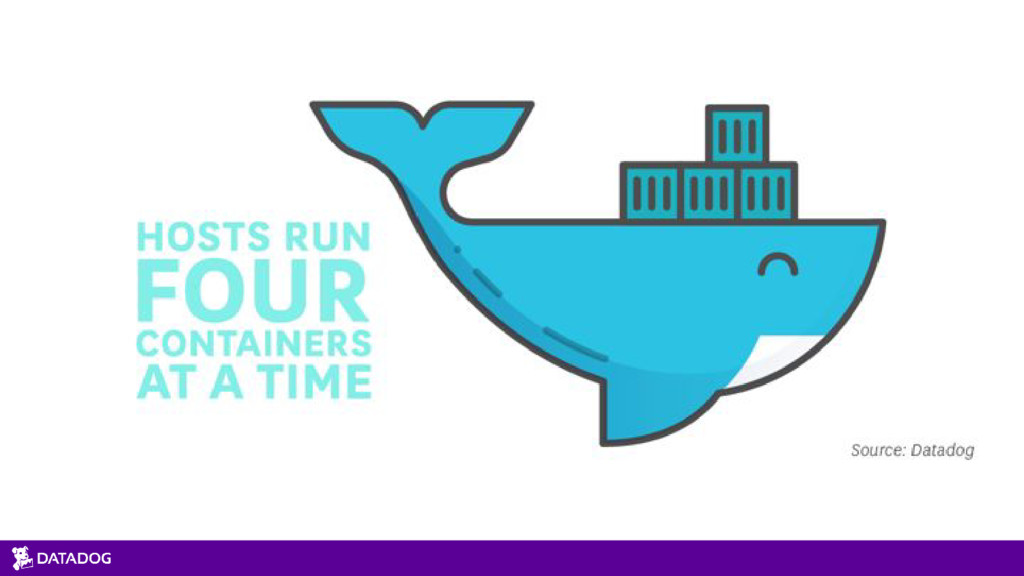
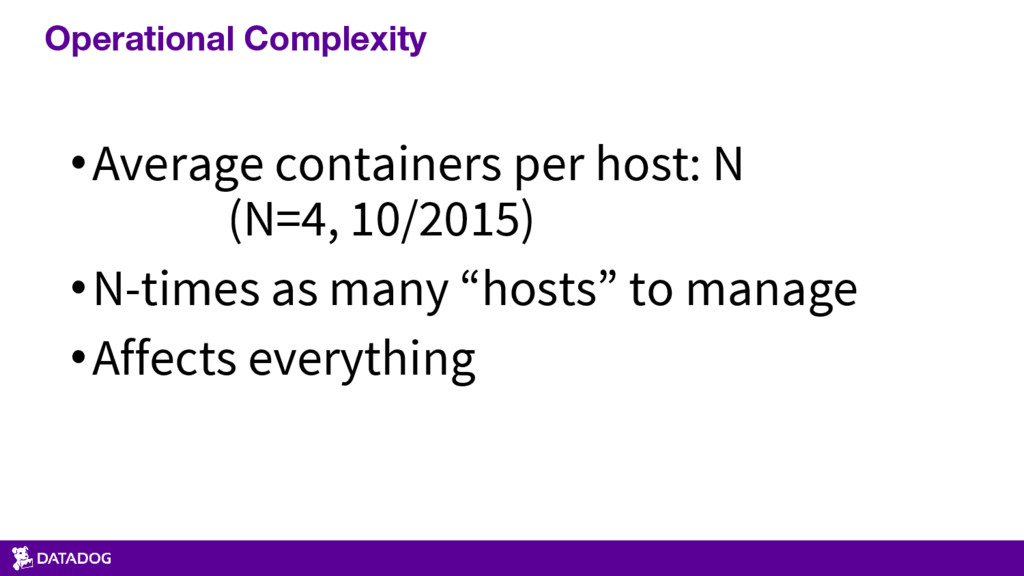
Operational Complexity •Average containers per host: N (N=4, 10/2015) •N-times
as many “hosts” to manage •Affects everything
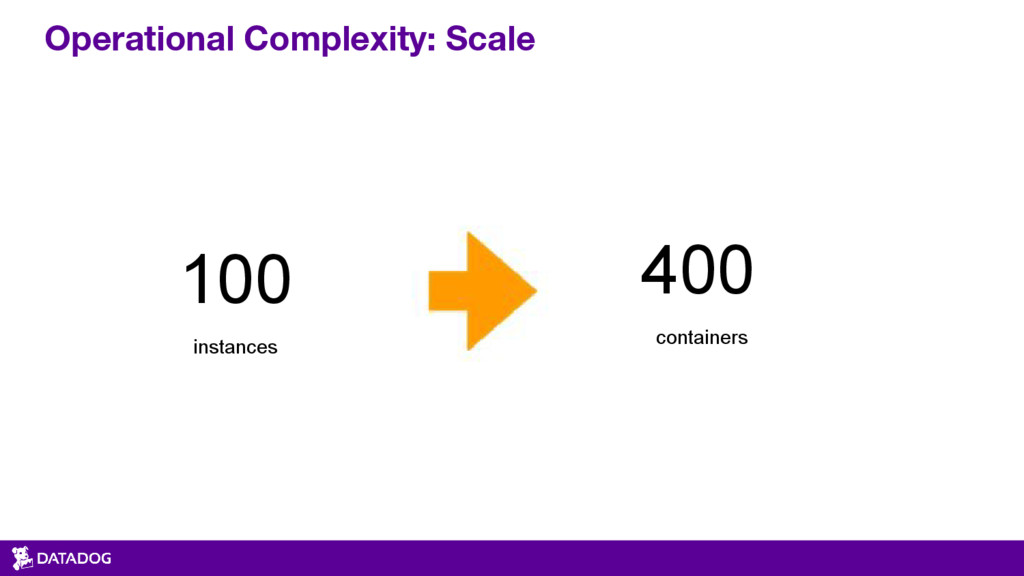
Operational Complexity: Scale 100 instances 400 containers
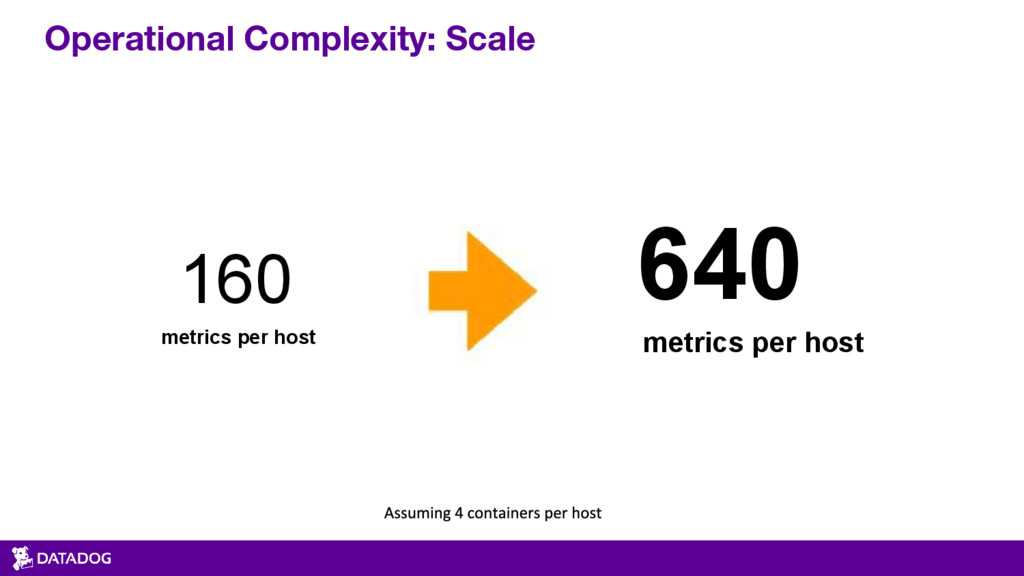
Operational Complexity: Scale 160 metrics per host 640 metrics per
host
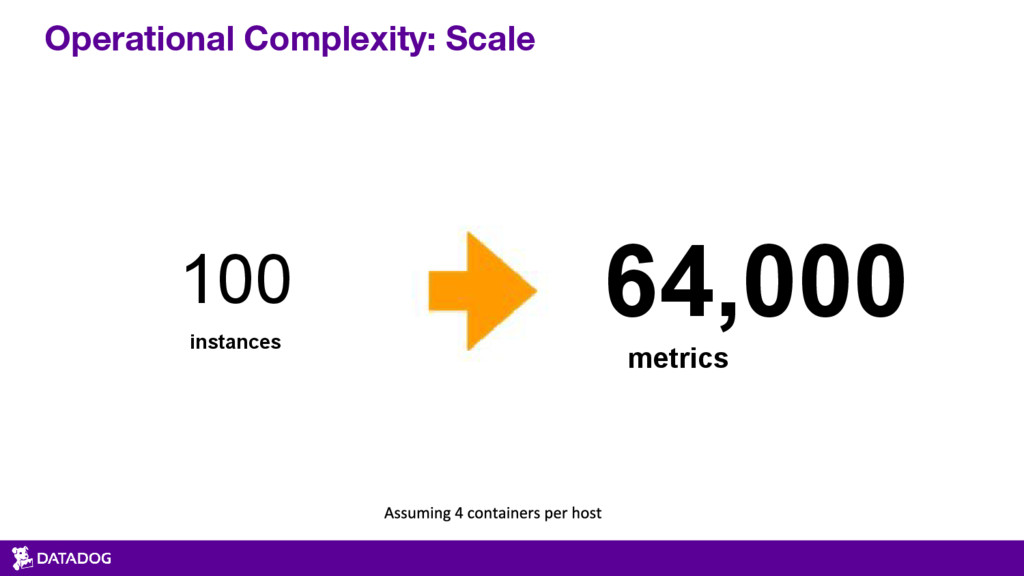
Operational Complexity: Scale 100 instances 64,000 metrics
None
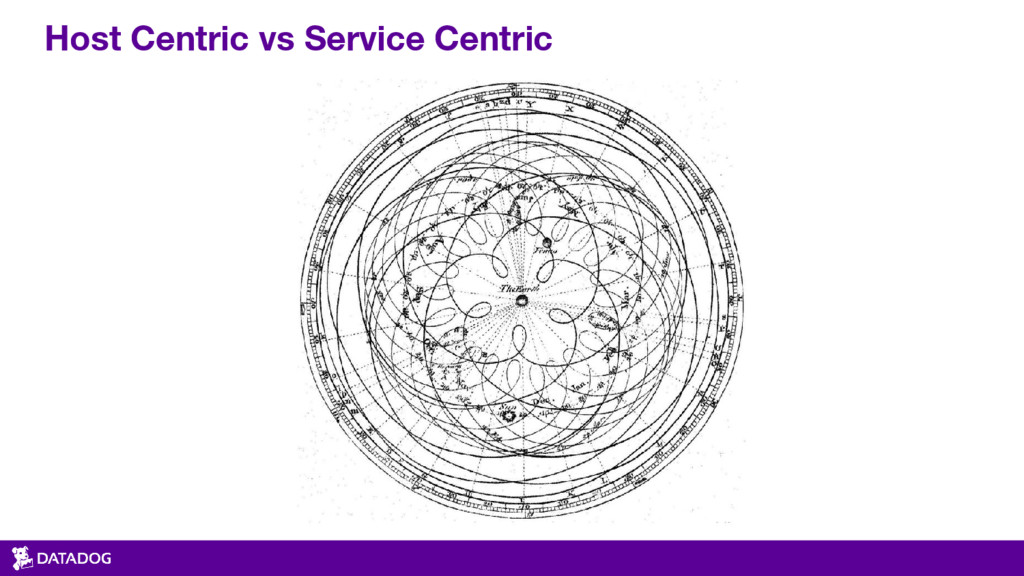
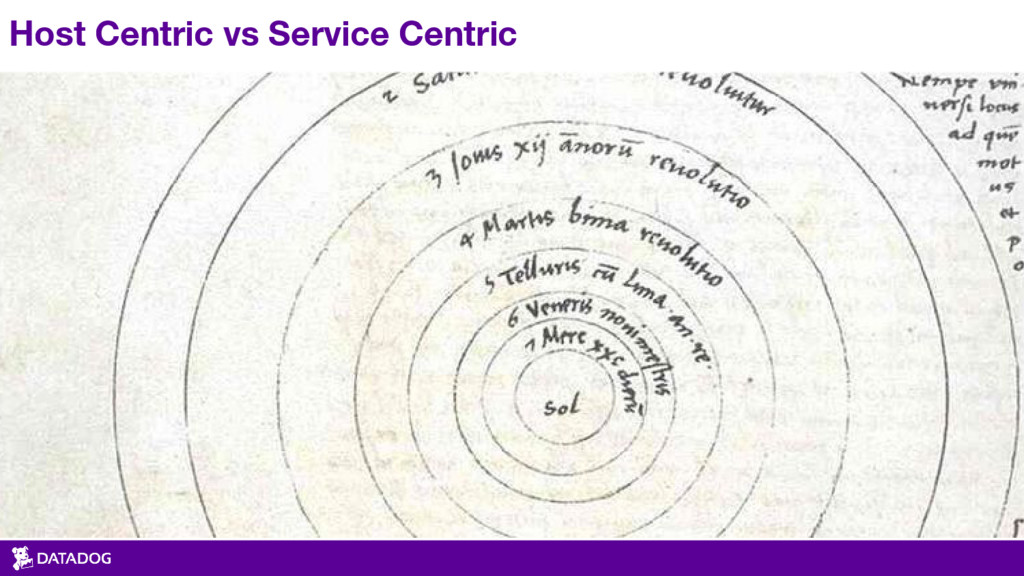
Host Centric vs Service Centric
Host Centric vs Service Centric
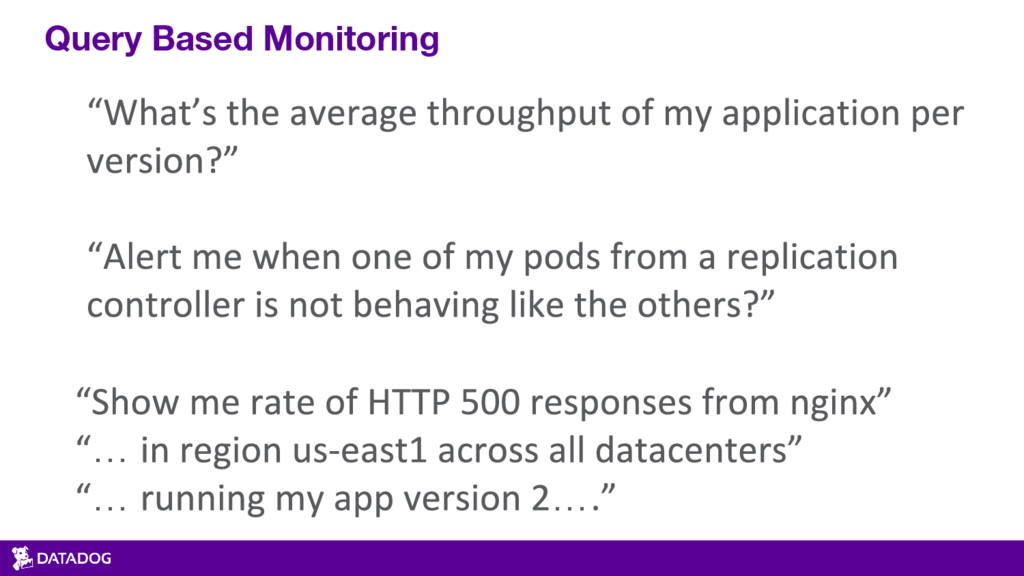
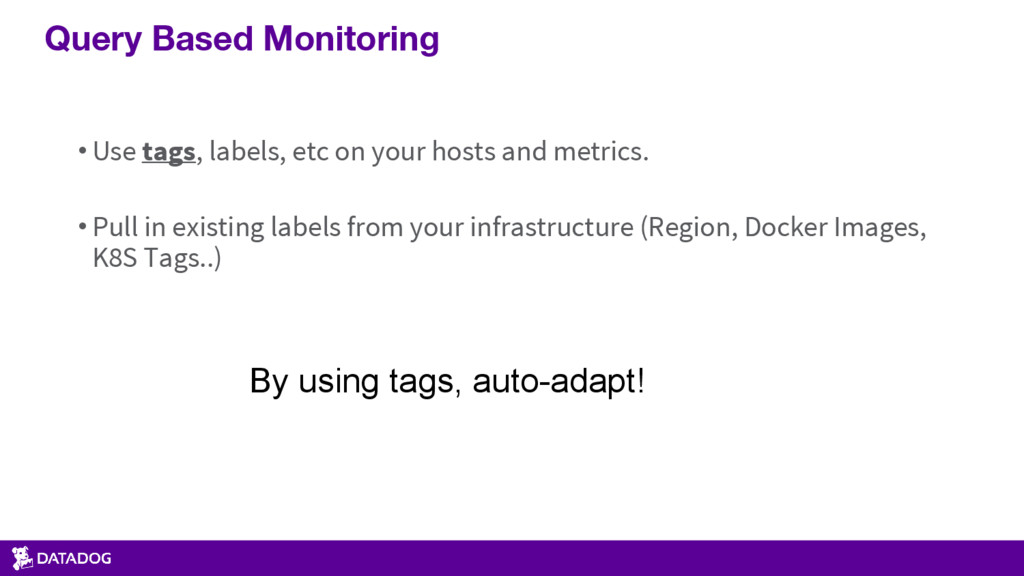
Query Based Monitoring … … …
•Use tags, labels, etc on your hosts and metrics. •Pull
in existing labels from your infrastructure (Region, Docker Images, K8S Tags..) Query Based Monitoring By using tags, auto-adapt!
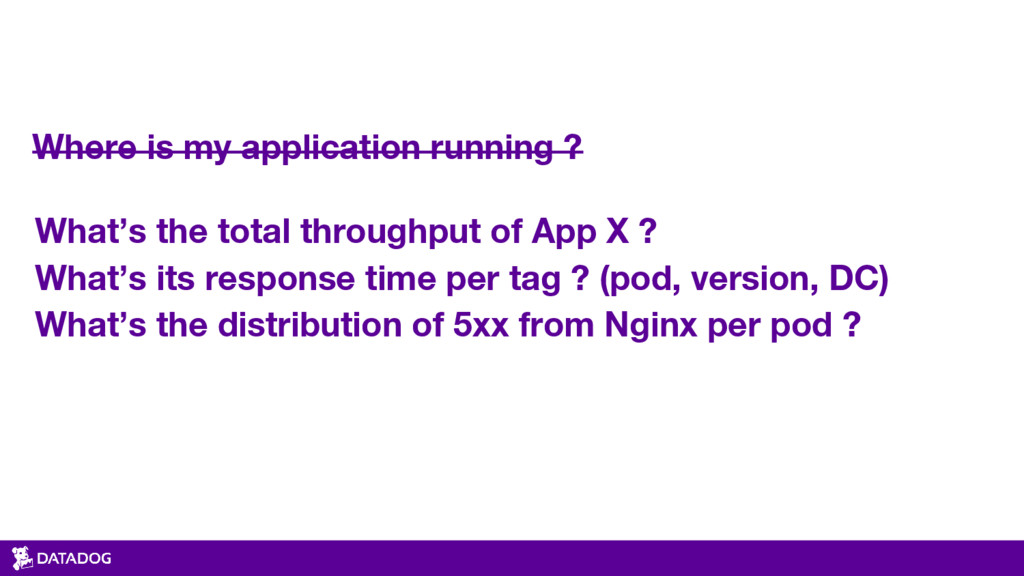
Where is my application running ? What’s the total throughput
of App X ? What’s its response time per tag ? (pod, version, DC) What’s the distribution of 5xx from Nginx per pod ?
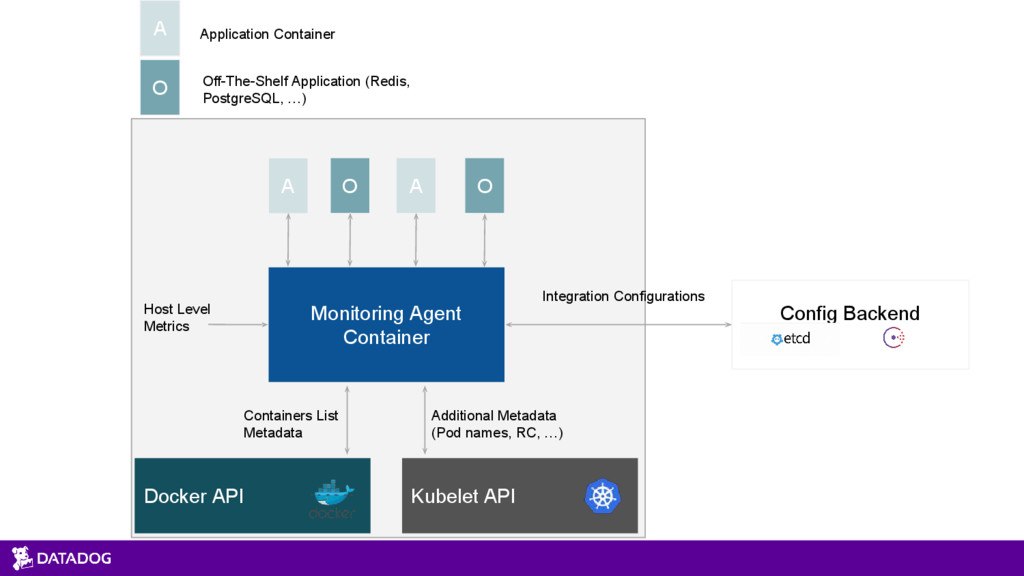
Auto Discovery
Docker API Kubelet API Monitoring Agent Container A O A
O A O Application Container Off-The-Shelf Application (Redis, PostgreSQL, …) Containers List Metadata Additional Metadata (Pod names, RC, …) Config Backend Integration Configurations Host Level Metrics
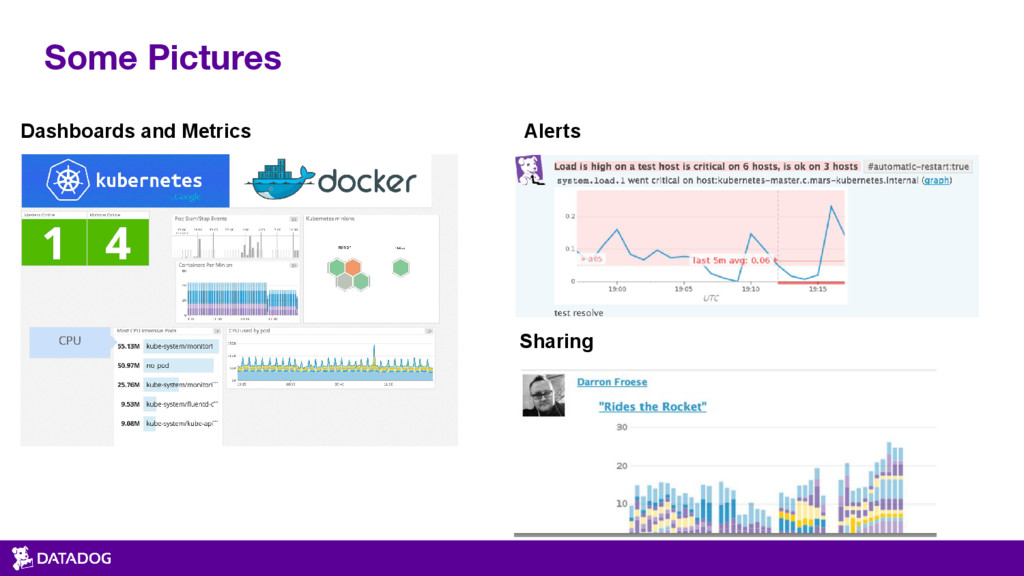
Some Pictures Dashboards and Metrics Alerts Sharing
Demo time