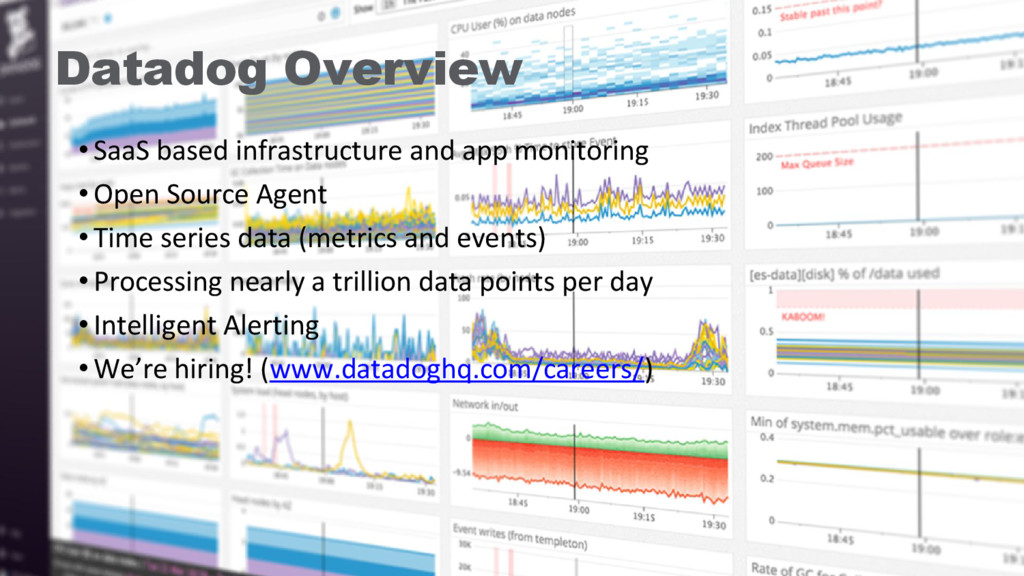
series data (metrics and events) •Processing nearly a trillion data points per day •Intelligent Alerting •We’re hiring! (www.datadoghq.com/careers/) Datadog Overview
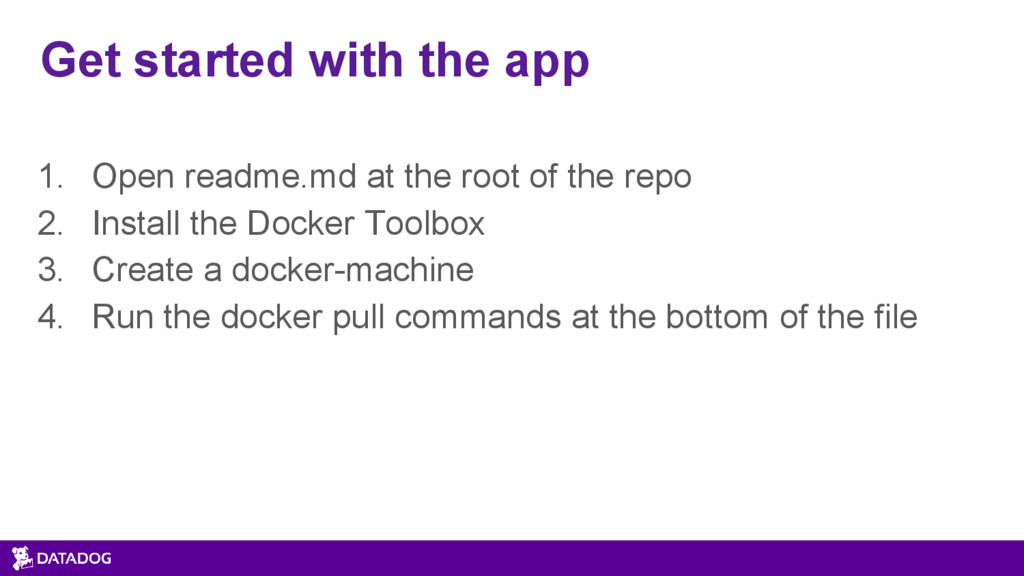
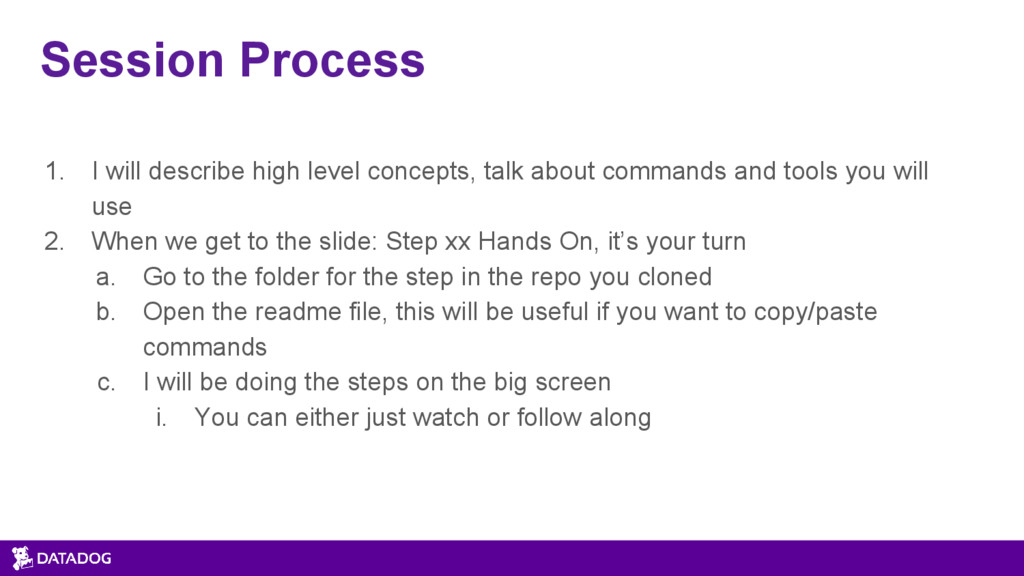
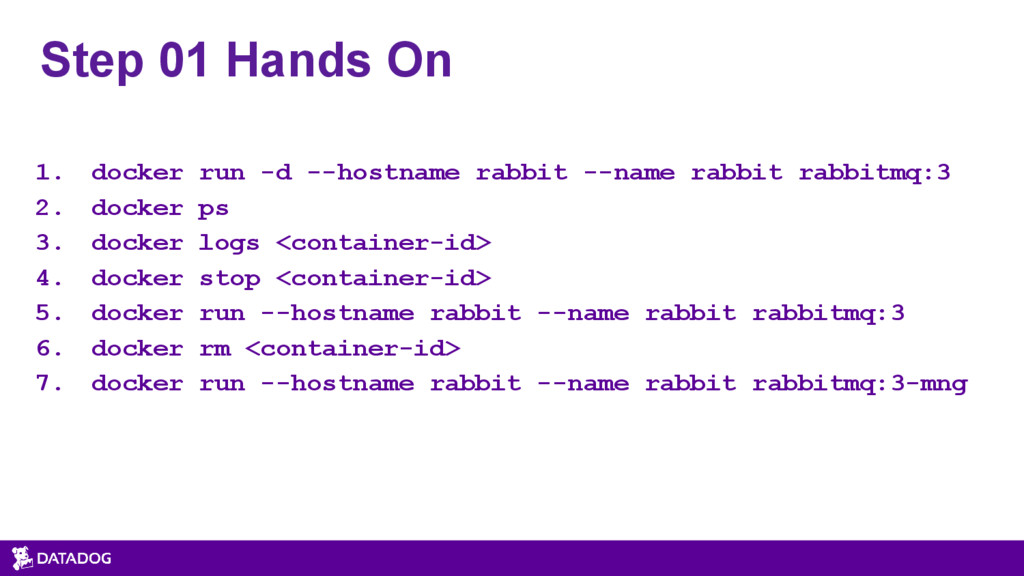
about commands and tools you will use 2. When we get to the slide: Step xx Hands On, it’s your turn a. Go to the folder for the step in the repo you cloned b. Open the readme file, this will be useful if you want to copy/paste commands c. I will be doing the steps on the big screen i. You can either just watch or follow along
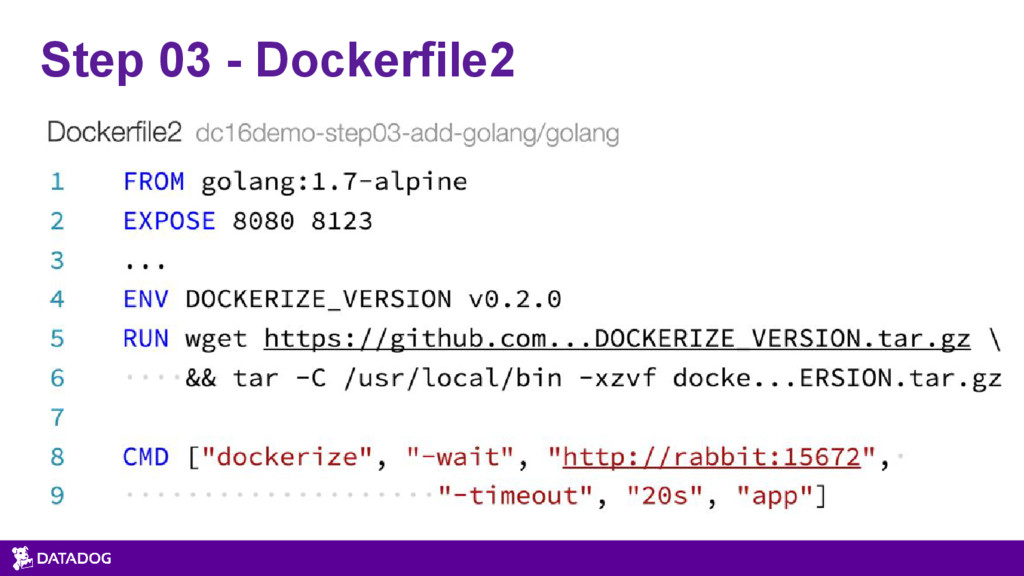
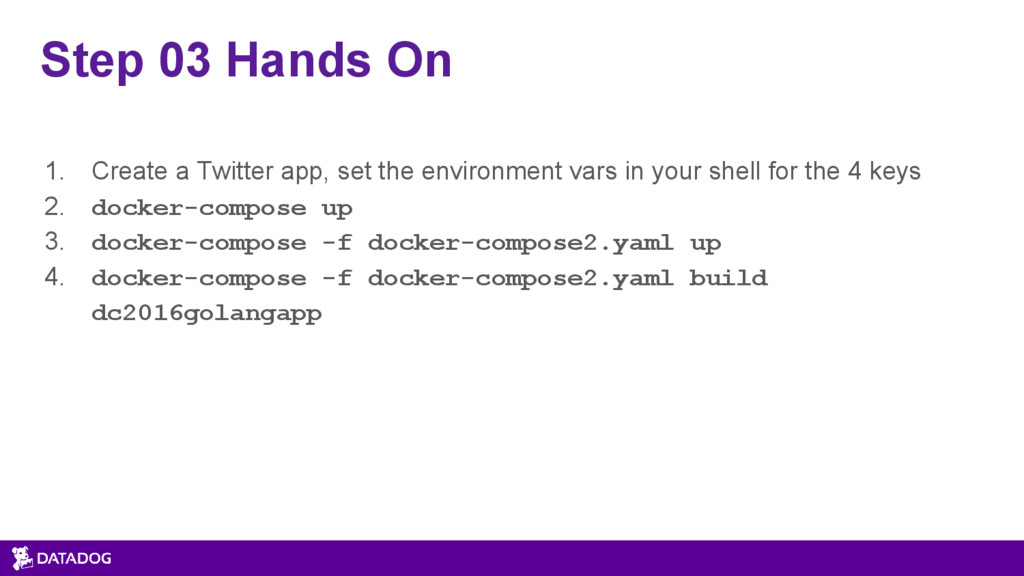
the environment vars in your shell for the 4 keys 2. docker-compose up 3. docker-compose -f docker-compose2.yaml up 4. docker-compose -f docker-compose2.yaml build dc2016golangapp
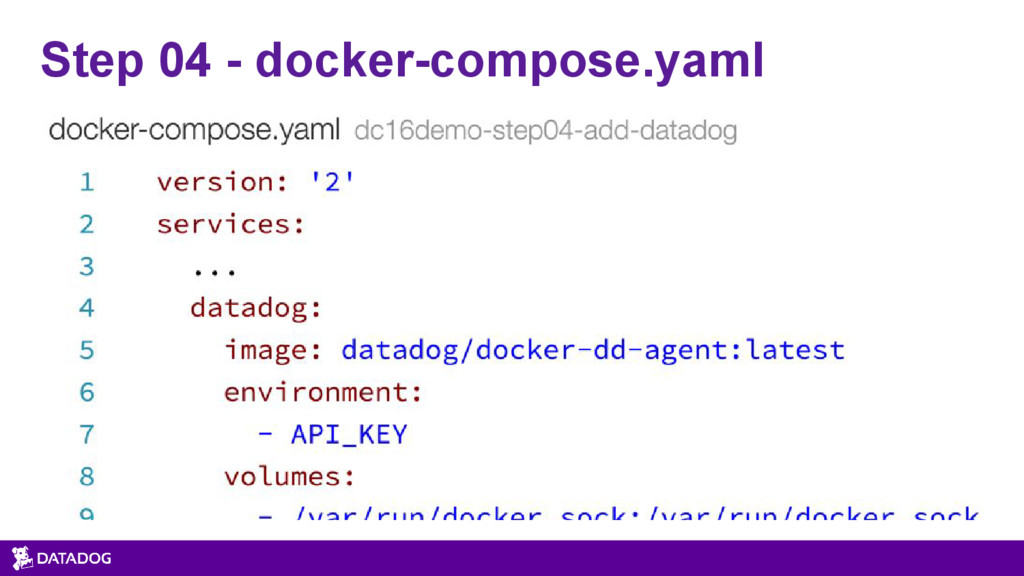
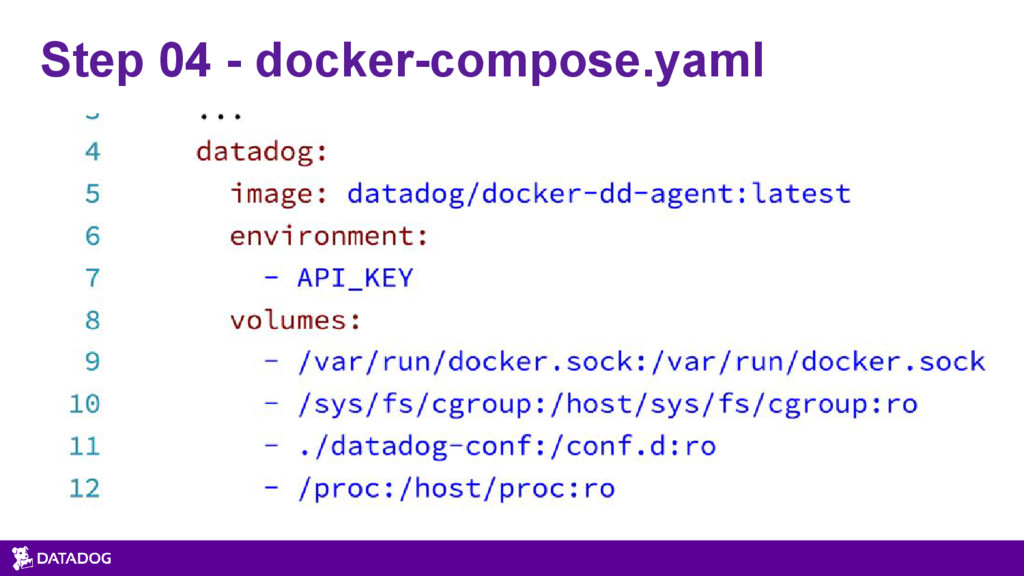
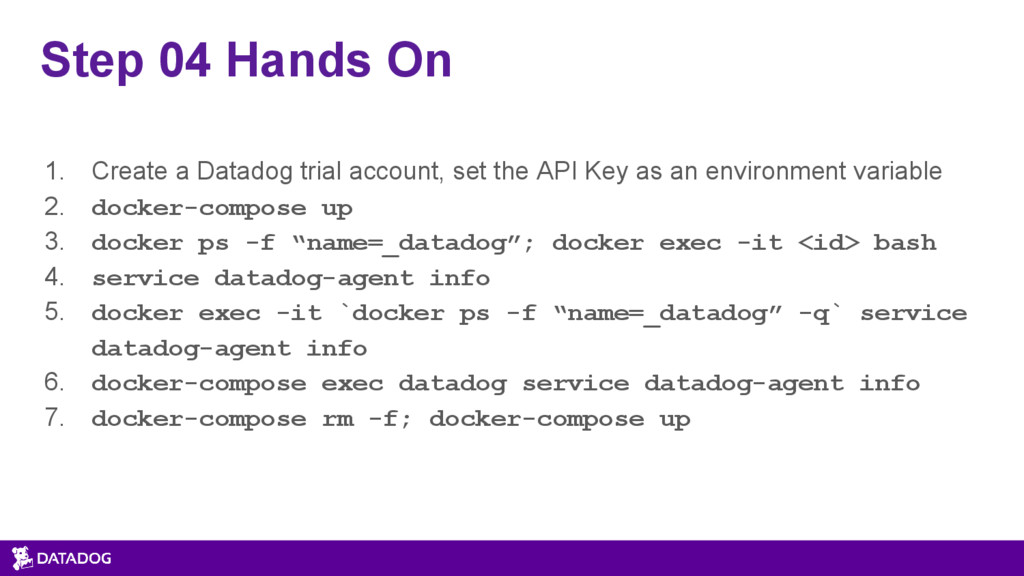
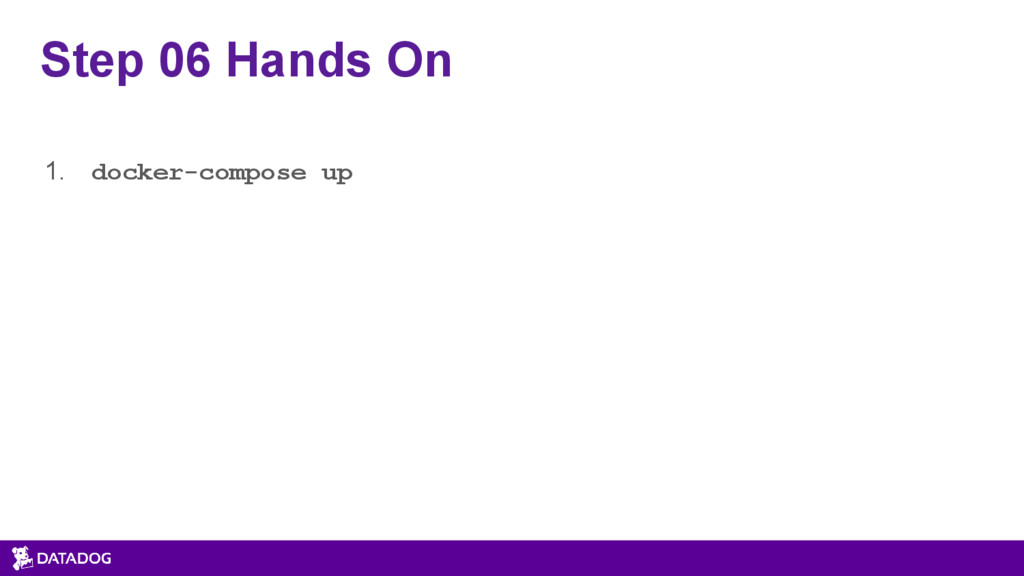
set the API Key as an environment variable 2. docker-compose up 3. docker ps -f “name=_datadog”; docker exec -it <id> bash 4. service datadog-agent info 5. docker exec -it `docker ps -f “name=_datadog” -q` service datadog-agent info 6. docker-compose exec datadog service datadog-agent info 7. docker-compose rm -f; docker-compose up
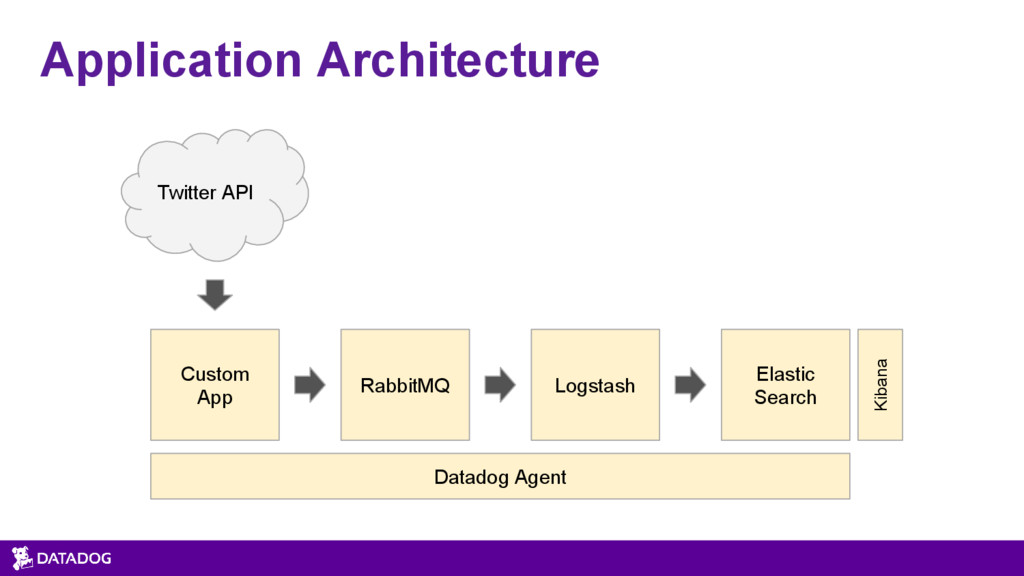
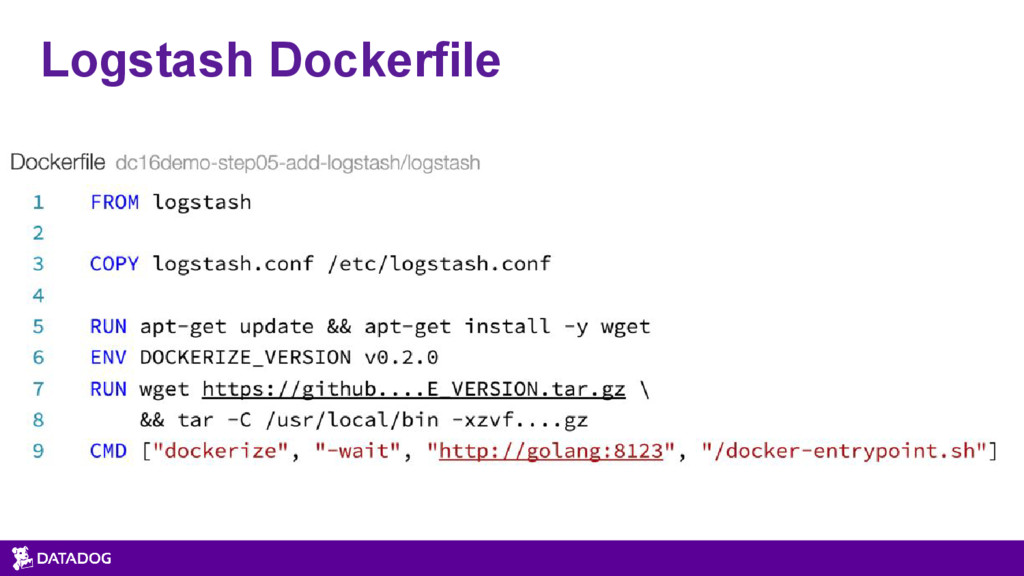
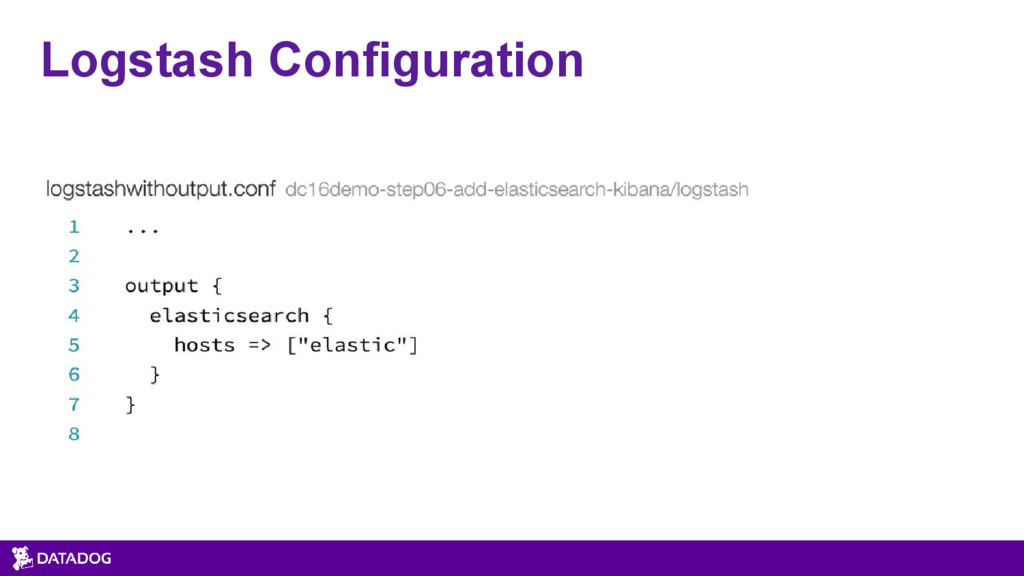
Part of the ELK (ElasticSearch, Logstash, Kibana) Stack “Provides the ability to filter, massage, and shape the data so that it’s easier to work with” (logz.io tutorial on logstash)
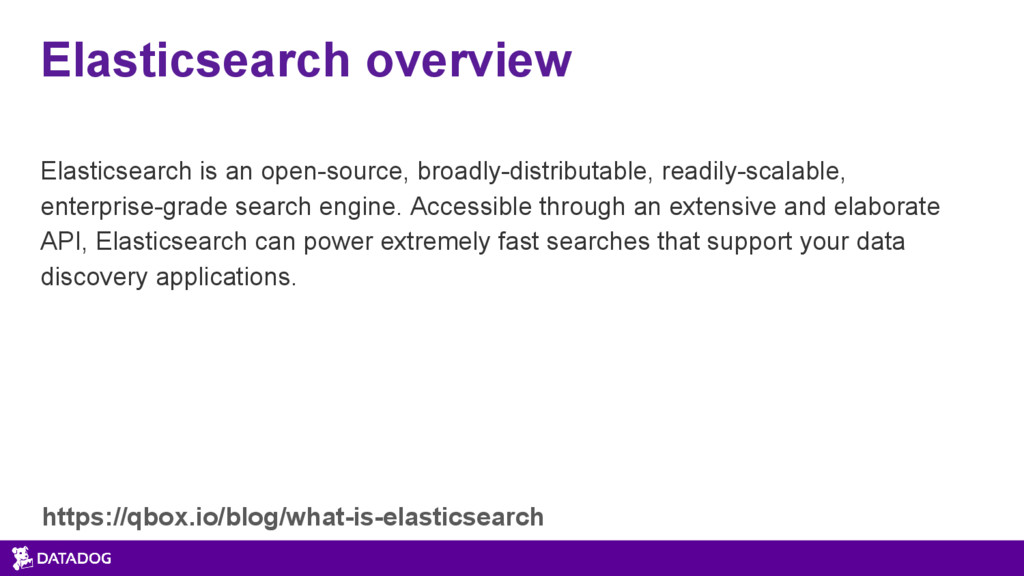
engine. Accessible through an extensive and elaborate API, Elasticsearch can power extremely fast searches that support your data discovery applications. https://qbox.io/blog/what-is-elasticsearch
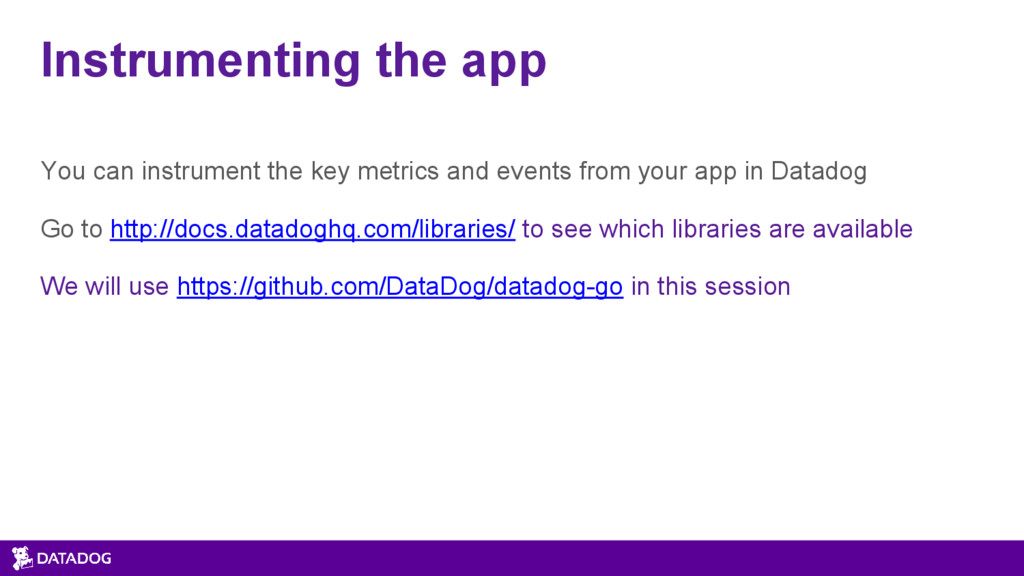
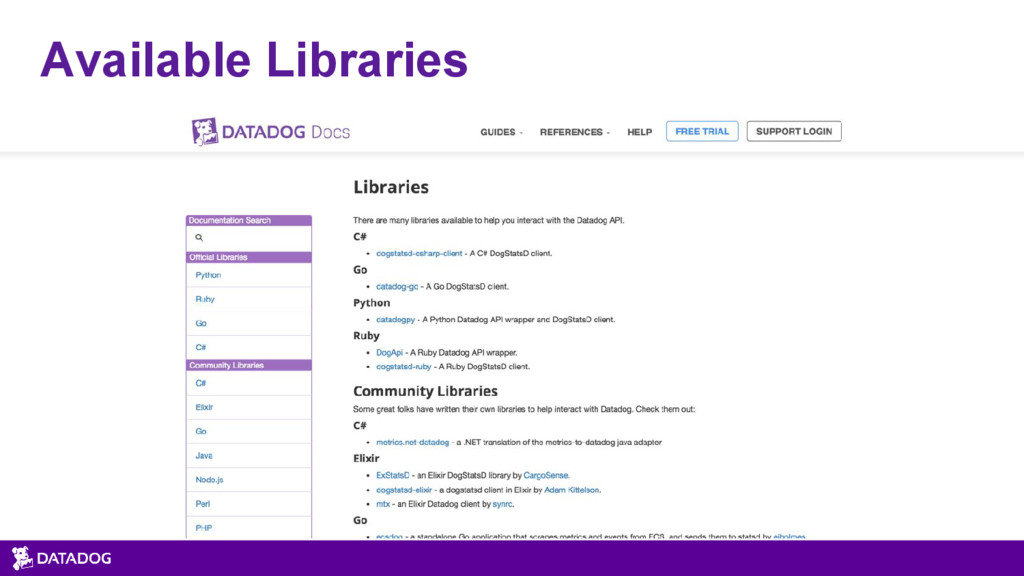
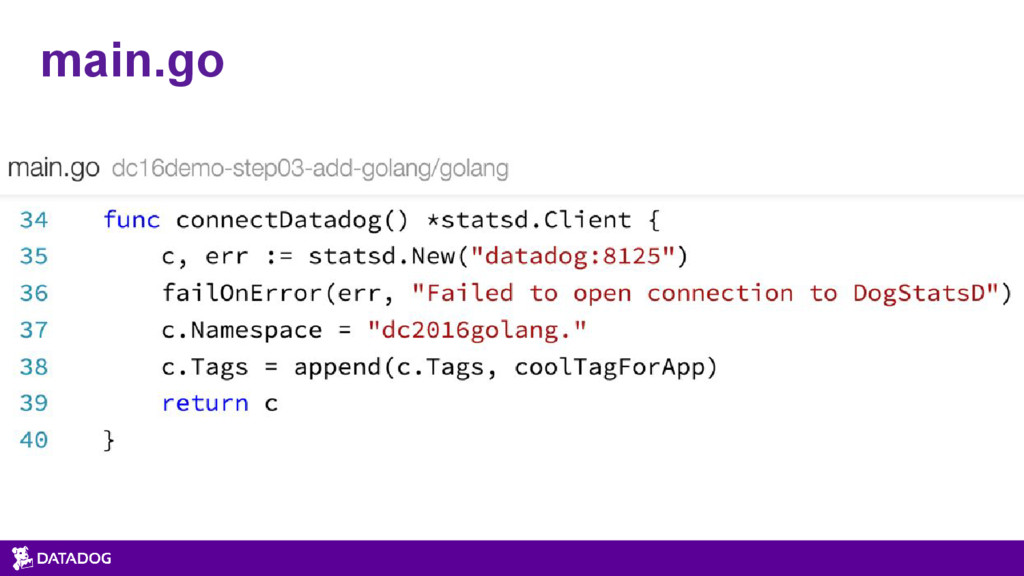
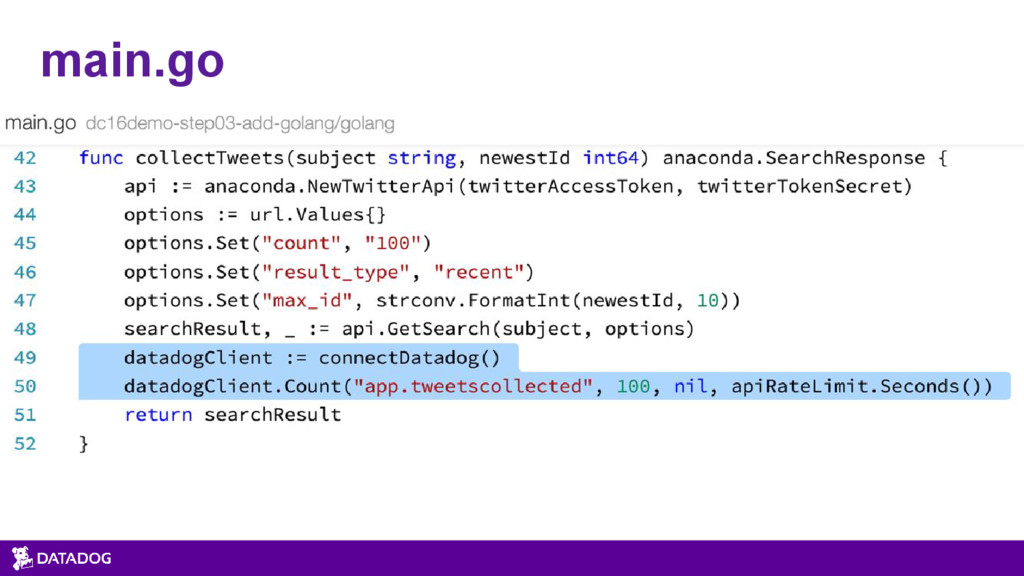
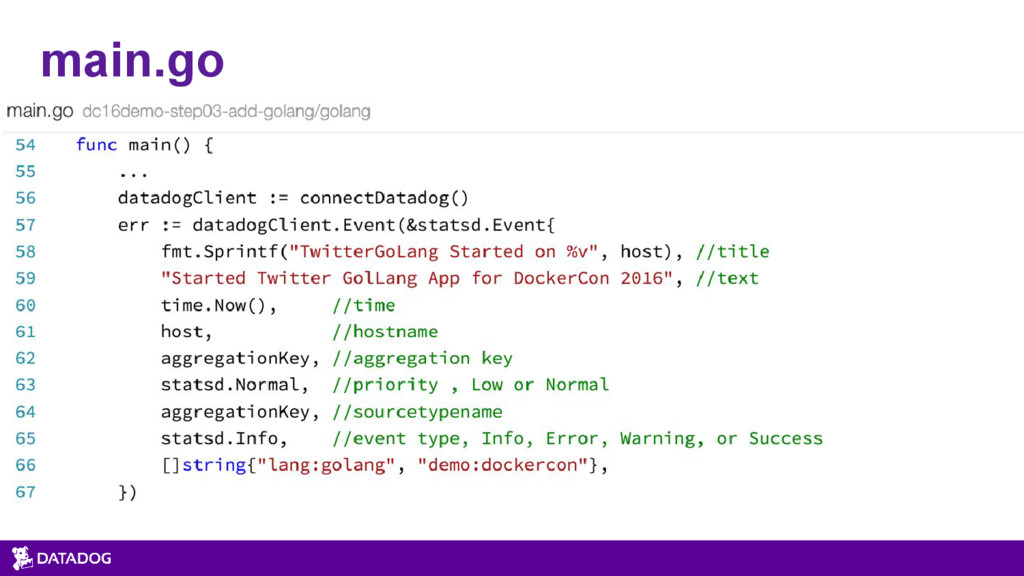
events from your app in Datadog Go to http://docs.datadoghq.com/libraries/ to see which libraries are available We will use https://github.com/DataDog/datadog-go in this session
![Introduction to Docker Monitoring Matt Williams - @technovangelist - [email protected]](https://files.speakerdeck.com/presentations/b7c5f965d89f4385881c45c8d3bd3aaa/slide_0.jpg)
![Introduction to Docker Monitoring Matt Williams - @technovangelist - [email protected]](https://files.speakerdeck.com/presentations/b7c5f965d89f4385881c45c8d3bd3aaa/slide_76.jpg)