Upgrade to Pro — share decks privately, control downloads, hide ads and more …

Stories in Travel Data

Stories in Travel Data

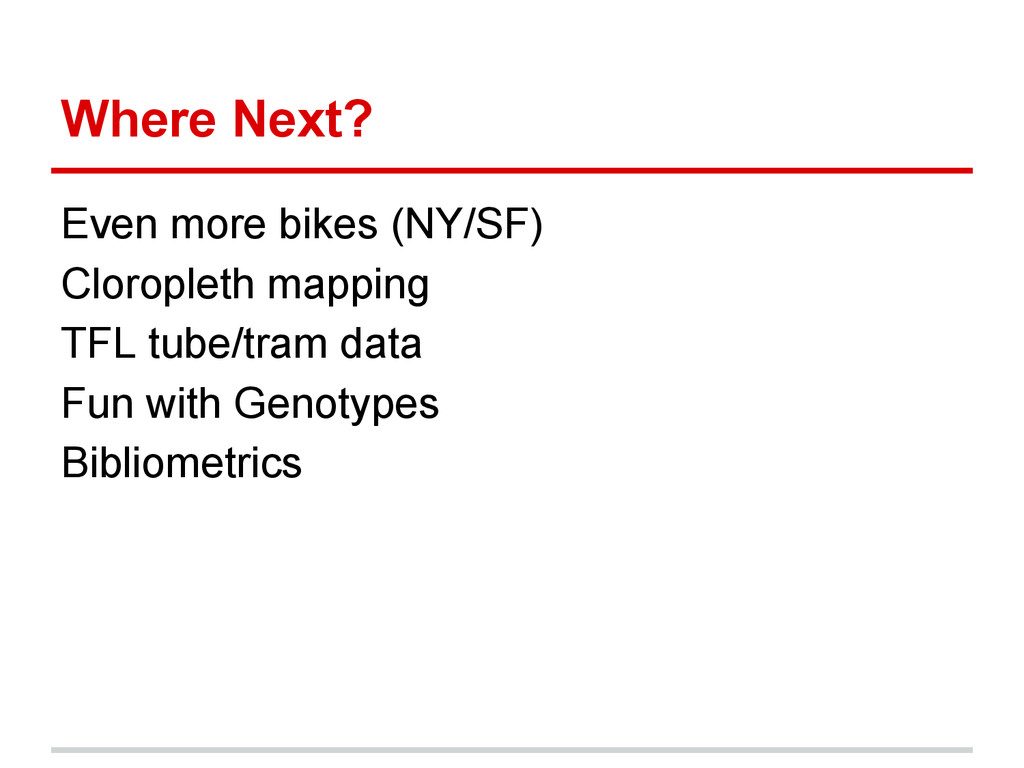
What stories you can tell, and what insights can you gain from travel data? A presentation about the vizualization open flight data, and of bicycle journey data from London's bicycle hire scheme. Actually given at Geomob London, July 17th 2014.

James Siddle

July 17, 2014
Tweet

Other Decks in Technology

Transcript

  1. What? About Me Data, Story, Chart, Design Open Flight Data

    Boris Bike Journeys Boris Bike Journeys (again) Where Next?
  2. Open Flight Data OpenFlights.org “In a nutshell, it's a tool

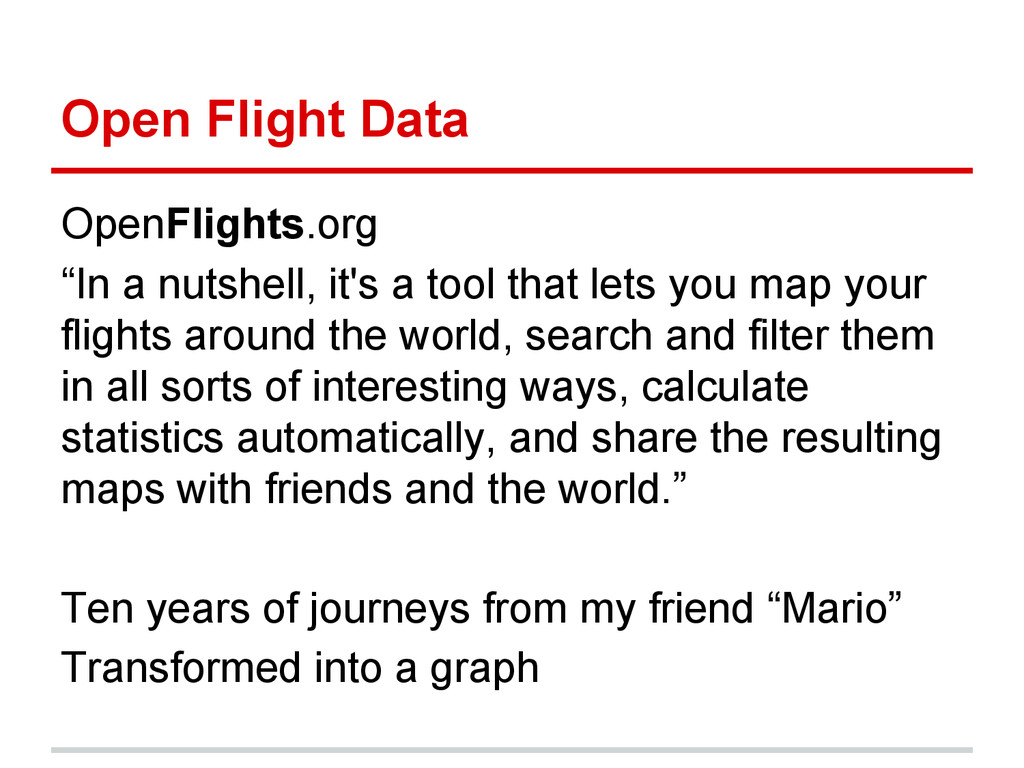
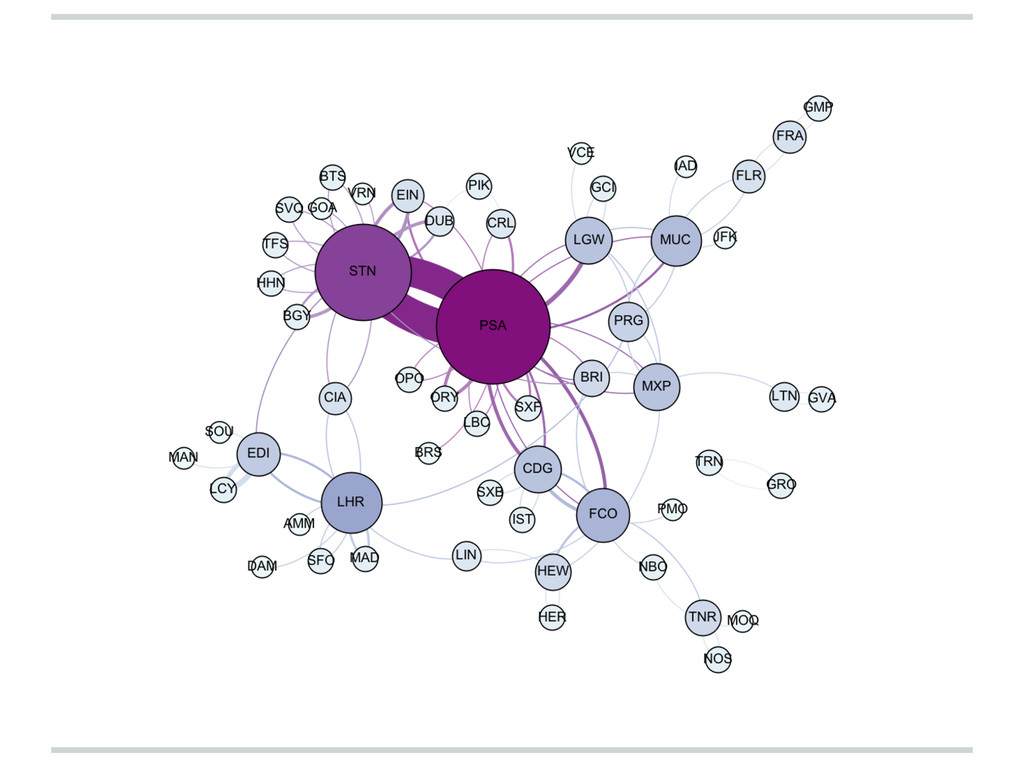
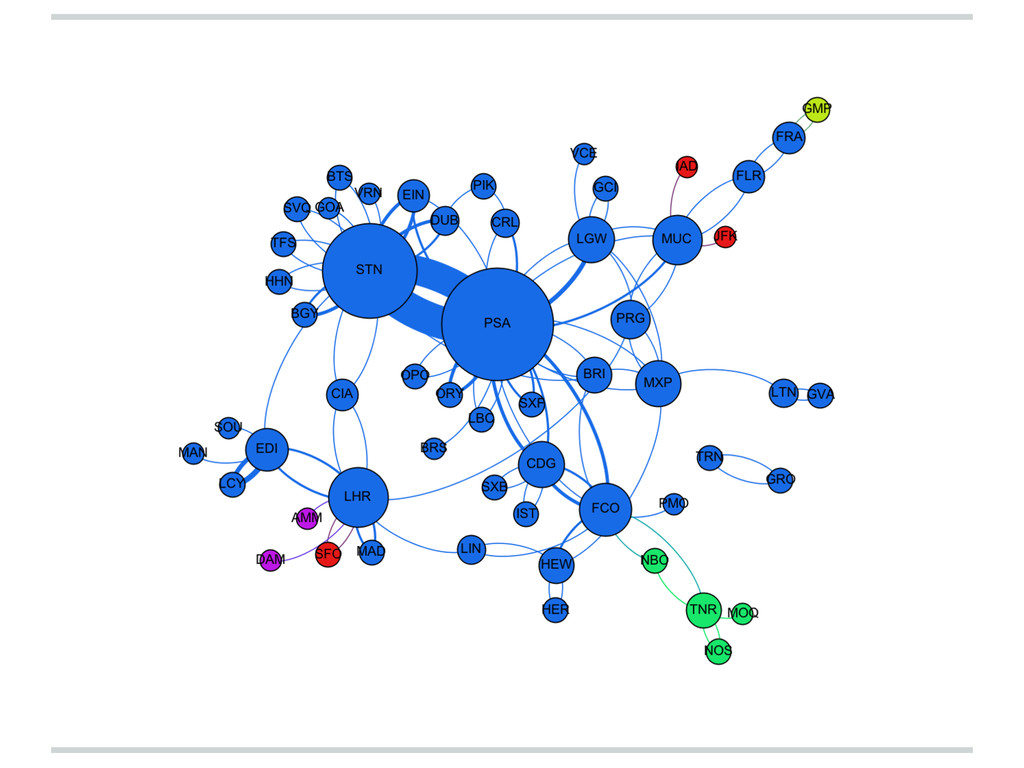
    that lets you map your flights around the world, search and filter them in all sorts of interesting ways, calculate statistics automatically, and share the resulting maps with friends and the world.” Ten years of journeys from my friend “Mario” Transformed into a graph
  3. • Graph visualization (nodes/edges) • Auto-layouts reveal relationships • #journeys

    made = edge weight • #connections = node size • Partitioning • Grouping Visualization Technology - Gephi
  4. Boris Bike Journeys http://www.tfl.gov.uk/info-for/open-data-users/ All Boris Bike journeys for 6

    Months Start/end dates and times Start/end stations Station IDs … more Augmented with geo data for stations
  5. Boris Bike Journeys (again) Focus on Customer IDs Associated with

    each discrete journey Possible oversight by TFL Opted for custom JS vizualization
  6. More Technology MySQL - relational store LeafletJS • Simple •

    Easy to use • Plug in different tilesets • Rich interactivity of javascript Raw journey data - processed in JS